

How to measure resolution?
For all the talk about criteria and definitions, measuring the resolution of a microscope is more nuanced than you’d think. The scales at which microscopes operate today are subject to noise and background that obscure and distort signals. What you use for the measurement can make a big difference.
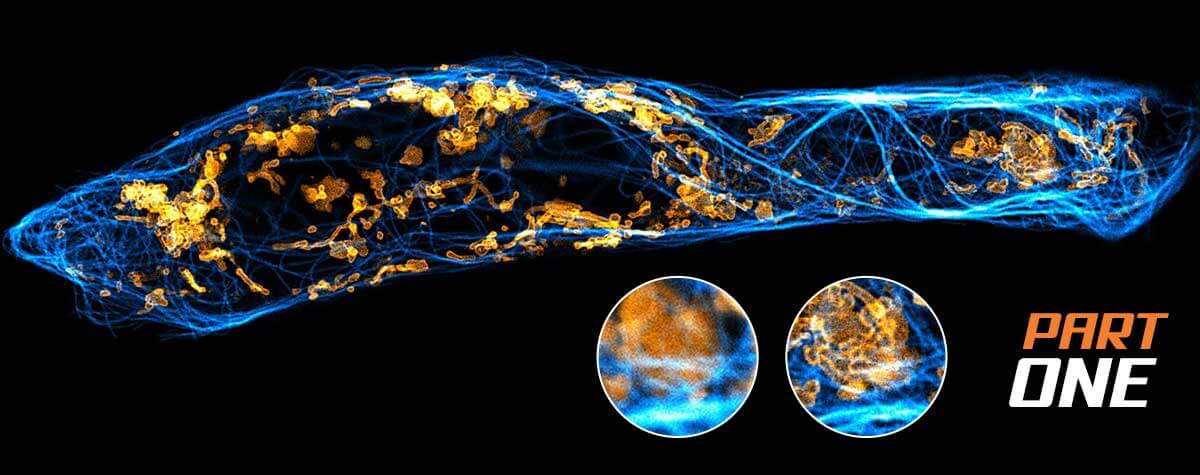
Part two!
Defining a tiny distance in a sea of noise
The resolving power of a microscope is its ability to discriminate two points in a sample. Standard criteria equate resolution with the width of the point spread function (PSF) that blurs details in images. Practically speaking, those measurements are done on the intensity profile of a point’s PSF, taking the full width at half maximum peak or the FWHM (Figure 1)1 . Modern microscopes, however, reach unprecedented resolution levels. At those scales, variability is a dominant force and that has consequences for how we measure resolution. For more information take a look at ”Part one – What is resolution?“
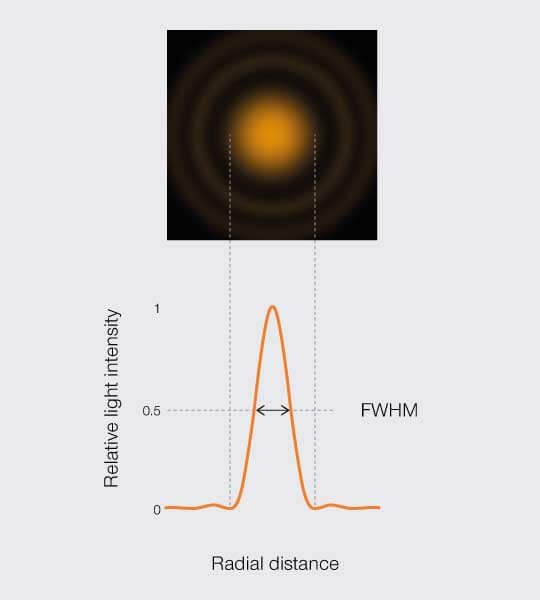
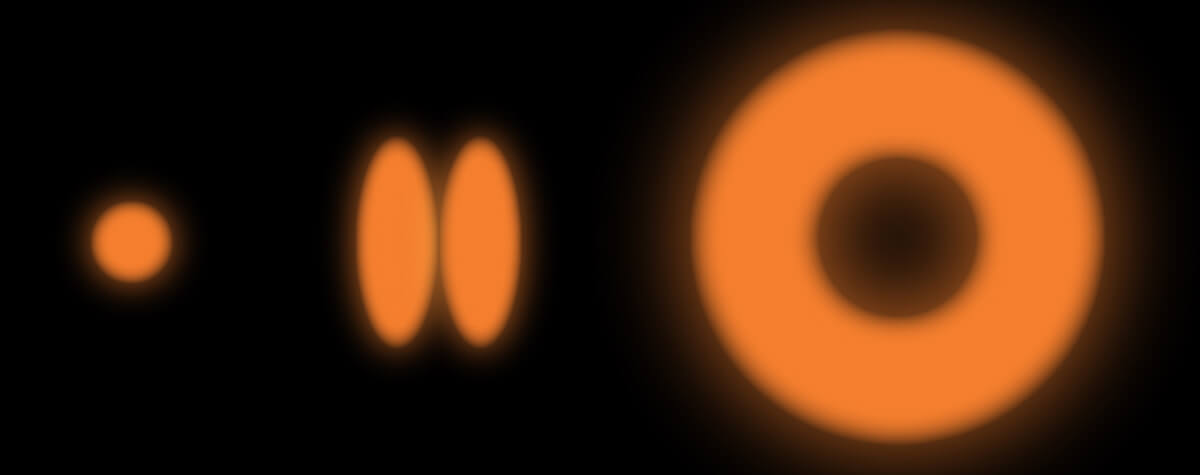
Figure 1.
Approximating resolution based on the full width at half maximum (FWHM) of the PSF intensity profile.
1 Given that resolution is about telling two points apart, why is it enough to measure the PSF of one point instead of two? Imaging with a microscope is a linear operation. The process of imaging one point is not influenced by the other points in a specimen. Thus, if we know the PSF of one point, we know the PSF for any other point.
No longer towering over noise
The FWHM is a fair approximation of resolution, especially when the point imaged is substantially smaller than the PSF and the signal of that point vastly outweighs noise and background. But at high resolution, neither condition really holds. As resolution goes up, you have to work with increasingly smaller points, which in the case of fluorescence leads to notoriously dim signals that are difficult to distinguish from background. In fact, the flux of photons detected by superresolution microscopes is awash in a sea of variability that distorts the signal itself and obfuscates measurements. There’s noise from the instrumentation and there’s background, like fluorescence from optical components and from molecules outside of the plane of interest. There’s also noise from stochastic fluctuations in photon detection which garbles PSF intensity profiles.
Things get messy at high resolution. And thus, measurements become a mission to minimize variability.
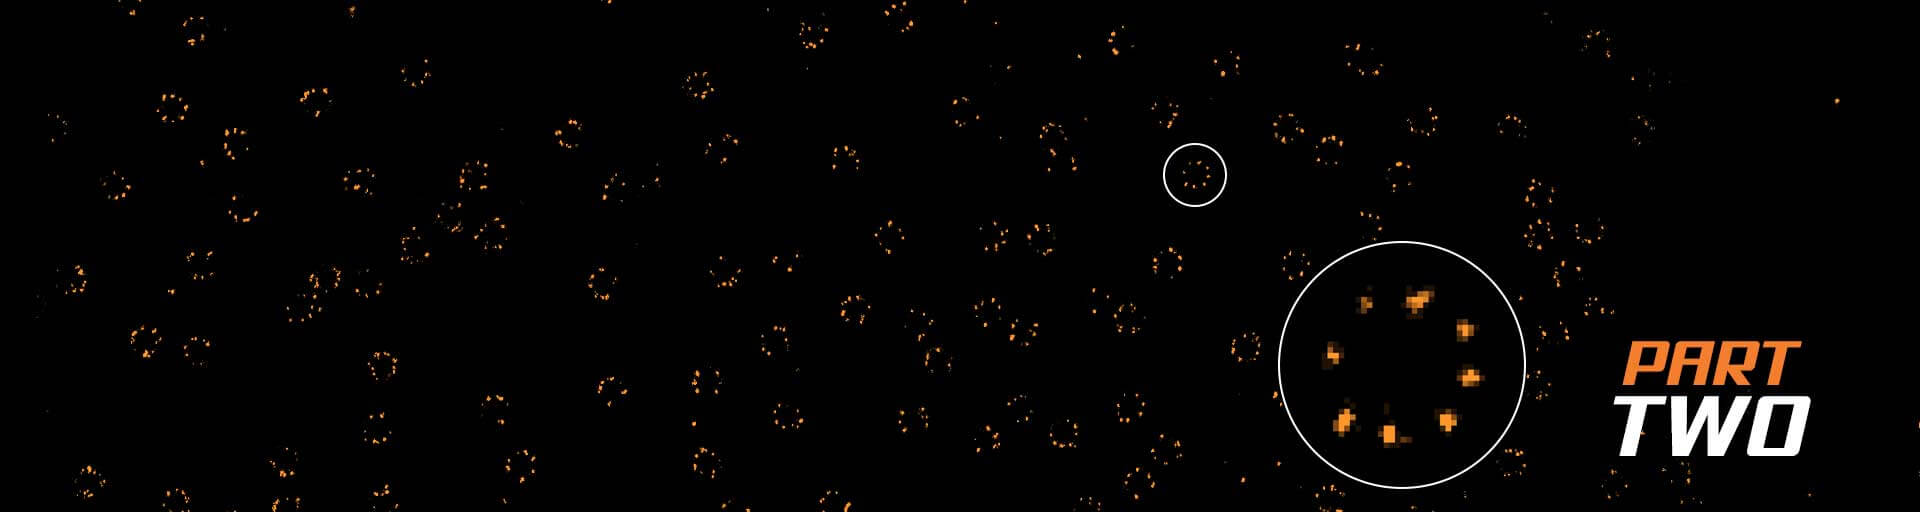
The three horsemen of uncertainty
A thought experiment: you image a random distribution of fluorescent points to measure the resolution of a microscope. Three attributes of your sample play a role in your measurement: the distances between the randomly distributed points, the size of the PSF that each point casts, and the brightness of each point. Why? Because they can all inject variability into your measurements. Depending on how close they are to one another, fluorescent dyes can influence each other’s emission (e.g., quenching) and consequently alter the size and shape of the PSF. Differences among PSF measured – due to point size variation, for example – decreases the reproducibility of measurements. And last but not least, dim florescent points emit fewer photons making PSF intensity profiles more vulnerable to muddling by detection noise.
To get ideally accurate and precise measurements of resolution, you would do well to control these attributes. Go ahead. Stop the thought experiment and throw out the specimen you used. Now, go get a standardized fluorescent dye consisting of probes that are highly reproducible in size, shape, brightness, and distance from one another. These “standard probes” should be small so that what you measure is to the greatest extent possible just PSF. The standard probes should also be bright – emit lots of photons – to overcome detection noise and generate reliable PSF intensity profiles.
OK. Hand over those standard probes, you say.
Yeah, well. It’s not that easy. The truth is none of the currently used standards manages to mitigate variability of all three attributes. Table 1 lists standard probe types used for resolution determination. Each has features that make it more appropriate for certain but not all microscopy systems.
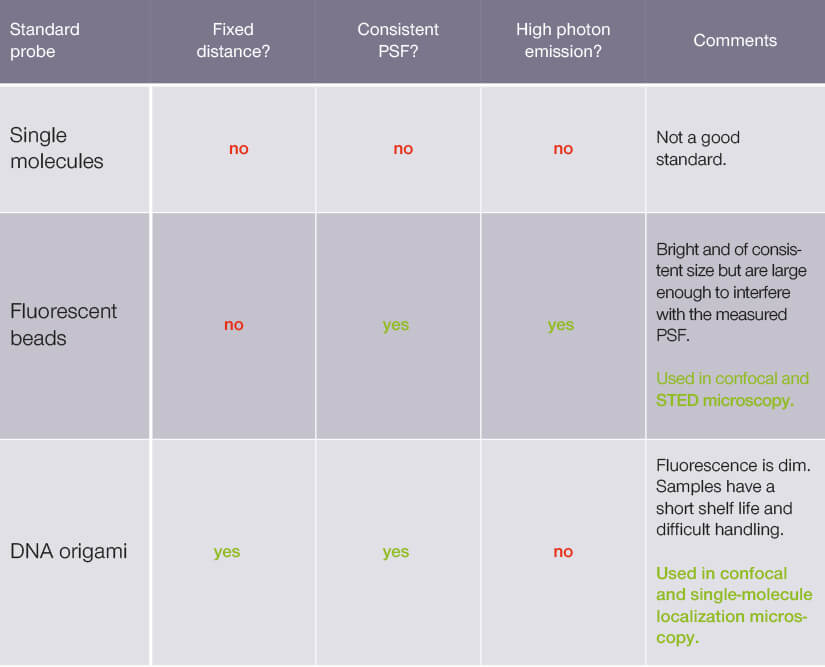
Table 1.
Standard probe type used to measure microscope resolution
At high resolution, point-like emitters like single molecules are a suboptimal standard. They emit a weak fluorescent signal that can be obscured by background and noise. They randomly switch between bright and dark states – something called fluorescence intermittency or blinking – and their emission is influenced by their dipole orientation. Taken together, this means that the emission intensity of a point-like emitter is generally irreproducible making resolution measurements unreliable.
Let’s take a look at two alternatives.
Alternative one: go larger
One option is to go a bit larger than point-like emitters: use a fluorescent bead of known size that is smaller than the resolution of the microscope. These beads are highly standardized and packed with dye molecules that together emit strongly for a good signal-to-noise ratio. The spherical shape of the bead and the high number of emitters also eliminate any orientation effects. Finally, bead size is held within a narrow diameter range and thus, this standard probe type generates highly consistent PSF.
Those are the advantages. An inconvenience, perhaps, is precisely that size. Because a bead has a diameter, its image PSF is a composite (the convolution) of the bead itself and the effective PSF of the microscope (Figure 2). We can measure the FWHM of the image PSF. However, it is the FWHM of the effective PSF that gives us the microscope resolution. That means that we have to figure out the width of the effective PSF from the image PSF by accounting for the size of the bead.
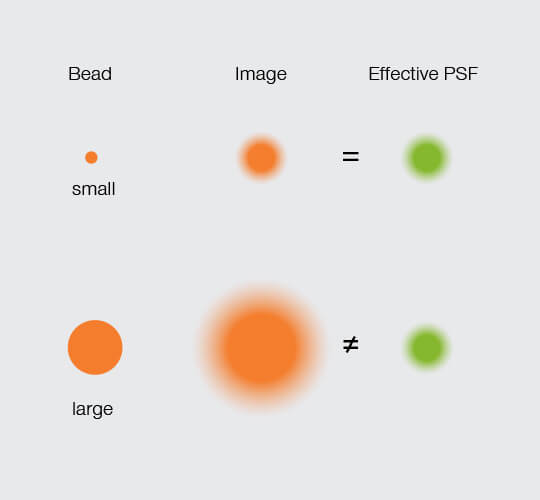
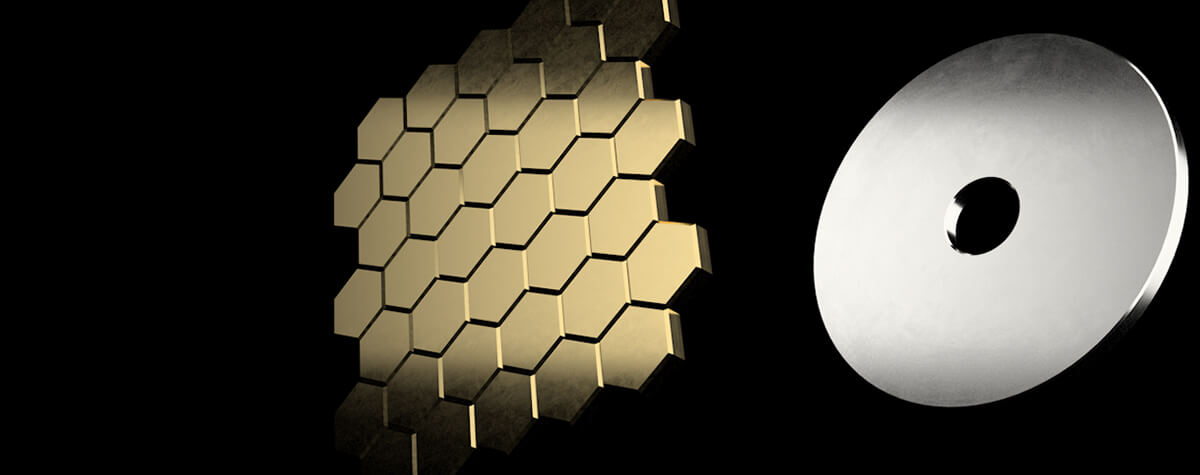
Figure 2.
The effective PSF equals the image PSF with a small bead. It can also be calculated from the image PSF when the dimensions of a larger bead are known.
Luckily, that calculation has been worked out for STED. In cases where the bead is much smaller than the effective PSF, the influence of the bead size is negligeable. That is, the FWHM of the image PSF is the microscope’s resolution. In cases where the bead size is comparable to the effective PSF, however, the contribution of the bead diameter to the image PSF becomes more dominant. But we know the size of the bead! With that information, we can calculate the true resolution.2
2 Harke, B. 2008. 3D STED microscopy with pulsed and continuous wave lasers. PhD thesis. University of Göttingen.
Alternative two: mind the gap
Another option is to hold constant the distance between standard probes. For that, your standard requires structure – something that holds apart two fluorescent probes at a fixed distance. Maintaining that kind of three-dimensional relation between points happens to be a useful feature of DNA origami. Like paper, DNA origami folds into nanostructures and can incorporate discrete binding sites for fluorescent molecules arranged in a programmed geometry. So, you can create rods holding fluorescent probes at a fixed, known distance from one another.
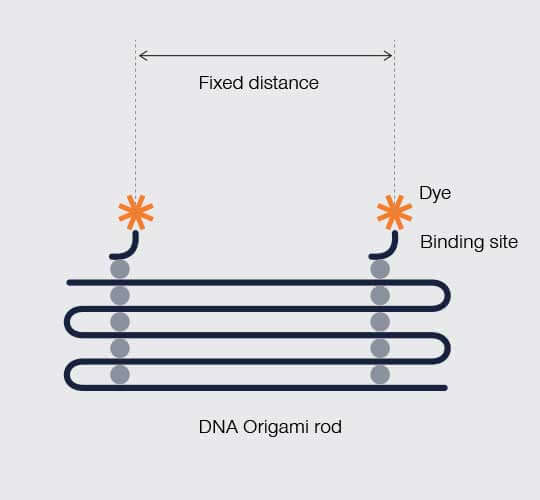
Figure 2.
In DNA origami, DNA folds in a programmed geometry that holds fluorescent labeling sites at a predefined distance from one another.
The fixed distance between each pair of fluorescent probes provides an additional reference point to benchmark the resolution of a microscope. Thus, you know a trait of your specimen that you can look for in the microscope image to assess fidelity. In that sense, this standard probe type is more informative about the performance of a system than PSF size alone. However (and there’s always a drawback), the handling of DNA origami is difficult. Additionally, dim fluorescence leads to a low signal-to-noise ratio and quenching between adjacent probes further distorts measurements.
Molecule versus microscope performance
Using fluorescent beads or DNA origami to measure resolution is not an option for all microscope systems. Their limitations in the three attributes we discussed are especially pivotal for superresolution systems where the behavior of fluorescent molecules is integral to achieving sub-diffraction resolution itself. Put another way, if superresolution emerges from the interplay of microscope and molecule, how do you differentiate microscope from molecule performance when measuring resolution?
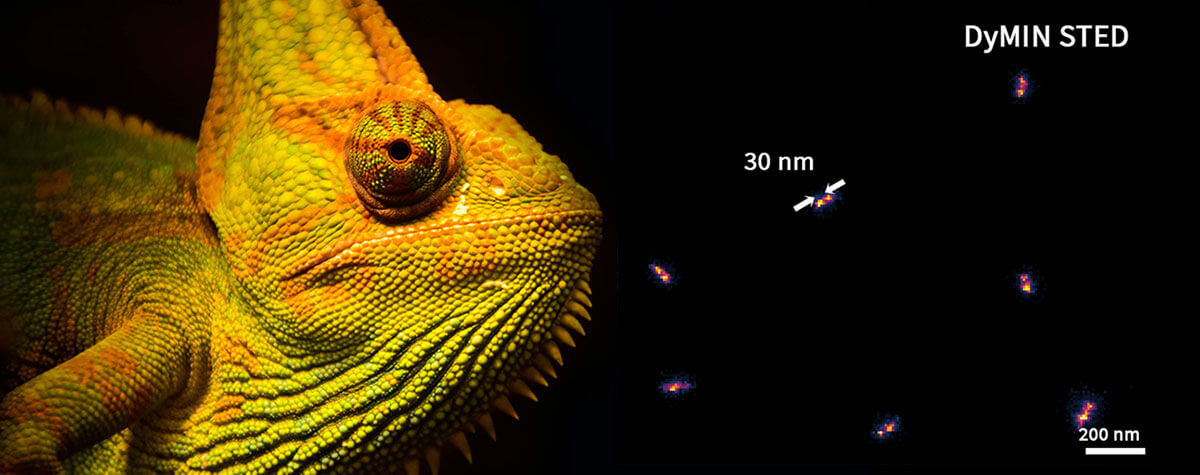
This duality is less problematic for stimulated emissiond depletion (STED) than other superresolution technologies. STED achieves sub-diffraction resolution by restricting the area where a fluorescent molecule can emit photons to a diameter of about 20 nm. That is, the resolution is the restriction, as long as you use a bright probe that is smaller than the resolution.3 But consider single-molecule localization microscopy. There, superresolution comes from calculating the coordinates of fluorescent molecules. The precision of that localization depends on analyzing consistent, reliable PSFs of sparsely distributed fluorescent probes. Sound familiar? Consistent PSF. High photon emission. Distance. Three out of three attributes, which current standard probe types just can’t do. In fact, resolution of SMLM systems is often measured using Fourier ring correlation (FRC), which forgoes measuring FWHM of PSFs altogether.
As superresolution microscopy moves further into the sub-nanometer scales, the interplay microscope-molecule is increasingly central to performance. Breakthroughs will not come solely from creativity in the design of microscopes but also by optimizing the chemistry of dyes. That chemistry is the next frontier in superresolution technologies.
3 Of course, the fluorescent probe must also be amendable to the suppression from the STED laser beam.