

STED-PAINT for
The combination of STED microscopy and PAINT circumvents the physical limitations of current labeling technology.
high-performance
superresolution
STED + PAINT = the perfect couple
Stimulated emission depletion (STED) microscopy delivers resolutions better than 20 nm. Due to significant progress in STED instrumentation and the commercialization of new, photostable dyes, STED is now widely accessible. However, although STED offers unlimited resolution in theory, photobleaching comes into play in practice. Mediating its effects can require tuning down the resolution or recording fewer time steps and smaller 3D-volumes than desired. Besides adaptive illumination, a solution to circumvent the physical limitations of current labeling technology is the adaptation of the PAINT-concept (point accumulation for imaging in nanoscale topography) to STED microscopy. PAINT is based on the application of exchangeable labels that only temporarily bind to their target structures. During acquisition, these labels are constantly replenished from a large pool in the imaging medium, providing stable sample brightness even at the highest resolutions.
The resolution of a STED microscope scales with the intensity of the STED laser. Unfortunately, an increase in resolution is therefore often connected to an increase in photobleaching. The available fluroescence photon budget thus can hinder time lapses as well as volume imaging. This is because with time lapse imaging, the sample area is illuminated multiple times and the number of fluorophores is concomitantly reduced each time. Similarly, when imaging volumes, adjacent z-planes are imaged in succession, so that each plane is subjected to multiple rounds of illumination and therefore photobleached to a certain extent each time. As a result, microscopists often need to sacrifice either resolution, the number of time steps or the number of z-planes recorded in order to reduce photobleaching to an acceptable level.
The situation described above was particularly true for early implementations of STED microscopy, when very strong sample illumination met a small number of photo-stable fluorophores. Today, major developments in STED instrumentation, such as the use of optimized pulsed STED lasers 1, highly efficient detection via APDs, and Adaptive Illumination 2, 3, 4 now allow a strong reduction of sample illumination. Currently, state-of-the-art STED microscopes readily offer resolutions reaching <20 nm and allow the acquisition of live cell movies and image stacks. At the same time, a vast range of optimized, bright, and photostable fluorophores for STED imaging is now commercially available and comes with many conjugation chemistries for diverse applications 5-9.
Nevertheless, the achievable resolution and number of image frames are still ultimately limited by photobleaching, albeit at a much higher level than only a few years ago.
On the other hand, PAINT allows to suppress or bypass the photobleaching process and therefore offers additional resolution and extended time-lapse or volume imaging. With conventional PAINT microscopy, individual, transiently binding dyes are located precisely using single molecule localization microscopy 10, 11. Most importantly, fluorophores are constantly exchanged: bleached fluorophores are replaced with fresh ones from the large reservoir of the imaging medium using labels with transient binding properties. This allows for fast and continuous exchange of fluorophores during image acquisition.
Recently, Spahn et al. 12 have successfully adopted exchangeable fluorophores for use with STED microscopy. In contrast to classical PAINT, which requires very few dyes bound at a single time, staining for STED was optimized to provide high densities of bound dyes while allowing fast replenishment from the imaging medium. Interestingly, this can be implemented with a large range of staining techniques, including simple lipophilic dyes, DNA stains, toxin- and peptide-conjugated dyes as well as with immunostaining with DNA-labeled antibodies.
Application Examples
The following examples and protocols provide a practical introduction and can be taken as a starting point for own studies. For a detailed description of the different approaches see Appendix 1.
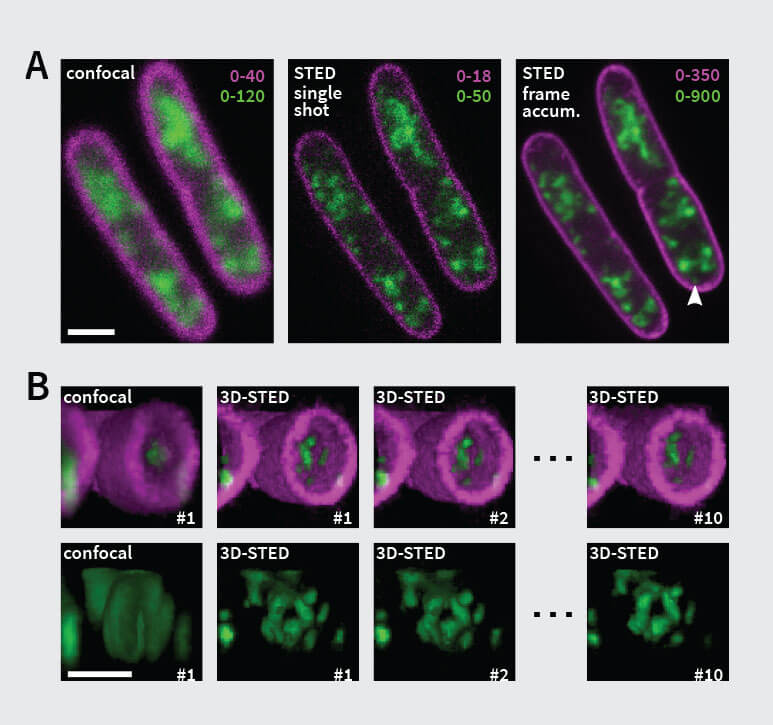
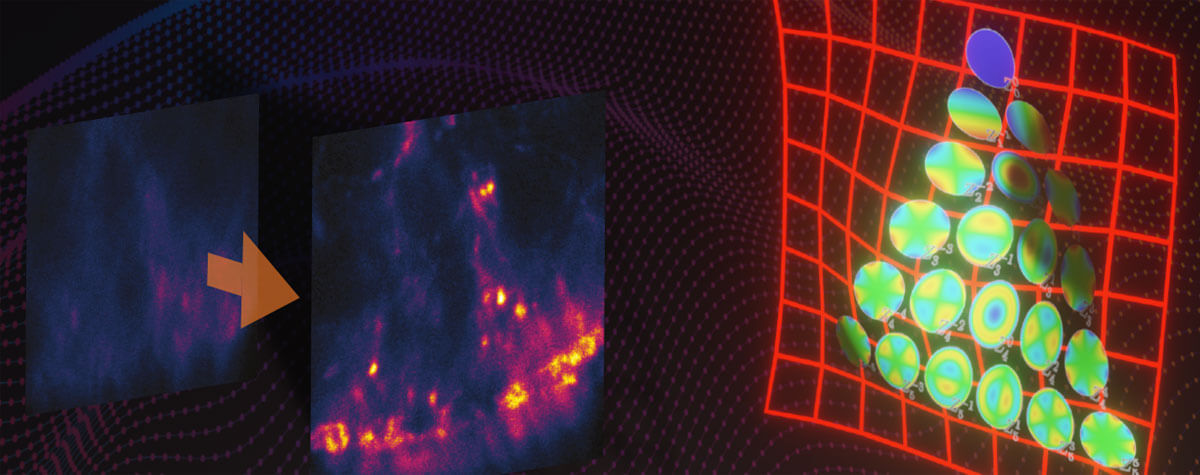
Figure 1. STED-PAINT Imaging of bacterial membranes (magenta) and DNA (green) using a high concentration of the exchangeable labels Nile Red and JF646-Hoechst. (A) Frame accumulation, enabled by dye exchange, yields higher image brightness showing details that are otherwise lost in noise (arrow). (B) Dye replenishment allows repetitive volume imaging with 3D super-resolution. Bottom row shows isolated DNA channel for clarity. Scale bars, 1 µm.
Bacterial membranes and DNA
For the first imaging example (Fig. 1), we recorded bacterial membranes and DNA with STED-PAINT microscopy. For labeling fixed bacterial cells, we chose a combination of two dyes that were previously shown to work well with the STED-PAINT approach: the lipophilic dye Nile Red for staining membranes, and the DNA-binding dye conjugate JF646-HOECHST. Similar results can be obtained using SiR-Hoechst 15, 19. In line with the general approach, the dyes were added to the imaging medium at concentrations around 300 nM.
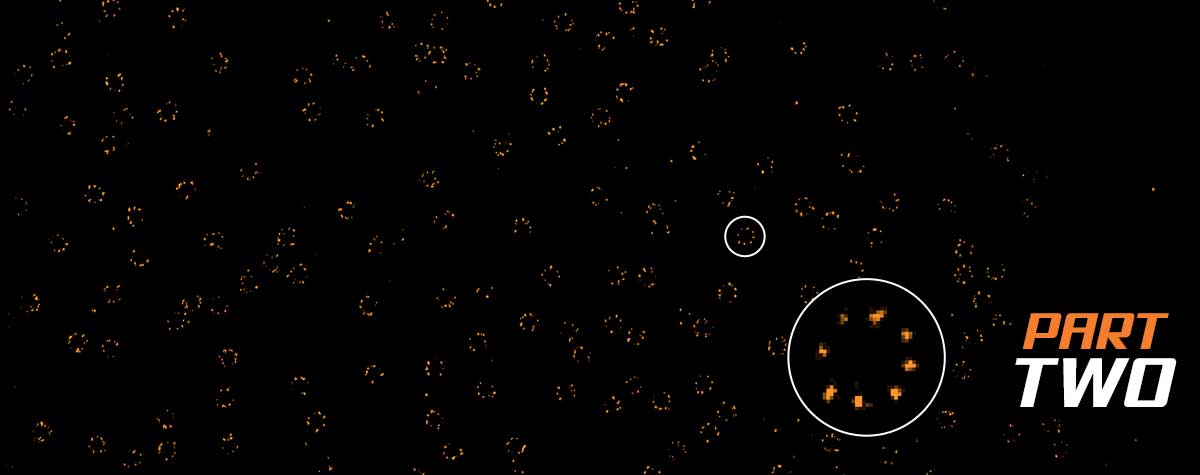
The small size of bacterial cells limits the ability of light microscopy to distinguish subcellular bacterial organelles or macromolecular assemblies, let alone determining the organelle shape or the distribution of proteins within. However, many processes involve specialized structures that require higher resolution for sufficient visualization, as seen for cell division that involves the FtsZ ring. Here, optical super-resolution microscopy not only resolves the ring structure, but also reveals the interplay of key components owing to its multicolour capabilities 20. However, to study such dynamic processes at high resolution over time, one requires an approach such as PAINT.
Sample: E.coli cells, fixed in mid-exponential phase (2 % FA/0.05 % GA) were washed with PBS and immobilized on KOH-cleaned and poly-L-lysine-treated glass coverslips and permeabilized using 0.5 % TritonX-100. Staining and imaging was performed in 300 nM Nile Red and 300 nM JF646-Hoechst in 150 mM Tris pH 8.0 at RT.
Imaging: Nile Red shows fast replenishment, while JF646-Hoechst replenishes more slowly. Due to their small size, bacteria are well-suited for approach 2 using small image frames that can be recorded fast. At high frame acquisition rates, stage drift does not pose a problem. For 2D-STED, 17 or more image frames were accumulated to improve signal (Fig 1 A). For volume imaging with 3D super-resolution, closely spaced z-planes (pixel size: 50 x 50 x 50 nm) were recorded without noticeable bleaching, even after acquisition of ten full volumes.
Example settings 2D-STED: Approach 2, frame size 5.6 x 6.8 µm (XY), pixel size 30 nm (XY), dwell-time 10 µs, Nile Red 15-23 % excitation at 561 nm and 40 % STED at 775 nm (high-power variant), JF646-Hoechst 4-4.5 % excitation at 640 nm and 10 % STED at 775 nm (high-power variant), line accumulations 1x (confocal) / 3x (STED), frame signal accumulation ≥17x.
Example settings 3D-STED: Approach 1, frame 2.4 x 2.4 x 2.5 µm (XYZ), pixel size 50 nm (XYZ), Nile Red as above, JF646-Hoechst 5-6.2 % excitation at 640 nm and 20 % STED at 775 nm (high-power variant), line accumulations 1x (confocal) / 3x (STED).
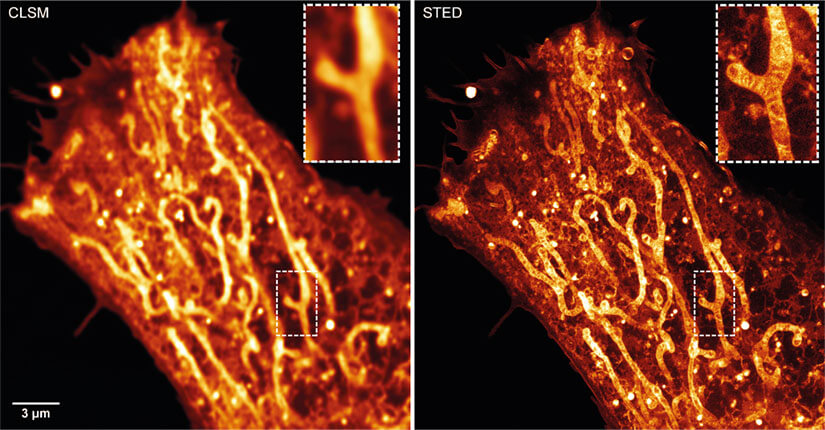
Figure 2. STED-PAINT imaging of a Nile Red labeled HeLa cell provides bright images of mitochondrial membranes and a range of other cellular membranes including endoplasmatic reticulum, plasma membrane, vesicles and lipid droplets. Dye replenishment during acquisition allows bright STED images without bleaching. Raw data shown.
Mitochondrial membranes in fixed and living mammalian cells
Imaging the structure and dynamics of the mitochondrial inner membrane is currently a hot topic in organelle biology. In addition to tagging and labeling of mitochondrial proteins using small tags such as the SNAP tag 13, results have been published using mitochondria specific probes 14.
Moreover, Span et al. 15 described the use of Nile Red for labeling and imaging of a range of cellular membranes as well as lipid droplets. Amongst other results, they show that this dye strongly labels mitochondrial membranes and can reveal the inner structure of cristae (Fig. 2). However, due to the broad specificity of the dye, a counterstain might be required to unambiguously identify structures of interest.
Sample: HeLa cells fixed with 4 % FA / 0.1% GA in PHEM buffer for 60 min (adapted from 25) were labeled and imaged with 300 nM Nile Red in 150 mM Tris pH 8.0 at RT. Note: Fix specimen for ≥ 60 min with a mixture of FA and GA and do not permeabilize cells to preserve membrane structures.
Imaging: Nile Red replenishes quickly and is suited for approach 1 (see p. 6). As Nile Red requires relatively high STED laser powers for sufficient resolution, bleaching is dominant and dye exchange crucial. To collect enough signal despite photobleaching, multiple line accumulations at relatively low scan speeds (e.g. via increased pixel dwell-times) are required. Brightest results were achieved for large image frames (>20 µm), as this slows down each line acquisition and provides more recovery time between line repeats.
Example settings: Approach 1, frame 26.2 x 27.4 µm (XY), pixel size 20 nm (XY), dwell-time 10 µs, 2-10 % excitation at 561 nm, 65 % STED at 775 nm (high-power variant), line accumulations 8x (confocal) / 24x (STED), single frame.
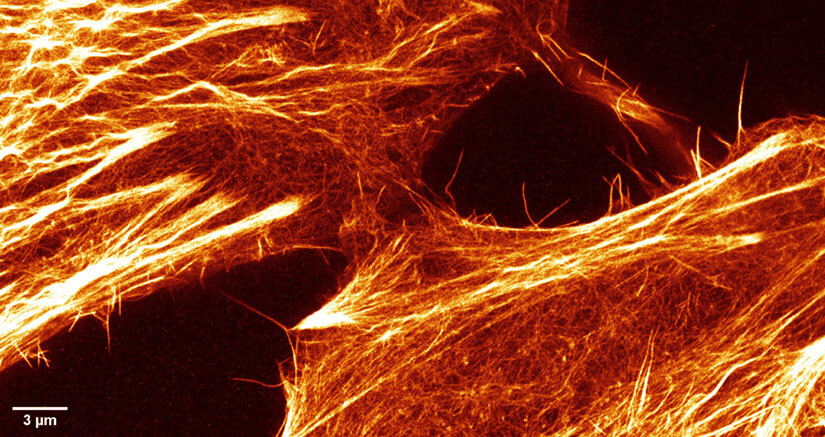
Figure 3. STED-PAINT imaging of Lifeact Alexa Fluor 594 in fixed HeLa cells allows bright, high-resolution STED images of the cytoskeleton fine structure as it binds only transiently and is constantly replenished from the imaging medium. Small section of larger frame showing raw data.
Cytoskeleton in fixed and living mammalian cells
The cytoskeleton of mammalian cells lends itself as a beautiful test and demonstration object for practically all types of light microscopy. Nevertheless, numerous open scientific questions are related to the fine-structure and function of cytoskeleton networks 14, 16, 17.
Labeling the cytoskeleton has been done for decades using immunofluorescence, toxin-based labeling, or methods based on GFP-tagging. Many of these approaches are well suited for analyzing the coarse structure of the network. However, the fine structure is often dim and hard to resolve well. Often, this can be attributed to low labeling densities of fine filaments and/or rapid photobleaching.
Here, PAINT labeling was applied in fixed mammalian cells using the Lifeact peptide 18 coupled to Alexa Fluor 594. As shown in Fig. 3, the exchange of labels in the medium allows the extended accumulation of signal and reveals much more details among the fine structures of the cytoskeleton network than classical immuno- or phalloidin-labeled samples.
Sample: HeLa cells were fixed using microtubule-stabilizing buffer as described previously 12 to preserve cytoskeletal structures. Staining and imaging at RT with 1-2 µM Lifeact-Alexa Fluor 594 in 100 mM Tris pH 8.0 and oxygen scavenging via 2.5 mM PCA and 10 nM PCD 21. Note: Oxygen scavenging helps protect cytoskeletal structures during image acquisition.
Imaging: Approach 1 was employed as Lifeact Alexa Fluor 594 exchanges rapidly. Recording with a high number of line accumulations improved signal for fine structures.
Example settings: Approach 1, frame 73.6 x 74.6 µm (XY), pixel size 20 nm (XY), dwell-time 10 µs, 20-50 % excitation at 561 nm, 25 % STED at 775 nm (high-power variant), line accumulations 8x (confocal) / 24x (STED), single frame.
Example settings: Approach 1, frame 73.6 x 74.6 µm (XY), pixel size 20 nm (XY), dwell-time 10 µs, 20-50 % excitation at 561 nm, 25 % STED at 775 nm (high-power variant), line accumulations 8x (confocal) / 24x (STED), single frame.
STED-DNA-PAINT
The applications presented above demonstrate the performance of the STED-PAINT combination. All are based on toxin or lipid labeling. Nevertheless, most scientific questions are centered around the function(s) of specific proteins or protein complexes, necessitating labeling approaches specific to a defined target protein. In most cases, toxin-based stains are unavailable or lack the required specificity.
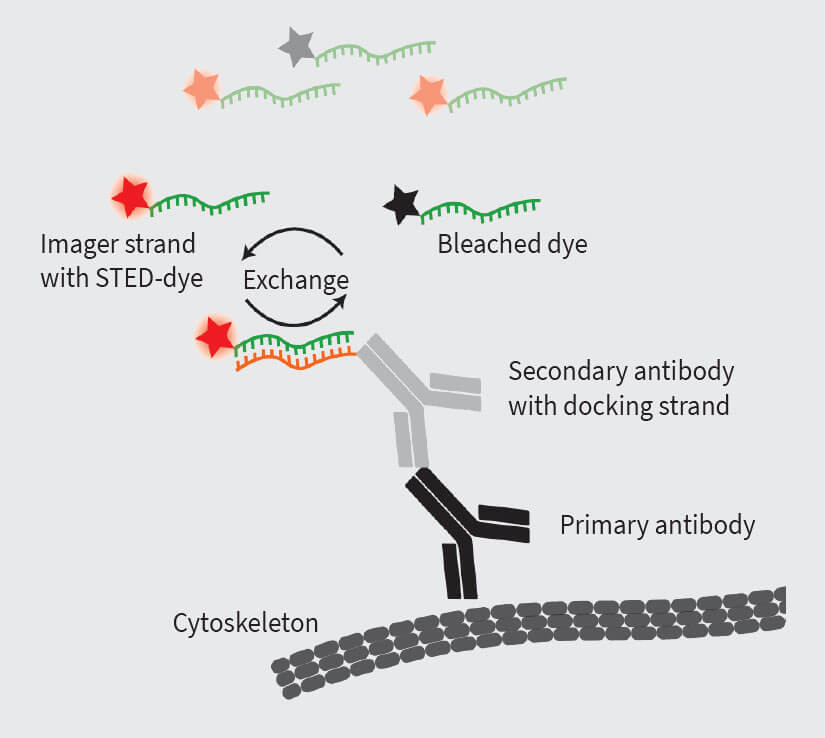
Figure 4. The DNA-PAINT principle allows to combine immunolabeling of target proteins with the PAINT approach. For this, three components are required: the primary antibody, binding to the target structure, the secondary antibody, binding to the primary antibody. The secondary antibody is coupled to the ssDNA docking strand and an ssDNA imager strand labeled with dye is exchanged between the bound and unbound state.
One highly specific labeling approach is DNA-PAINT, based on classic immunostaining 10, 12. Here, a target protein is immunolabeled with target-specific primary antibodies and secondary antibodies which are conjugated to DNA strands (docking strands). For imaging, dye-coupled complementary DNA strands (imager strands) are added, which can temporarily bind to the antibody-coupled DNA strand via base pairing. This allows generalization of the PAINT concept to more protein-specific labeling. Importantly, the binding kinetics of docking and imager strands can be fine-tuned by changing the DNA sequence, buffer composition or temperature. This provides multiple levers to optimize DNA-PAINT for bright STED images and faster image acquisition 12.
To demonstrate the performance of this approach, we combined simple PAINT labeling via Lifeact-Alexa Fluor 594 with DNA-PAINT labeling via tubulin-specific primary antibodies, DNA-conjugated secondary antibodies and DNA imager strands conjugated to abberior STAR 635P.
In summary, the results of the STED-DNA-PAINT approach stand for its own (Fig. 5). This points towards a general applicability of PAINT for numerous fixed cell imaging experiments, where the localization of one or more target proteins is the question of interest. However, as the DNA-PAINT concept is not directly compatible to live cell imaging, more dynamic questions in field of bioimaging cannot be addressed with this technology.
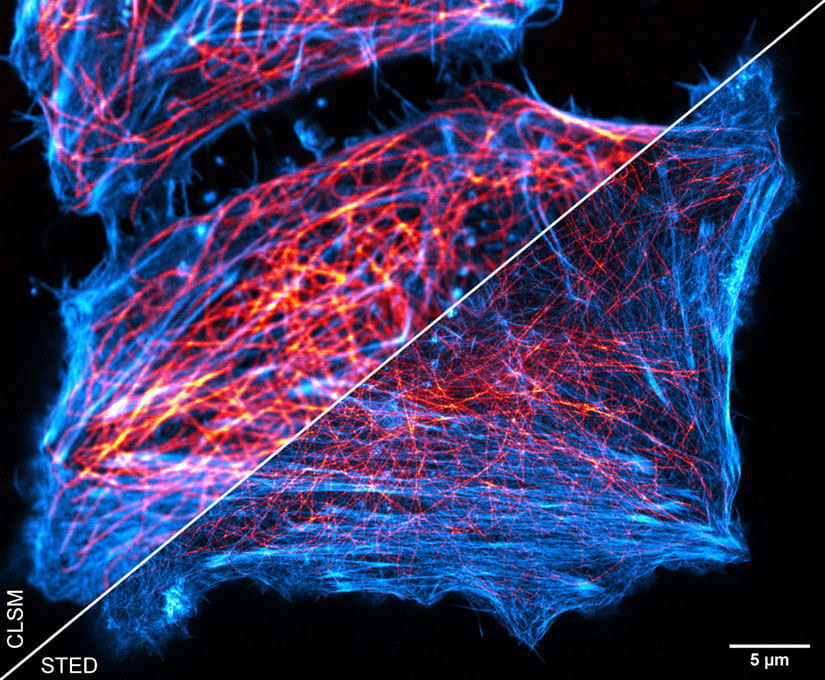
Figure 5. Combination of STED-PAINT and STED-DNA-PAINT. In addtition to actin labeling as in figure 3, Tubulin was labeled in fixed HeLa cells using DNA-PAINT with DNA-conjugated antibodies and transient binding of complemetary DNA imager strands conjugated to abberior STAR 635P. Both stains are replenished from the buffer rendering bright STED images.
Sample: HeLa cells were fixed using microtubule-stabilizing buffer as described previously 12 to preserve cytoskeletal structures. Immunostaining used mouse anti-β-tubulin primary antibodies (#32-2600, Thermo Fisher, USA) and custom, DNA-conjugated secondary antibodies 12. Final staining and imaging at RT with 1-2 µM Lifeact-Alexa Fluor 594 and 500 nM STAR 635P-conjugated imager strand in PBS (without Ca2+ and Mg2+) with 500 mM NaCl pH 8.2 and oxygen scavenging via 2.5 mM PCA and 10 nM PCD 21. Note: Oxygen scavenging helps protect cytoskeletal structures during image acquisition.
Imaging: Approach 1 was employed as Lifeact Alexa Fluor 594 exchanges rapidly and the DNA-PAINT imager strand at medium speed. A high number of line accumulations was used to increase signal for fine actin structures. Note that line accumulations are lower for STAR635P, owing to its higher brightness but slower replenishment (requiring more breaks).
Example settings: Approach 1, frame 51.2 x 42.2 µm (XY), pixel size 20 nm (XY), dwell-time 10 µs, Lifeact-Alexa Fluor 594: 20-50 % excitation at 561 nm, 25 % STED at 775 nm (high-power variant), line accumulations 2x (confocal) / 12x (STED), DNA-PAINT STAR 635P: 10-20 % excitation at 640 nm and 18 % STED at 775 nm (high-power variant), line accumulations 2x (confocal) / 6x (STED), single frame.
Multicolor DNA-PAINT & STED
Recently, multicolour DNA-PAINT has been published and used to create biological insight 22,10,12,23. Here, multiple biological targets are stained with specific primary antibodies, each conjugated to a distinct DNA docking strand. Each target is imaged after a separate staining step using an DNA imager strand complementary to only one of the docking strands. All imager strands are conjugated to the same dye, allowing the same settings for each target. Importantly, in between two imaging rounds rigorous washings steps are required to ensure only the intended imager strand is present in the sample. Alternatively, imager strands with different sequences (and thus target-specificity) can be added simultaneously and spectrally distinguished by the excitation wavelength and detection window while using the same depletion laser wavelength (e.g. Alexa Fluor 594 and abberior STAR 635P). Several of those combinations have been already tested for STED-DNA-PAINT applications 12.
Additionally, with DNA-conjugated primary antibodies, the number of parallel stains is not limited by the repertoire of antibodies from different species, further expanding the multiplexing capability of DNA-PAINT and STED-DNA-PAINT.
Although the general applicability of this approach in combination with STED microscopy needs to be confirmed, the results of these initial experiments are extremely promising and point towards a very interesting future perspective. Recent advances in the field of DNA-PAINT, such as SpeedPAINT 24, may further improve imaging speed and signal-to-noise ratio, rendering PAINT-STED an even more and useful tool.
Appendix 1: The STED-PAINT process
PAINT is based on special labeling conditions under which dye molecules are constantly exchanged. This means that bleached dyes are constantly replaced with fresh ones, allowing repeated scanning of the image area and accumulating signal until a bright image has been formed.
The kinetics of dye exchange determine the exact imaging mode and speed, because bleached dyes need to be replaced before the next accumulation step is started. This results in two different imaging approaches for fast and slow dye exchange rates. It is important to note that a larger image area reduces the overall acquisition speed, which in turn provides more time for the dyes to be replenished between repeated scans. Essentially, a larger image area has a similar effect as faster dye exchange rates.
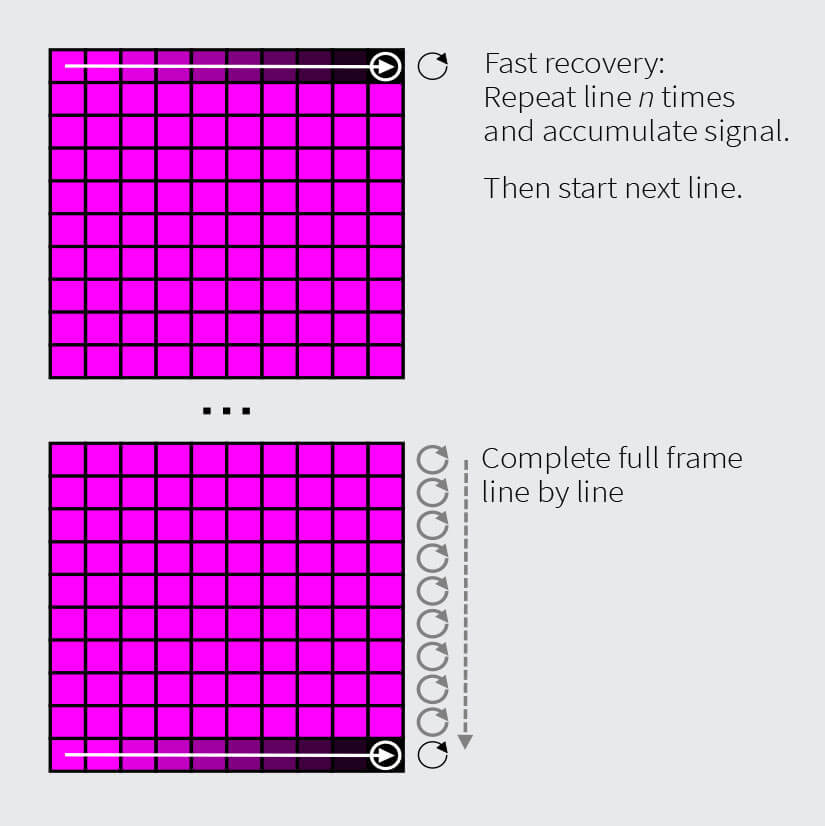
Approach 1: Fast Dye Exchange Rate
For dyes with a fast exchange rate, nearly full recovery of the stain will occur while a single line is scanned during the acquisition of a STED image. This provides a constant, high signal in each line scan and allows for multiple line accumulations before moving to the next line. Note that for larger images, each line scan takes longer, resulting in improved stain recovery. The brightness of the final image is generally high and depends mostly on the number of line accumulations. This approach is suited for time lapse acquisition in live cells with stable intensity over extended periods of time. The achievable scan speed depends on the staining brightness, the dye exchange rate, and image size.
Pros and cons
+ Best suited for large images with high resolution
+ Compatible with live cell imaging
+ Robust against stage drift
– Slow total imaging speed requires autofocus
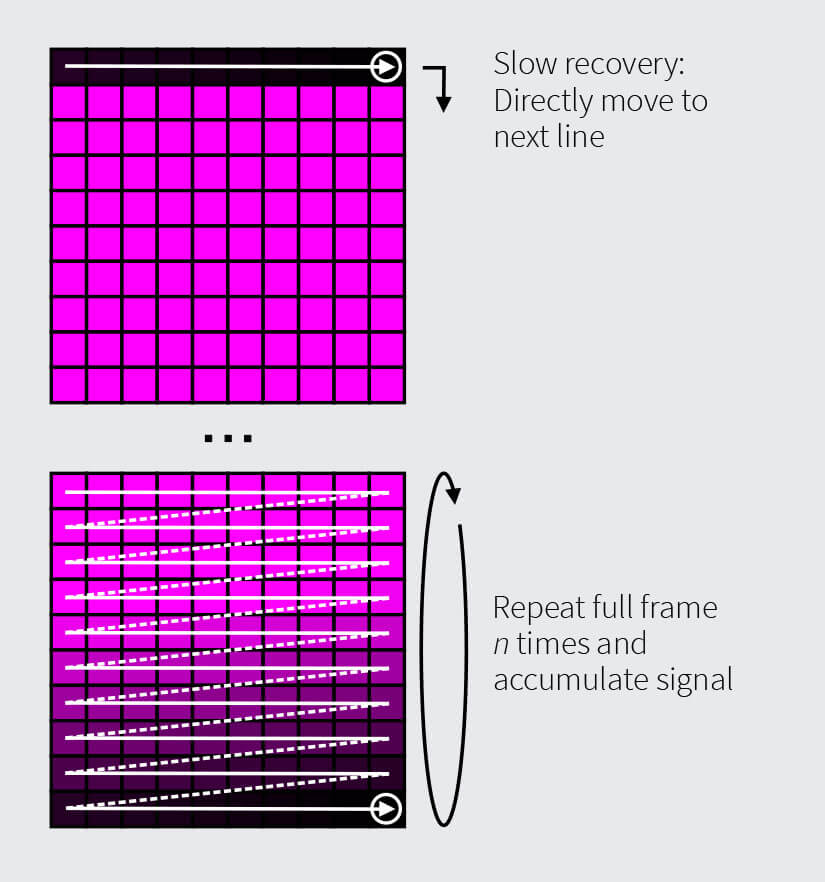
Approach 2: Slow Dye Exchange Rate
Stains with slow exchange rates are more suitable to repeated acquisition of full image frames without line repeats. As full frame acquisitions take longer than individual line scans, more time is available for a complete replenishment of the dye before the next frame starts. Usually, after several scan cycles equilibrium is reached and bleaching and recovery balance out. Then, the signal in each frame is accumulated, for the bright final image. A drawback is potential motion-blurring due to the longer signal accumulation time compared to a quick succession of line accumulations with Approach 1. This effect becomes less noticeable in smaller images due to faster frame acquisition.
Pros and cons
+ Best suited fixed cells with low staining intensity
+ Small organisms like Bacteria
+ Motion blur: Less suited for live cell imaging and sensitive to stage drift
– Slow total imaging speed requires focus lock
| Structure | Label | Fast/ slow exchange |
|---|---|---|
| DNA | HOECHST & HOECHST conjugates | Medium |
| Tubulin | Taxol conjugates | Slow |
| Actin | Lifeact | Fast |
| Membranes: Plasma membrane, Mitochondria, ER, Vesicles and Lipid Droplets | Nile Red | Fast |
| Large range of targets via immunostaining or toxins | DNA-PAINT: DNA conjugated to antibodies or toxins | Tunable |
Table 1. Exemplary Labels for STED-PAINT
Appendix 2: Labels for STED-PAINT
A crucial requirement for the STED-PAINT approach is the exchangeability of dye molecules. While traditional immunolabeling is not directly compatible with PAINT, other common stains readily exhibit transient binding and unbinding, allowing dye exchange between a bound fraction and the surrounding buffer. This includes fluorescent dyes conjugated to toxins or drugs that readily stain structures such as DNA, tubulin, actin, lipophilic dyes for membrane staining and others (Tab. 1). Depending on the cell-permeability and toxicity of the label, both live and fixed cell imaging is possible with the presented approach.
In addition, it is beneficial to use fluorogenic dyes, i.e. dyes which remain non-fluorescent in solution and turns fluorescent only when bound to the target. This reduces the background signal originating from the imaging buffer. However, many non-fluorogenic stains with high target affinity can also provide good signal-over-background.
Popular examples for dyes compatible with live-cell STED microscopy are the commercially available silicon rhodamine (SiR) or abberior LIVE dyes.
Stains exhibit large differences in binding behaviour with different on- and off-rates. In addition, in live-cell applications, the appropriate stain concentration may be limited, reducing replenishment from the imaging buffer pool. As an example, SiR-tubulin stains show rather slow replenishment at concentrations compatible with overnight imaging (often around 0.1 – 1 µM, lower if spindle apparatus is observed), allowing repeated acquisition of STED imaging with stable intensities every 2-5 minutes. As rule of thumb, labels with KD values in the lower µM-range (~ 1 – 10 µM) and off-rates of 1 – 100 s-1 should be well suited for STED-PAINT applications. Therefore, a large number of stains are potentially compatible with STED-PAINT and many more applications can be expected in the near future.
Acknowledgements
We thank Prof. Dr. Mike Heilemann and Dr. Christoph Spahn for very fruitfull cooperation and support with STED-PAINT samples and imaging.
1 Göttfert, F., Wurm, C.A., Mueller, V., Berning, S., Cordes, V.C., Honigmann, A., Hell, S.W., 2013. Coaligned dual-channel STED nanoscopy and molecular diffusion analysis at 20 nm resolution. Biophys. J. 105, L01-03. https://doi.org/10.1016/j.bpj.2013.05.029
2 Göttfert, F., Pleiner, T., Heine, J., Westphal, V., Görlich, D., Sahl, S.J., Hell, S.W., 2017. Strong signal increase in STED fluorescence microscopy by imaging regions of subdiffraction extent. Proc. Natl. Acad. Sci. U. S. A. 114, 2125–2130. https://doi.org/10.1073/pnas.1621495114
3 Heine, J., Reuss, M., Harke, B., D’Este, E., Sahl, S.J., Hell, S.W., 2017. Adaptive-illumination STED nanoscopy. Proc. Natl. Acad. Sci. U. S. A. 114, 9797–9802. https://doi.org/10.1073/pnas.1708304114
4 Staudt, T., Engler, A., Rittweger, E., Harke, B., Engelhardt, J., Hell, S.W., 2011. Far-field optical nanoscopy with reduced number of state transition cycles. Opt. Express 19, 5644–5657. https://doi.org/10.1364/OE.19.005644
5 Butkevich, A.N., Belov, V.N., Kolmakov, K., Sokolov, V.V., Shojaei, H., Sidenstein, S.C., Kamin, D., Matthias, J., Vlijm, R., Engelhardt, J., Hell, S.W., 2017. Hydroxylated Fluorescent Dyes for Live-Cell Labeling: Synthesis, Spectra and Super-Resolution STED. Chem. Weinh. Bergstr. Ger. 23, 12114–12119. https://doi.org/10.1002/chem.201701216
6 Butkevich, A.N., Mitronova, G.Y., Sidenstein, S.C., Klocke, J.L., Kamin, D., Meineke, D.N.H., D’Este, E., Kraemer, P.-T., Danzl, J.G., Belov, V.N., Hell, S.W., 2016. Fluorescent Rhodamines and Fluorogenic Carbopyronines for Super-Resolution STED Microscopy in Living Cells. Angew. Chem. Int. Ed Engl. 55, 3290–3294. https://doi.org/10.1002/anie.201511018
7 Kolmakov, K., Wurm, C.A., Meineke, D.N.H., Göttfert, F., Boyarskiy, V.P., Belov, V.N., Hell, S.W., 2014. Polar red-emitting rhodamine dyes with reactive groups: synthesis, photophysical properties, and two-color STED nanoscopy applications. Chem. Weinh. Bergstr. Ger. 20, 146–157. https://doi.org/10.1002/chem.201303433
8 Sidenstein, S.C., D’Este, E., Böhm, M.J., Danzl, J.G., Belov, V.N., Hell, S.W., 2016. Multicolour Multilevel STED nanoscopy of Actin/Spectrin Organization at Synapses. Sci. Rep. 6, 26725. https://doi.org/10.1038/srep26725
9 Wurm, C.A., Kolmakov, K., Göttfert, F., Ta, H., Bossi, M., Schill, H., Berning, S., Jakobs, S., Donnert, G., Belov, V.N., Hell, S.W., 2012. Novel red fluorophores with superior performance in STED microscopy. Opt. Nanoscopy 1, 7. https://doi.org/10.1186/2192-2853-1-7
10 Schnitzbauer, J., Strauss, M.T., Schlichthaerle, T., Schueder, F., Jungmann, R., 2017. Super-resolution microscopy with DNA-PAINT. Nat. Protoc. 12, 1198–1228. https://doi.org/10.1038/nprot.2017.024
11 Sharonov, A., Hochstrasser, R.M., 2006. Wide-field subdiffraction imaging by accumulated binding of diffusing probes. Proc. Natl. Acad. Sci. 103, 18911–18916. https://doi.org/10.1073/pnas.0609643104
12 Spahn, C., Hurter, F., Glaesmann, M., Karathanasis, C., Lampe, M., Heilemann, M., 2019b. Protein‐Specific, Multicolor and 3D STED Imaging in Cells with DNA‐Labeled Antibodies. Angew. Chem. 131, 19011–19014. https://doi.org/10.1002/ange.201910115
13 Kondadi, A.K., Anand, R., Hänsch, S., Urbach, J., Zobel, T., Wolf, D.M., Segawa, M., Liesa, M., Shirihai, O.S., Weidtkamp-Peters, S., Reichert, A.S., 2020. Cristae undergo continuous cycles of membrane remodelling in a MICOS-dependent manner. EMBO Rep. 21, e49776. https://doi.org/10.15252/embr.201949776
14 Almeida, A.C., Drpic, D., Okada, N., Bravo, J., Madureira, M., Maiato, H., 2020. Functional Dissection of Mitosis Using Immortalized Fibroblasts from the Indian Muntjac, a Placental Mammal with Only Three Chromosomes. Methods Mol. Biol. Clifton NJ 2101, 247–266. https://doi.org/10.1007/978-1-0716-0219-5_16
15 Spahn, C., Grimm, J.B., Lavis, L.D., Lampe, M., Heilemann, M., 2019a. Whole-Cell, 3D, and Multicolor STED Imaging with Exchangeable Fluorophores. Nano Lett. 19, 500–505. https://doi.org/10.1021/acs.nanolett.8b04385
16 Andrade, D.M., Clausen, M.P., Keller, J., Mueller, V., Wu, C., Bear, J.E., Hell, S.W., Lagerholm, B.C., Eggeling, C., 2015. Cortical actin networks induce spatio-temporal confinement of phospholipids in the plasma membrane – a minimally invasive investigation by STED-FCS. Sci. Rep. 5, 11454. https://doi.org/10.1038/srep11454
17 D’Este, E., Kamin, D., Göttfert, F., El-Hady, A., Hell, S.W., 2015. STED Nanoscopy Reveals the Ubiquity of Subcortical Cytoskeleton Periodicity in Living Neurons. Cell Rep. 10, 1246–1251. https://doi.org/10.1016/j.celrep.2015.02.007
18 Riedl, J., Crevenna, A.H., Kessenbrock, K., Yu, J.H., Neukirchen, D., Bista, M., Bradke, F., Jenne, D., Holak, T.A., Werb, Z., Sixt, M., Wedlich-Soldner, R., 2008. Lifeact: a versatile marker to visualize F-actin. Nat. Methods 5, 605–607. https://doi.org/10.1038/nmeth.1220
19 Lukinavičius, G., Blaukopf, C., Pershagen, E., Schena, A., Reymond, L., Derivery, E., Gonzalez-Gaitan, M., D’Este, E., Hell, S.W., Wolfram Gerlich, D., Johnsson, K., 2015. SiR-Hoechst is a far-red DNA stain for live-cell nanoscopy. Nat. Commun. 6, 8497. https://doi.org/10.1038/ncomms9497
20 Söderström, B., Chan, H., Shilling, P.J., Skoglund, U., Daley, D.O., 2018. Spatial separation of FtsZ and FtsN during cell division. Mol. Microbiol. 107, 387–401. https://doi.org/10.1111/mmi.13888
21 Aitken, C.E., Marshall, R.A., Puglisi, J.D., 2008. An oxygen scavenging system for improvement of dye stability in single-molecule fluorescence experiments. Biophys. J. 94, 1826–1835. https://doi.org/10.1529/biophysj.107.117689
22 Jungmann, R., Avendaño, M.S., Woehrstein, J.B., Dai, M., Shih, W.M., Yin, P., 2014. Multiplexed 3D cellular super-resolution imaging with DNA-PAINT and Exchange-PAINT. Nat. Methods 11, 313–318. https://doi.org/10.1038/nmeth.2835
23 Werbin, J.L., Avendaño, M.S., Becker, V., Jungmann, R., Yin, P., Danuser, G., Sorger, P.K., 2017. Multiplexed Exchange-PAINT imaging reveals ligand-dependent EGFR and Met interactions in the plasma membrane. Sci. Rep. 7, 12150. https://doi.org/10.1038/s41598-017-12257-y
24 Schueder, F., Stein, J., Stehr, F., Auer, A., Sperl, B., Strauss, M.T., Schwille, P., Jungmann, R., 2019. An order of magnitude faster DNA-PAINT imaging by optimized sequence design and buffer conditions. Nat. Methods 16, 1101–1104. https://doi.org/10.1038/s41592-019-0584-7
25 Legant, W.R., Shao, L., Grimm, J.B., Brown, T.A., Milkie, D.E., Avants, B.B., Lavis, L.D., Betzig, E., 2016. High-density three-dimensional localization microscopy across large volumes. Nat. Methods 13, 359–365. https://doi.org/10.1038/nmeth.3797