

FLEXPOSURE
Every technique that allows to observe cells is more or less invasive and fluorescence microscopy is no exception. Many imaging situations profit from a reduction in light dose as provided by FLEXPOSURE adaptive illumination.
adaptive illumination
Since its beginnings over 20 years ago, STED microscopy has developed into a powerful method for observing the interior of cells. It provides superresolution at a level that once was the domain of electron microscopy, and it combines this with the many advantages of conventional fluorescence microscopy, among them optical sectioning, protein specificity and live-cell compatibility. Furthermore, in the last few years, fluorescent markers have become much more photostable, pulsed lasers have brought down light dosages dramatically, and the operation of STED instruments has been greatly simplified. These and the fact that raw STED images are free of artefacts, have turned STED into a versatile superresolution method that is compatible with the imaging of living specimens in addition to fixed preparations.
Nevertheless, there is always the need to reduce the amount of incident light on the sample while simultaneously maintaining resolution and signal at high levels. Like in any other fluorescence microscopy technique, the image quality is ultimately governed by the photostability of the fluorescent marker. If dye molecules did not bleach or get transferred to long-lived dark states, signal-to-noise ratios would be much higher, and resolution would only be limited by the size of the molecules. In practice, however, an image is always a trade-off between spatial resolution, temporal resolution, and signal.
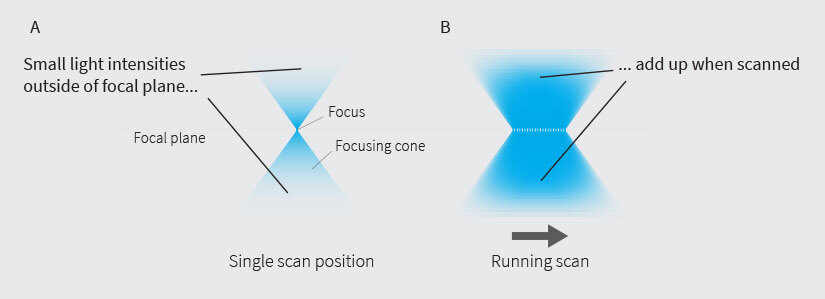
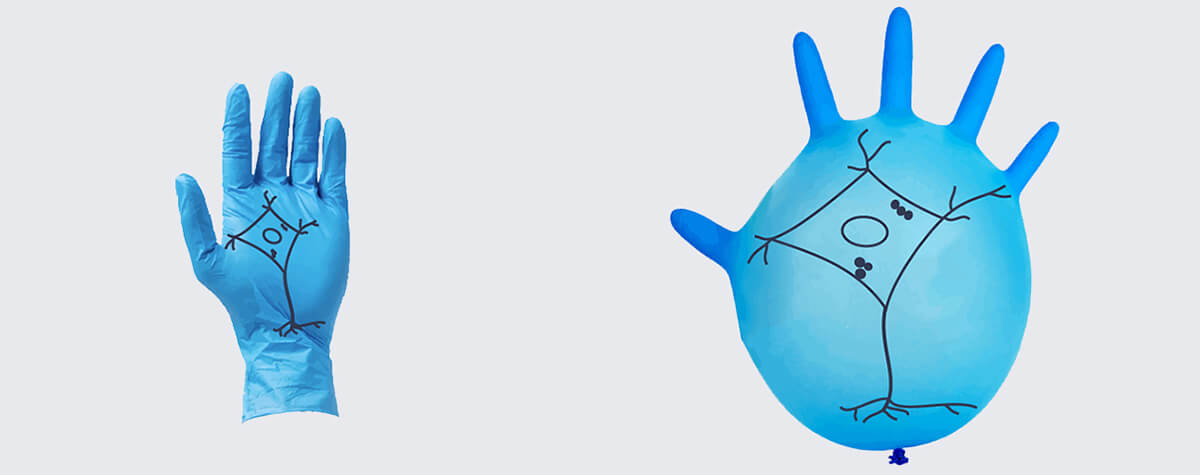
Fig.1 Small out-of-focus intensities add up during the scan
A major breakthrough in this respect was made by the introduction of RESCUE, DYMIN, and MINFIELD, a triad that vastly enlarged the triangle spanned between spatial resolution, temporal resolution, and signal level. The principle underlying these three methods is the same and they are often summarized under the term “adaptive illumination”. Instead of constantly scanning at full power, the sample is only illuminated in places where light can make a positive contribution to the image. In other words, the illumination is adapted to the underlying structure of the sample. A typical sample is sparse. Consequently, the corresponding image consists mostly of background (out-of-focus light, autofluorescence) or simply dark areas. It makes sense not to illuminate these regions and save the sample from most of the light dose that would otherwise be applied. Furthermore, skipping dark areas is also beneficial for areas that do contain signal, for two main reasons. First, the excitation beam is a double cone (Fig. 1). Away from the focal plane, it becomes less intense, but also broader, so that the total intensity is conserved. As the excitation beam is scanned over the sample, the actual focus hits each spot only once, but the cones constantly overlap and their intensities – although small – sum up to the same intensity as in the focus (the effect is the same as in a photograph where out-of-focus background is blurred, but not dark). Hence, avoiding unnecessarily illuminating in-focus regions spares out-of-focus regions from a lot of light that would otherwise cause photobleaching and photodamage. This has the greatest effect when recording threedimensional stacks, and it applies to confocal as well as STED imaging.
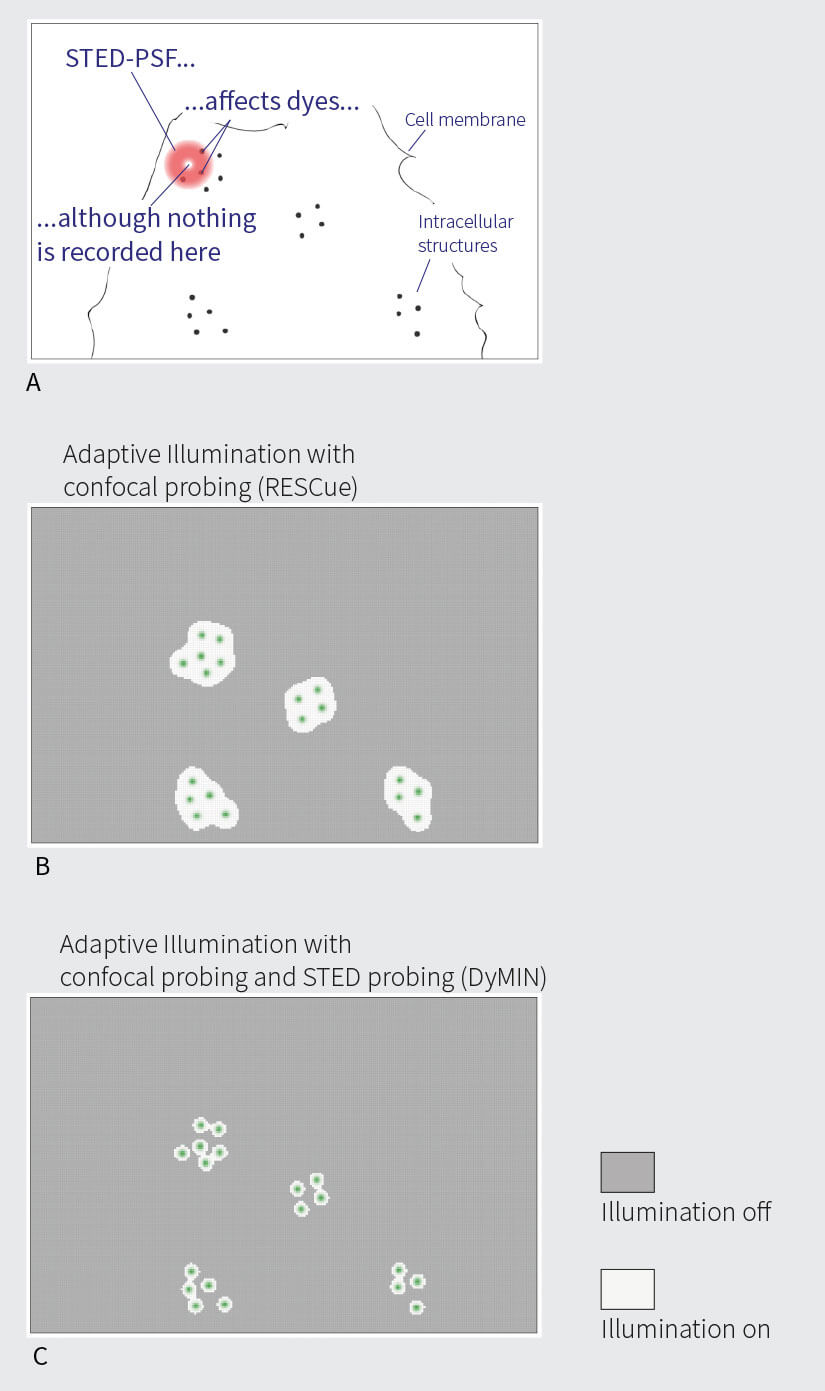
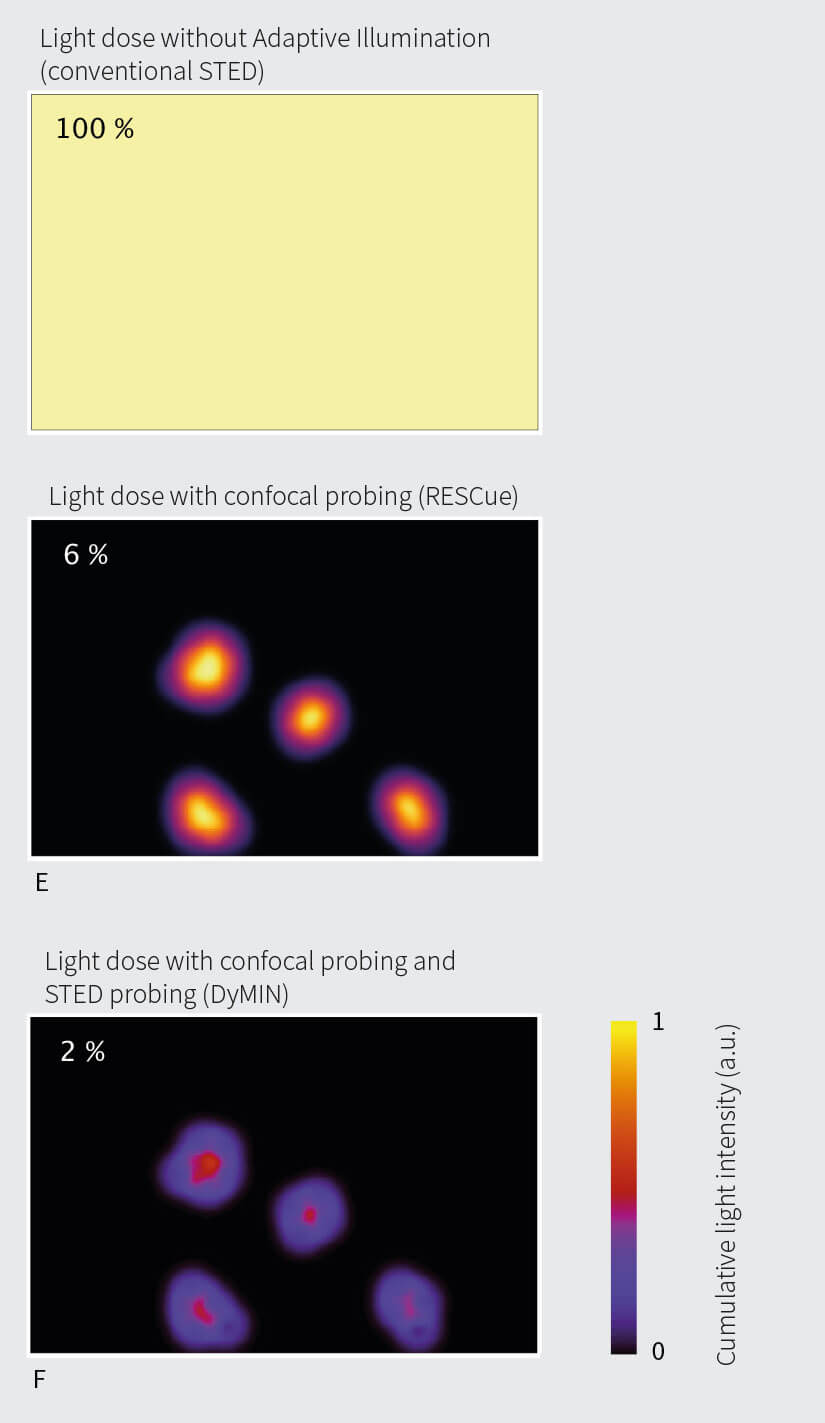
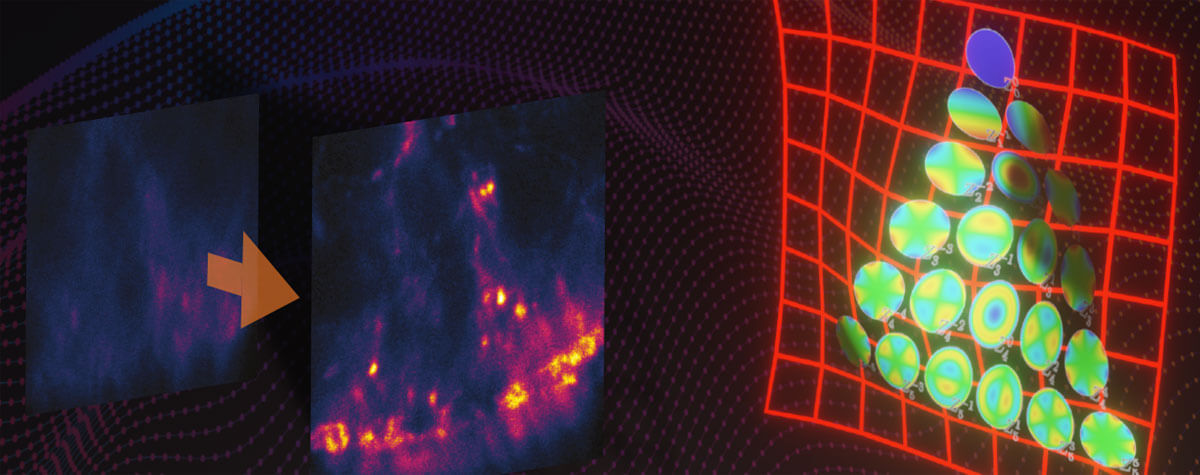
Fig 2. Light dosages (simulated) when imaging interior structures of a hypothetical cell (A). Areas of full illumination (light grey) and probing illumination only (dark grey) for RESCUE (B) and DYMIN (C). D: Light dose when scanning with constant full STED power, normalized to 100%. E: For this example, light dosages are reduced by 94% and 98%, respectively, when imaging with RESCUE (E) and DYMIN (F)
The second reason not to illuminate dark areas is that the focus of a laser beam is not an infinitely small point, but a volume known as the point spread function (PSF). With STED microscopy, the difference between resolution and PSF-size can be quite big: while STED microscopes reach sub-30 nm resolutions even without adaptive illumination, the STED PSF itself is still diffraction-limited and has a diameter about ten times this size. Hence, the illuminated area can be a hundred times larger than the region from which fluorescence is actually collected. This means that many times during a scan, while an empty region is recorded, the excitation and, in particular, the STED PSF reach into adjacent regions that do in fact contain fluorescent markers (Fig. 2 A). These markers are subjected to high intensities, but unnecessarily so, because no useful photons can be collected from the empty region.
For these reasons, it is advisable to skip the illumination of empty regions in the sample, but the question remains how to determine where these regions are, without illuminating them in the first place.
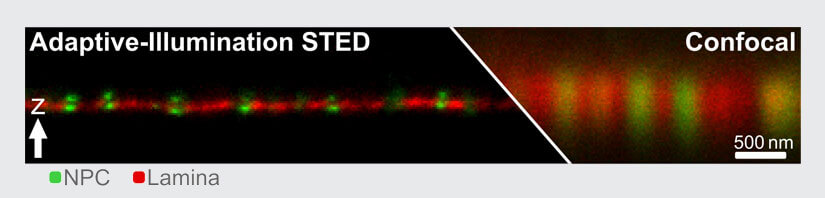
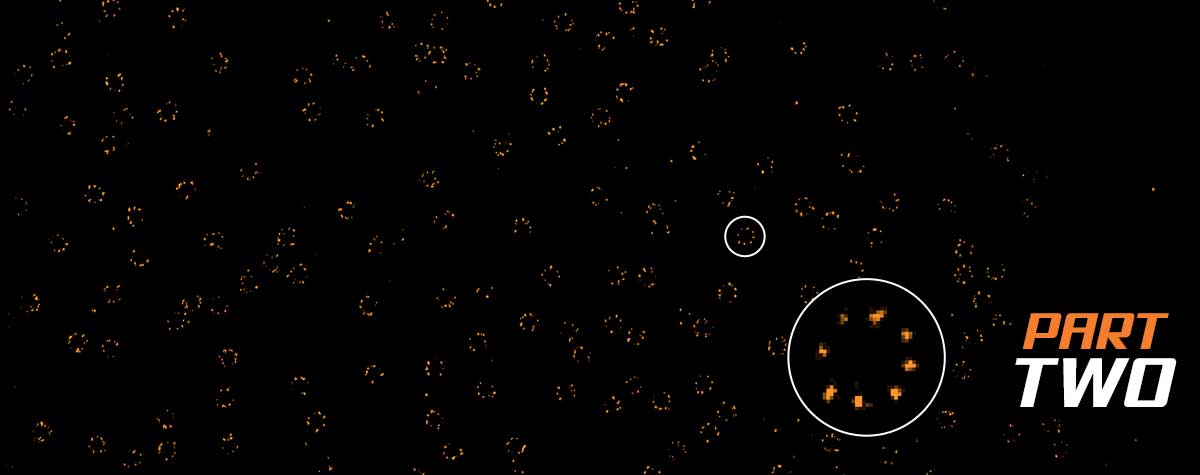
Fig.3 Resolution increase with FLEXPOSURE adaptive illumination. Two proteins (Nuclear pore complex (NPC) in green and lamina in red) around the nuclear membrane were immunolabelled using Abberior STAR Orange and STAR RED. Shown is raw data. Resolution for the NPCs is isotropic and around 60nm, the highest resolution figure reported for 3D-STED with conventional fluorophores, with the exception of MINFIELD 3D-STED.
Confocal probing to the RESCUE
One option is to take a quick, low-signal, low-damage confocal image, thresholding it and using this as a mask during the final scan to determine when to blank the excitation and STED lasers. However, a potential challenge to this approach is that the sample may drift and/or a living specimen may move in between the probe step and final scan.
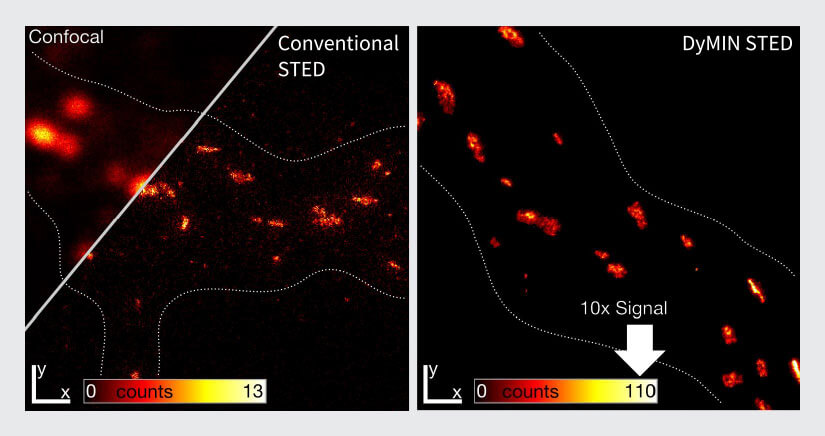
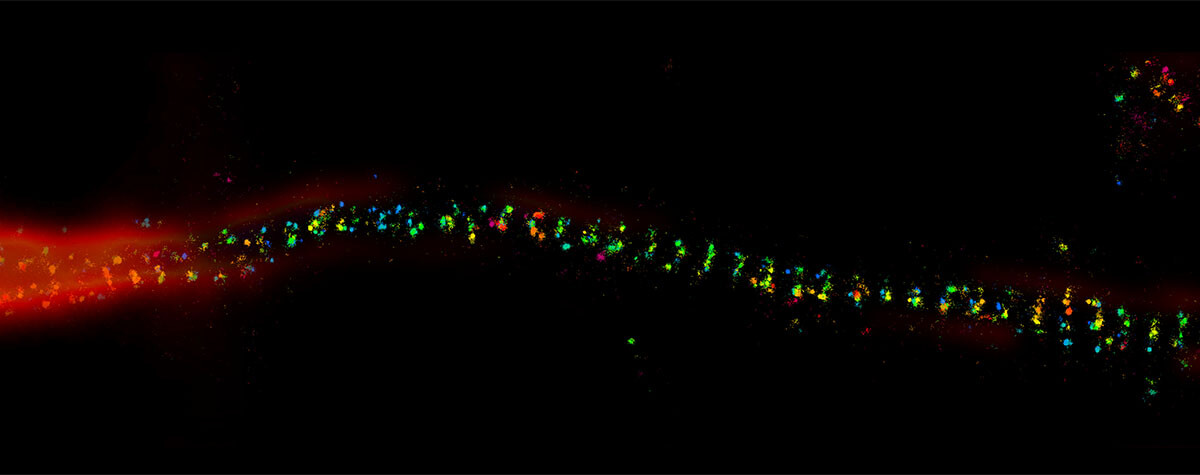
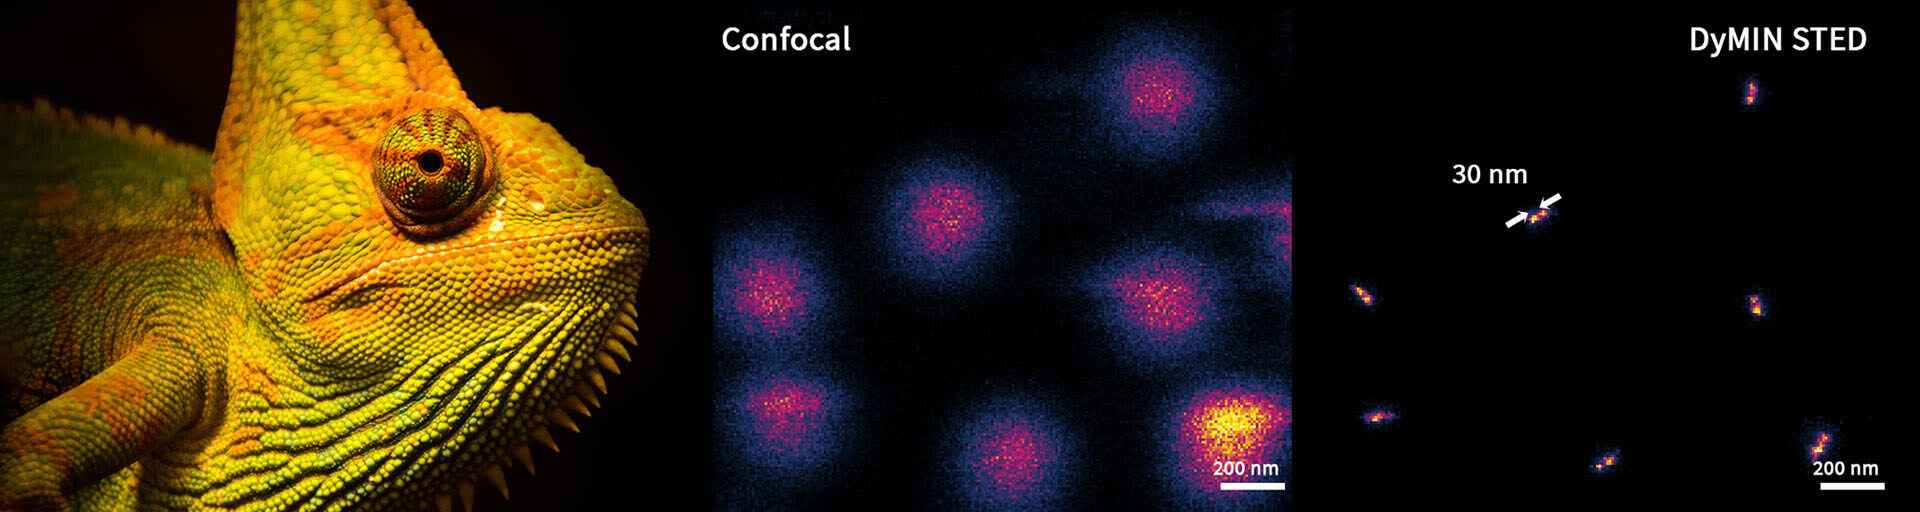
Fig.4 Signal increase with FLEXPOSURE adaptive Illumination.
Left: Confocal and conventional STED imaging on gephyrin clustering at inhibitory synapses of rat hippocampal neurons.
Right: the same sample recorded with DYMIN STED. All other parameters equal, the signal is increased by a factor of ten, reducing noise and making substructures clearly visible that cannot be discerned with conventional STED.
A better approach is to probe the sample point by point while it is recorded point by point (Fig. 2). This entails moving to the next scan position, switching on the excitation beam, waiting for a short amount of time, and checking whether a certain number of fluorescent photons have arrived. If positive, it can be assumed that fluorescent markers are present at this particular scan position and one can continue to excite and collect photons until the desired signal level has been reached. (Of course, STED can be switched on, too.) If no or only a few photons are registered during the first probing step, this region is likely empty, and all beams are switched off for the remainder of the pixel dwell time. If the sample is, say, 80% sparse, this automatically and immediately translates into 80% less light applied to the sample and its fluorescent molecules that are currently out of focus. For a volume recording, this can be the decisive difference between a good image and no image at all. Additionally, infocus markers profit, too, due to reason two above.
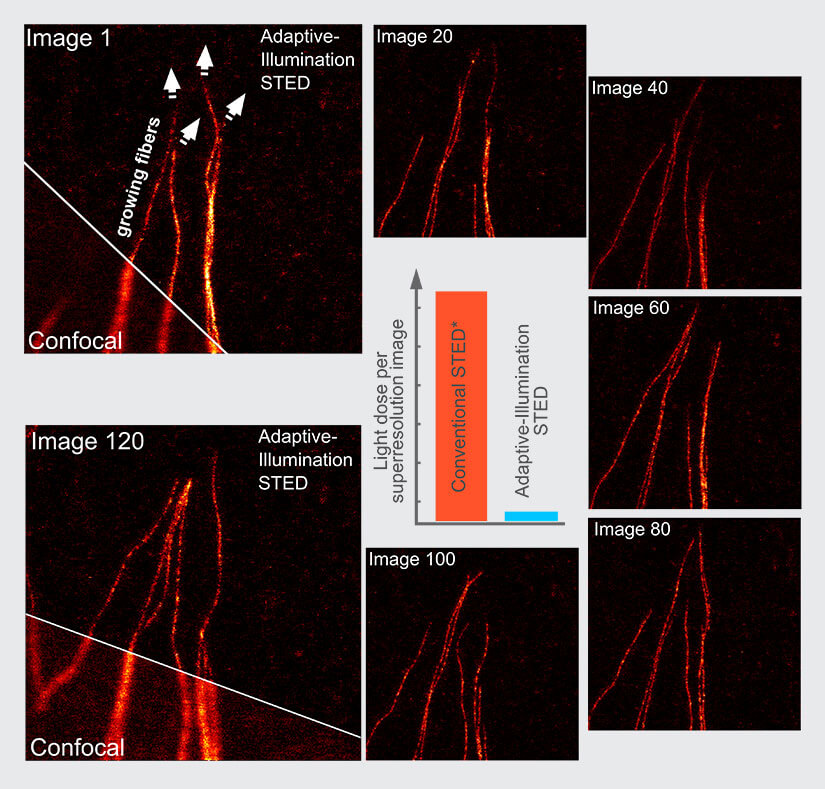
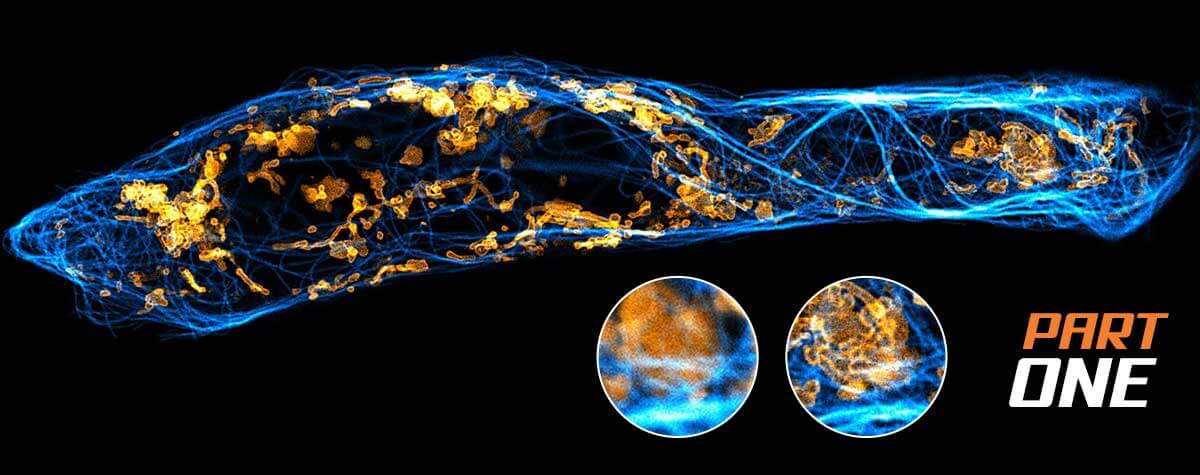
Fig.5 Increased number of frames for life-cell imaging with FLEXPOSURE adaptive illumination. The much lower light dose and photobleaching facilitates time laps imaging of living cells. Here, 120 images of the same sample area are recorded at 50 nm resolution without significant bleaching or sample stress. Note the growing tubulin fibers. Inlet shows the light dose reduction, *compared to CW-STED. Cell: Fibros, label: SiR, same look-up table for all images.
This scheme – confocal probing, followed by a decision whether to continue imaging or not – is known as RESCUE 1. It requires fast light control on sub-μs timescales, usually provided by an acoustooptic device, and an intelligent decision-making scheme that robustly separates background from wanted signal. Notably, once the decision has come out positive, imaging is carried out exactly the same as before, making RESCUE a fully quantitative method.
Always look on the bright side of the fluorophore
As discussed, the STED PSF is usually a few hundred nanometers in size. When the scan is approaching a region containing fluorescent markers, the STED PSF starts to overlap with it long before fluorescence, which can only come from the center of the donut, is actually detected. RESCUE helps to mediate this, but the confocal probing step itself is limited by diffraction. Hence, when the scan comes within ~100 nm of a fluorescent molecule, the confocal probing decision turns positive and illumination is set to full, although the following STED-step does not yield fluorescence for another 70-80 nm towards the molecule. Shortly after RESCUE had been published, it became clear that it can be improved if, after the initial confocal probing step, STED is used in order to probe further, now with subdiffraction resolution (Fig. 2). This is the idea behind DyMIN (Dynamic intensity minimum) 2. In fact, DyMIN uses multi-STED-probing at different STED intensities – each time the scan comes a little closer to the molecule, the STED intensity used in the probing step is slightly ramped up, giving more information without applying more power than absolutely necessary. With this, the boundary between empty regions and regions containing fluorescent markers can be finely defined. More importantly, since the relationship between resolution and STED power follows a square root law, at low STED powers a slight increase already gives huge returns in resolution. Thus, probing with very low-power STED light can significantly improve the probing decision. This, and the fact that too many STED probing steps increase scan duration and cumulative STED power, means that in practice, one confocal probing step followed by 2-3 STED probing steps is most advantageous.
With DYMIN, the light dosages impinging on fluorescent markers and the specimen can be lowered by a factor of 10 to 100 in practically relevant samples (Fig. 2). This means that either up to hundred times more images can be recorded from the same region (Fig. 5), signal can be increased many times (Fig. 4), or resolution can be improved by a factor of about two to three (Fig. 3). With this, the triangle between speed, resolution, and signal inside which the operator can choose imaging parameters becomes considerably larger and leads to images not accessible with conventional STED 5.
It should be noted that DYMIN, unlike RESCUE, imposes different STED light intensities on the structures, depending on the shape of other structures in its vicinity. This is because with RESCUE, the probing decision is binary and once a structure has been hit, it is imaged with full illumination. In contrast, with DYMIN, a different number of probing steps is possible for each scan step until the decision becomes positive. Nevertheless, the gains that can be achieved with DYMIN are so high and in many cases, an image where photobleaching varies over the sample is better than getting no image at all.
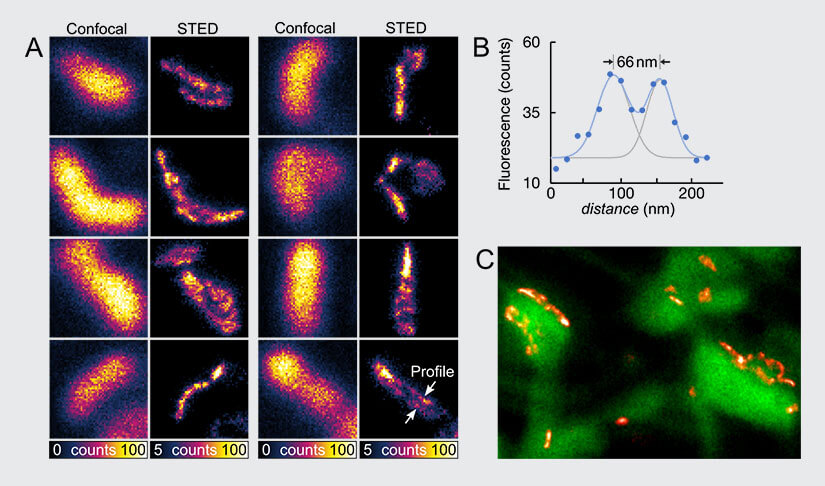
Fig.6 The neuroprotein PSD95 imaged with FLEXPOSURE adaptive illumination. (A) Fixed and immunolabeled PSD95 cluster. Size of one image is 800nm x 800nm. (B) Line profile showing the resolution of the profile highlighted in (A). (C) Living mouse brain slice image of PSD95 clusters (red) imaged with FLEXPOSURE adaptive illumination STED and a confocal counterstaining of neuros (green).
Figure 6 shows the neuronal protein PSD95, imaged with FLEXPOSURE adaptive illumination STED and different sample preparations. In (A), a fixed and immunostained brain slice was imaged with high signal and resolution. In (C), a living brain slice was imaged with FLEXPOSURE adaptive illumination STED (red) and a confocal counterstaining of neurons (green), providing insight on the orientation of the PSD95 with respect to spines and the substructure in vitro.
Minimal intensity for maximal resolution
Further reductions in light dose can be achieved with a slightly different scheme, called MINFIELD 6. Here, the idea is to confine the scan to a small region only, to avoid exposing the fluorophores of interest to the high-intensity crest of the STED donut. This means that the field-of-view must be smaller than the central zero-to-low intensity region of the STED donut, but this area is only exposed to low intensities and can be recorded with extremely high resolution because photobleaching is largely avoided. With MINFIELD, bleaching reduction of up to 100-fold has been demonstrated and at around 15 nm, the highest STED resolutions have been shown with conventional fluorophores. MINFIELD is used to gain maximal resolution and signal from structures with sizes on the order of a few hundred nanometers and below, such as viruses, vesicles, nuclear pore complexes 6.
Summary
With FLEXPOSURE adaptive Illumination, light is applied to the sample only where necessary. To this end, structural information is accessed point-by-point using confocal- and low-intensity-STED probing in order to decide where it’s worth to record with full illumination. This way, the light exposure on the sample is reduced dramatically, facilitating live-cell experiments, highresolution imaging, and superior signal.
Which out of the three FLEXPOSURE adaptive illumination methods is best for a given sample depends on a range of factors. Clearly, MINFIELD is the tool of choice for very high-resolution, high-signal STED images of structures with sizes of a few hundred nanometers. If structures get bigger, RESCUE or DYMIN can be applied. Generally, since RESCue uses only a single probing step, it conserves imaging speed and is best used for fast recordings and/or live-cell experiments. The resolution achieved with DYMIN is superior, however, a DYMIN image takes a little longer due to the additional probing steps and therefore lends itself more to fixed samples. Nevertheless, DYMIN has been applied to living brain slices, too (Fig. 6C).
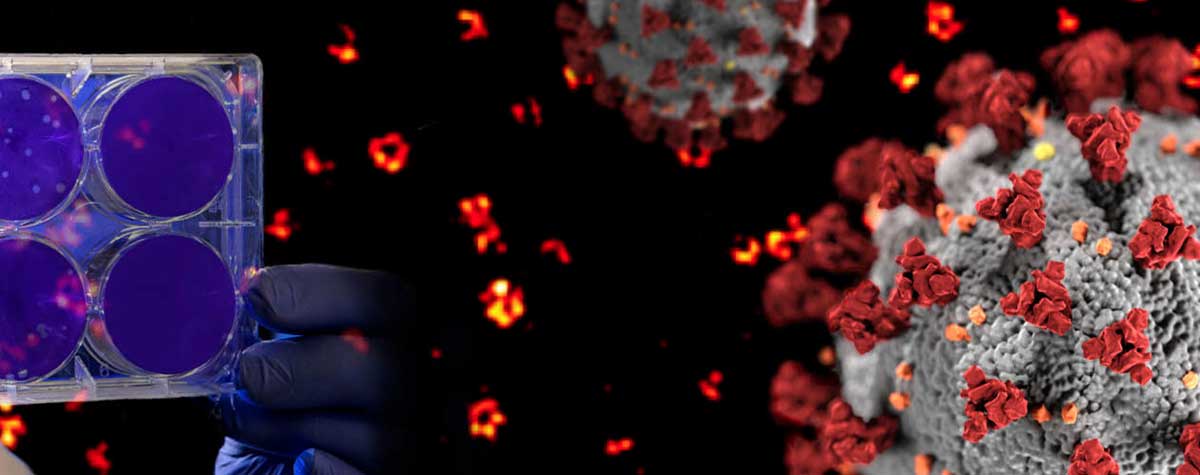
Note that the concept of adaptive illumination can be generalized. It does not have to be a confocal probing step followed by STED. Schlötel et al 7 have used RESCUE with great effect to image malaria parasites, which accumulate iron deposits during a life cycle stage taking place in erythrocytes. These hemozoin particles are highly reflective, making them very difficult to study by confocal and in particular STED microscopy. However, using a low-intensity confocal probing step to localize and subsequently avoid hemozoin during the scan enables multicolour imaging of blood-stage malaria parasites with resolutions down to 35 nm.
References
1 T. Staudt, et al. “Far-field optical nanoscopy with reduced number of state transition cycles.” Optics express 19.6 (2011): 5644-5657.
2 J. Heine, M. Reuss, B. Harke, E. D’Este, S. J. Sahl, S. W. Hell. „Adaptive-illumination STED nanoscopy“, Proc. Natl. Acad. Sci., S. 201708304, Aug. 2017, doi: 10.1073/pnas.1708304114.
3 G. Pacchioni. „Super-resolution microscopy: Always look on the bright side of the fluorophore“, Nat. Rev. Mater., Bd. 2, Nr. 10, S. 17065, Okt. 2017, doi: 10.1038/natrevmats.2017.65.
4 Jörn Heine et al. „Three dimensional live-cell STED microscopy at increased depth using a water immersion objective“, Rev. Sci. Instrum., Bd. 89, 2018.
5 Davide Gambarotto, et al. „Imaging cellular ultrastructures using expansion microscopy (U-ExM)“, Nat. Methods, Bd. 16, S. 71–74, 2019.
6 Fabian Göttfert, et al. “Strong signal increase in STED fluorescence microscopy by imaging regions of subdiffraction extent.” Proceedings of the National Academy of Sciences 114.9 (2017): 2125-2130.
7 Jan-Gero Schloetel , et al. “Guided STED nanoscopy enables super-resolution imaging of blood stage malaria parasites.” Scientific reports 9.1 (2019): 1-10.