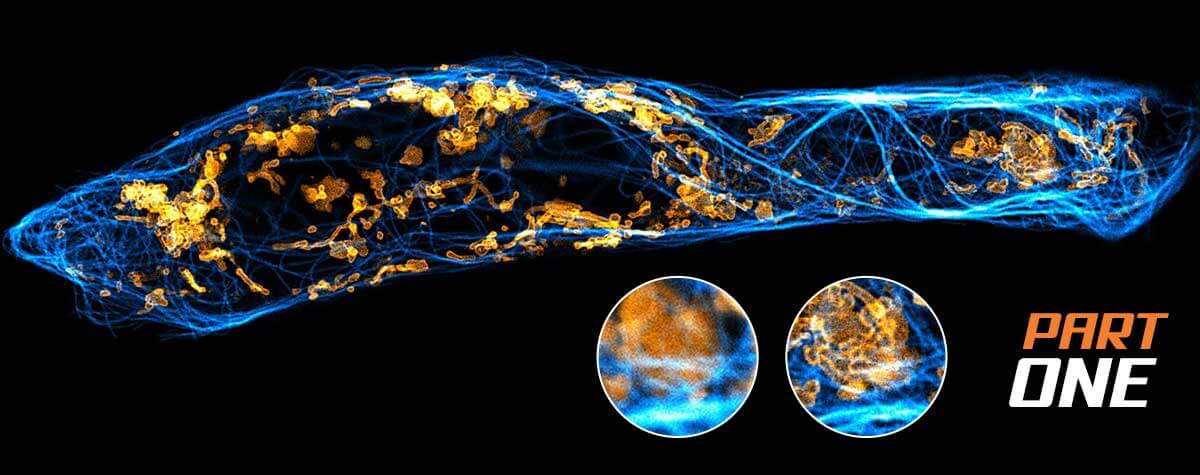
MINFLUX –
MINFLUX reaches unprecedented spatio-temporal resolution in light microscopy and provides 2D and 3D localization precisions in the single-digit nanometer range.
unrivaled spatio-temporal resolution
Imaging protein complexes at the molecular scale has been on the wish list of researchers in the life sciences for decades. With the advent of MINFLUX nanoscopy 2, this demand can now be met.
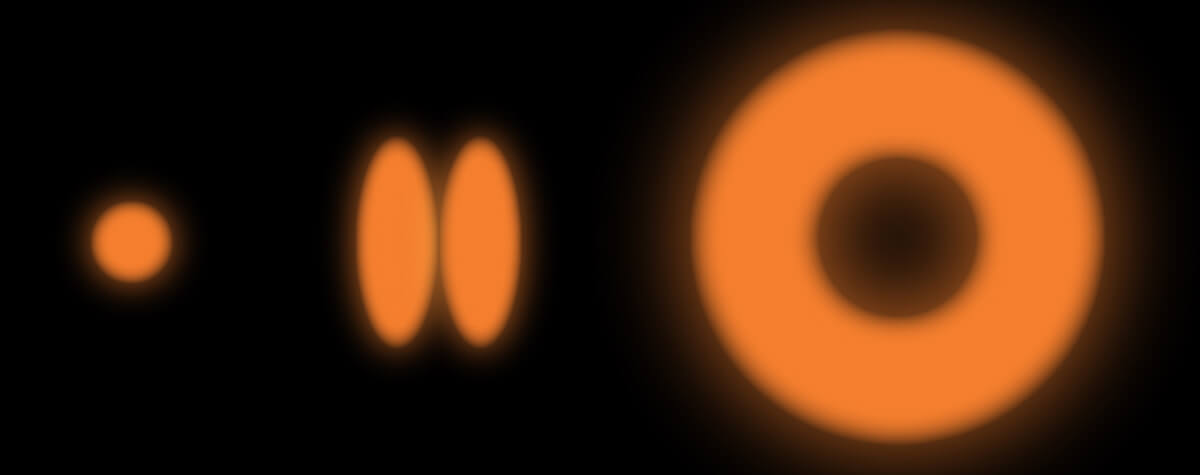
MINFLUX can resolve individually switchable fluorophores at distances as small as 1 – 2 nm. This is achieved by localizing single fluorophores with an excitation pattern featuring a spatially well-controlled intensity zero, e.g. a donut or “bottle-beam”. The intensity zero of this excitation beam is then used to probe the fluorophore at pre-defined positions close to its actual position. The fluorophore position can be determined with a minimal number of photons and consequently within a spatio-temporal regime that exceeds alternative techniques by far 2 – 7.
Importantly, a MINFLUX microscope can be based on a common fluorescence microscope stand 1, and it combines high localization precisions with standard workflows. This allows for unprecedented user-friendliness for the everyday user. In 2D MINFLUX mode, the microscope can attain localization precisions < 2 nm. In 3D MINFLUX imaging mode, isotropic localization precisions < 3 nm (Fig. 1) have been shown routinely. Together with the option for multi-color imaging in the nanometer range, MINFLUX offers scientists an ideal tool for addressing numerous biomedical and biophysical questions on the molecular scale.
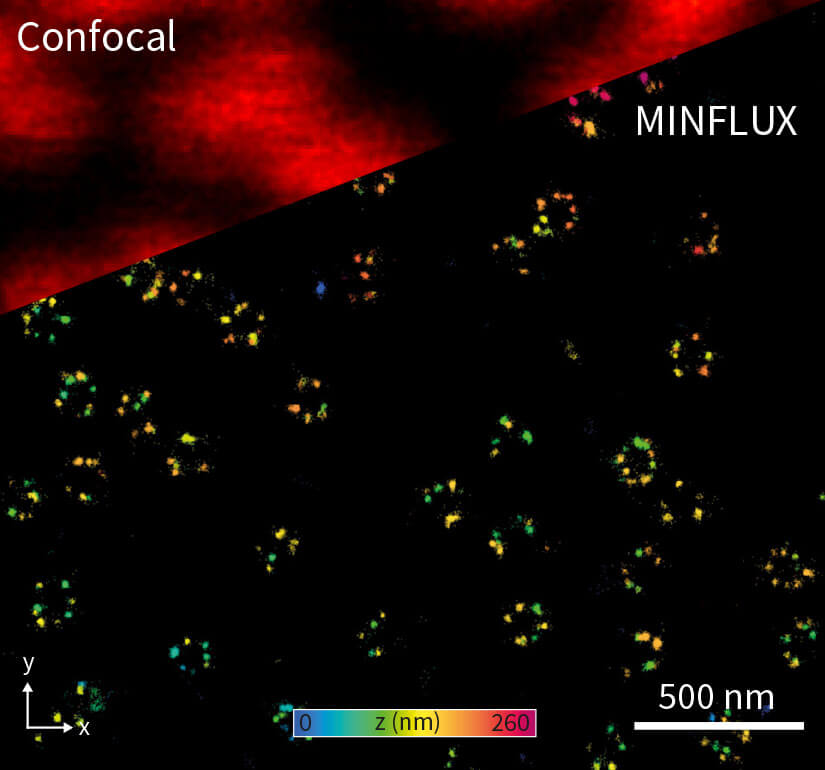
Figure 1. Confocal and 3D MINFLUX images of a nuclear pore complex sample.
Fluorescence Microscopy and the MINFLUX Concept
Fluorescence microscopy is widely used in research, diagnostics, and biomedical imaging. It enables the non-invasive multi-dimensional visualization of structures and molecules and is therefore ideally suited for the examination of biomedical samples. Unfortunately, the resolution of conventional light microscopes is limited to about half the wavelength of light 8. In the last few decades, several approaches were established to overcome this resolution limit 9-17.
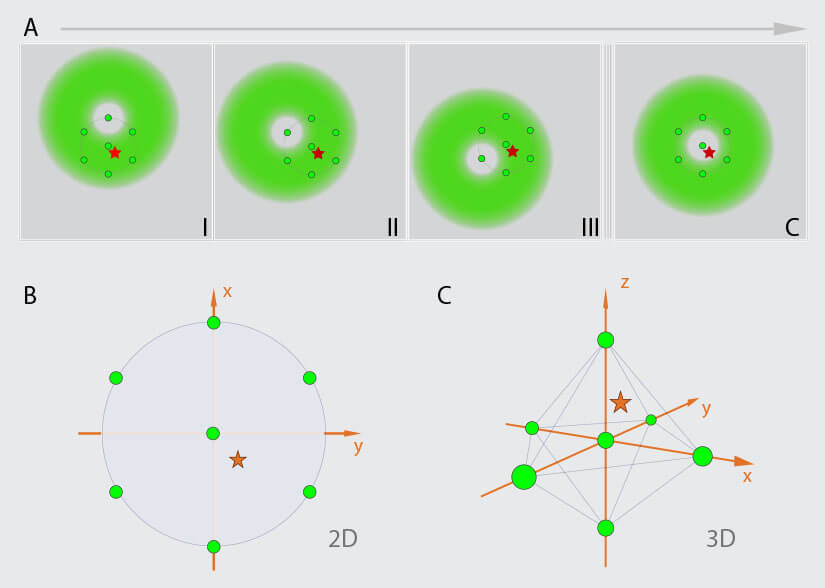
Figure 2. MINFLUX Scanning Scheme (A) MINFLUX uses a donut-shaped excitation beam to rapidly localize individual fluorophores while they are in the fluorescent state. For this the fluorescence is probed on pre-defined positions around a fluorophore in the “on” state. (B) For 2D MINFLUX a hexagonal pattern with a central point is used for probing positions with a donut shaped excitation beam. (C) For 3D MINFLUX a 3D donut i.e. a hollow sphere of light is used together with a octahedral pattern as probing pattern. Symbols: red star, fluorophore; green circle, probing position; I, II, III, C probing positions.
MINFLUX is a novel microscopy technique which is based on the localization of single fluorescence molecules 1. In contrast to camera based single molecule localization microscopy (SMLM) techniques 9 -17, MINFLUX is a beam scanning technique in which the fluorophore positions are determined using predefined scanning patterns encircling each fluorophore (Fig. 2). Molecules are excited using a focus shape featuring an intensity zero in the center e.g., a donut shaped for 2D MINFLUX or a hollow sphere (“bottle-beam”) for 3D MINFLUX. From the pre-defined positions of that zero intensity, the known shape of the excitation focus, and the detected number of photons emitted by the molecule at the different positions of the excitation beam, the position of the molecule can be determined precisely. Several iterations are used to determine the fluorophore’s localization precisely. In each consecutive iteration the probing pattern is recentered on the most recently estimated localization of the fluorophore and the diameter of the probing pattern is narrowed down. Through this refinement process, the additional information about the position of the emitter gained with every detected photon is immediately used to increase the information content of the following ones. In contrast, conventional superresolution methods detect all photons in the same way, with the same low information content as the first photon. Using the MINFLUX-approach, localization precisions on the mole cular scale, better than 2 nm in the focal plane and 3 nm in 3D, can be achieved using fewer photons and lower light doses compared to classical SMLM techniques 2.
A MINFLUX microscope for biomedical and biophysical applications
The abberior MINFLUX has been designed as a turn-key system for applications in the biomedical and biophysical sciences. In contrast to bench type setups, the microscope is built around a fully motorized research microscope body with transmission and epifluorescence functionalities (Fig. 3). The system offers many standard confocal functionalities, such as multiple excitation lines (e.g. 405 nm, 488 nm, 516 nm, 640 nm) and detection channels (e.g. for DAPI, GFP, Cy3 or Cy5), a confocal beam scanner with a large field of view, and a motorized pinhole. Furthermore, a powerful and user-friendly graphical user interface allows for pre-defined imaging workflows.
Of course, in addition to these functionalities, a high performance MINFLUX imaging mode is at the core of the microscope. It contains a spatial light modulator for shaping the MINFLUX excitation focus, an ultra-fast (>100 kHz) MINFLUX beam scanner based on electro-optical deflectors for XY beam positioning, and a 3D MINFLUX package based on a deformable mirror for beam positioning in the 3rd dimension. For achieving localization precision in the nanometer range, active stabilization of the sample position is essential. Here, a reflection-based stabilization unit is included, which stabilizes the position of the sample in x, y and z with a precision of < 1 nm (rms), guaranteeing stable measurements even for long image acquisition times.

Figure 3. The abberior MINFLUX is based on a fully motorized research microscope body, facilitating use for biomedical and biophysical applications together with standard workflows.
The abberior MINFLUX has been designed as a turn-key system for applications in the biomedical and biophysical sciences. In contrast to bench type setups, the microscope is built around a fully motorized research microscope body with transmission and epifluorescence functionalities (Fig. 3). The system offers many standard confocal functionalities, such as multiple excitation lines (e.g. 405 nm, 488 nm, 516 nm, 640 nm) and detection channels (e.g. for DAPI, GFP, Cy3 or Cy5), a confocal beam scanner with a large field of view, and a motorized pinhole. Furthermore, a powerful and user-friendly graphical user interface allows for pre-defined imaging workflows.
Fluorophores for MINFLUX imaging
The MINFLUX concept is based on the presence of a single fluorophore in the fluorescent state in the probing area at the time of the localization. Currently, two strategies are used to ensure this:
For fixed cell imaging, a stochastic switching strategy, comparable to (d)STORM 12,13, can be applied. For this, organic dyes are used in combination with buffer systems and reagents which enable the switching of the fluorophore between a non-fluorescent and fluorescent state. In the most prominent example, the carbocyanine dye Alexa Fluor 647 is applied together with an oxygen consuming GLOX buffer and thiols such as β-mercaptoethylamine (MEA) as blinking compounds 13. These thiols can bind to the dye-core and thereby transfer it to a non-fluorescent state. The conversion to the fluorescent state can occur spontaneously or can be induced by UV-light. The absence of oxygen reduces bleaching and spontaneous blinking of the dyes, supporting the control of the blinking kinetics by the UV-light intensity. This strategy was successfully used in MINFLUX for various dyes being excited at 640 nm, such as Alexa Fluor 647, CF660C, CF680 or sCy5 1-7.
The second strategy is comparable to the one used for PALM 14,15. This strategy is based on photoactivatable or photoconvertible fluorophores (organic dyes/ fluorescent proteins), which can be switched from a non-fluorescent to a fluorescent state or from one emission wavelength to another using light-based on photoconversion reactions. This approach was successfully applied in a recent publication 3, where the photoconvertible fluorescent protein mMaple was used as label in the MINFLUX imaging of nuclear pore complexes.
Labeling strategies for MINFLUX Imaging
Several labeling techniques have been applied for creating samples for MINFLUX 1-7. A widely applied and robust labeling technique for biomolecules and structures of interest in fixed samples is indirect immunolabeling. This technique is a very good starting point to test the suitability of a particular sample for MINFLUX. Even better results can be achieved using smaller labels 18 e.g. smaller antibody complexes, directly labelled antibodies or nanobodies. Labeling via SNAP- or Halo-tags is also a viable alternative to reduce the label size 1, 2, 7. Future developments in click chemistry and unnatural amino acids are likely to provide additional labeling strategies with minimal label size.
Nuclear Pore Complex samples as a benchmark for MINFLUX nanoscopy
MINFLUX nanoscopy has been shown to achieve unprecedented resolution levels in light microscopy 1,7. Hence, it can be expected that it facilitates addressing scientific questions that were not accessible until now. To benchmark the performance of super resolution microscopes for biomedical and biophysical imaging applications, Thevathasan et al. proposed the nuclear pore complex as a well-defined control sample from biomedical research 19. The eight-fold symmetric nuclear pore complex is one of the largest protein complexes within eukaryotic cells. It consists of a cytoplasmic and a nucleoplasmic ring which are separated by ~50 nm. The total diameter of the NUP rings is ~125 nm.
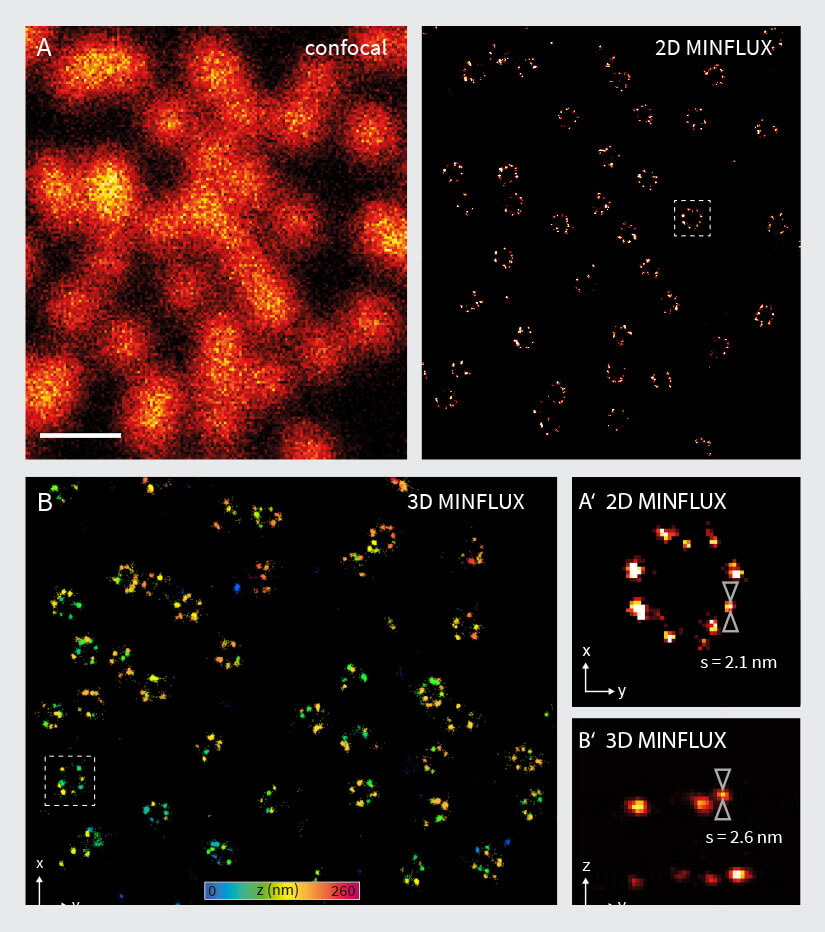
Figure 4. 2D and 3D MINFLUX nanoscopy of the nuclear pore complex subnunits. NUP96-SNAP/SNAP-Alexa Fluor 647 lend themselves as benchmark structures to test super resolution light microscopes. (A, A’) In contrast to confocal microscopy, 2D MINFLUX allows to visualize the shape and arrangement of individual subunits of the nuclear pore complex. Using a threshold value of 150 photons allows to reach localization precisions of ~2 nm in raw localization data. (B, B’) In addition, 3D MINFLUX facilitates imaging at molecular scales in all dimensions. In the axial direction localization precisions of ~2.5 nm in raw localization data have been reached. Scale bars, 500 nm. Please note that the axial coordinate is color-coded in B.
The performance of the MINFLUX was tested by imaging cells expressing NUP96-SNAP, labelled with Alexa Fluor 647. As shown in Fig. 4A, the 2D MINFLUX mode is able to resolve the NUP96 rings in the nuclear envelope with a diameter of ~110 nm. Single fluorophores were localized with a precision of ~2 nm (in raw localization data using a threshold value of 150 photons). Evaluation of the localization precision using a higher photon threshold results in a localization precision < 1 nm (in xy). These results are in accordance with the values given in 2, 19.
The 3D MINFLUX mode also enabled visualization of rings of labeled NUP96-SNAP proteins (Fig. 4B). Especially in the side view (Fig. 4B’), two planes of labeled NUP96-SNAP proteins are visible, which reflect the cytoplasmic and the nucleoplasmic ring of the nuclear pore complexes. A line profile in the axial direction reveals a localization precision of ~2.5 nm (in raw localization data using a threshold value of 150 photons). Evaluation of the localization precision using a higher photon threshold results in a localization precision of ~2 nm (in z).
For two-color MINFLUX imaging, a ratiometric imaging approach can be used 2, 17. Samples are prepared using two dyes which can be excited with the same wavelength, but which emit at different wavelengths. The fluorescence is registered using two spectrally separate detection channels so that the localizations can be assigned to the respective fluorophore. In practice, a dye with an emission maximum at ~665 nm (e.g. Alexa Fluor 647) is combined with a dye with a red-shifted emission maximum (e.g. CF680; em,max = 700 nm).
To benchmark the performance of the MINFLUX for two-color imaging, the NUP96-SNAP/ SNAP-Alexa Fluor 647 samples were additionally labelled with wheat germ agglutinin (WGA) conjugated to CF680. This reagent binds to glycoproteins in the center of the nuclear pores. Using two-color MINFLUX imaging, the rings formed by NUP96 became visible together with a very small ring or dot in the center of the pore (Fig. 5). As evidenced by this experiment, two-color MINFLUX enables the imaging of two structures which are in very close spatial relationship.
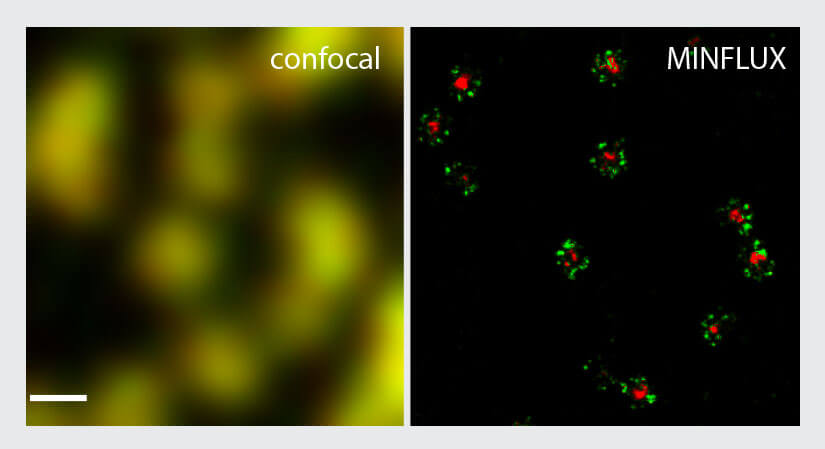
Figure 5. Two-color MINFLUX nanoscopy of the nuclear pore complex samples. Fixed NUP96-SNAP cells were labeled with SNAP-Alexa Fluor 647 (green) and WGA-CF680 (red) and imaged in confocal und 2D MINFLUX mode. Two-color 2D MINFLUX was performed using a ratiometric detection strategy. As in the single color images NUP96 was found in rings in the nuclear envelope. Further the stained glycoprotein core is visible in the second channel. Scale bar, 200 nm. Shown is raw localization data.
The imaging performance of the abberior MINFLUX is identical to the bench setups described before 1-4, 6. Nuclear pore complex samples display an idealized situation for MINFLUX imaging i.e. they are well defined structures, with established labeling strategies relying on the best performing fluorophores, and on very small labels i.e. SNAP tagged proteins and labels. The following examples will demonstrate the capabilities of the MINFLUX technology for more challenging samples.
MINFLUX imaging in Organelle Biology Samples.
Organelle biology is a very important field in the biological sciences. Although cell organelles and many pathways they are involved in are already well known, many important aspects regarding the positioning and dynamics of membrane proteins or physiological reactions are still lacking because their investigation is limited by the small size of these organelles.
MINFLUX imaging is the ideal tool for addressing these open questions. Below, two examples from organelle biology have been chosen to exemplify the advantages of MINFLUX.
The first example stems from mitochondrial biology. Mitochondria play a crucial role in life, disease, and death. The interior of mitochondria is highly structured. They have a diameter of ~300 nm and possess two membranes hosting a large set of membrane proteins as functional units. The mitochondrial matrix contains the mitochondrial genome called mtDNA 20. In this example, two labels with a very dissimilar labelling density were combined to test if two-color MINFLUX works under these conditions. For this, the mitochondrial import receptor TOM20 in the mitochondrial outer membrane and the mtDNA nucleoids were labelled by indirect immunofluorescence using sCy5 and CF680 (Fig. 6). Using the ratiometric two-color MINFLUX imaging approach described above, it was possible to localize individual fluorophores within the mitochondria, showing that immunolabelled samples can be imaged, even at very high fluorophore densities. Further, it was possible to distinguish these labels and to visualize single TOM20 clusters with a diameter of only 8 – 15 nm together with the densely packed mtDNA nucleoids (average diameter ~100 nm).
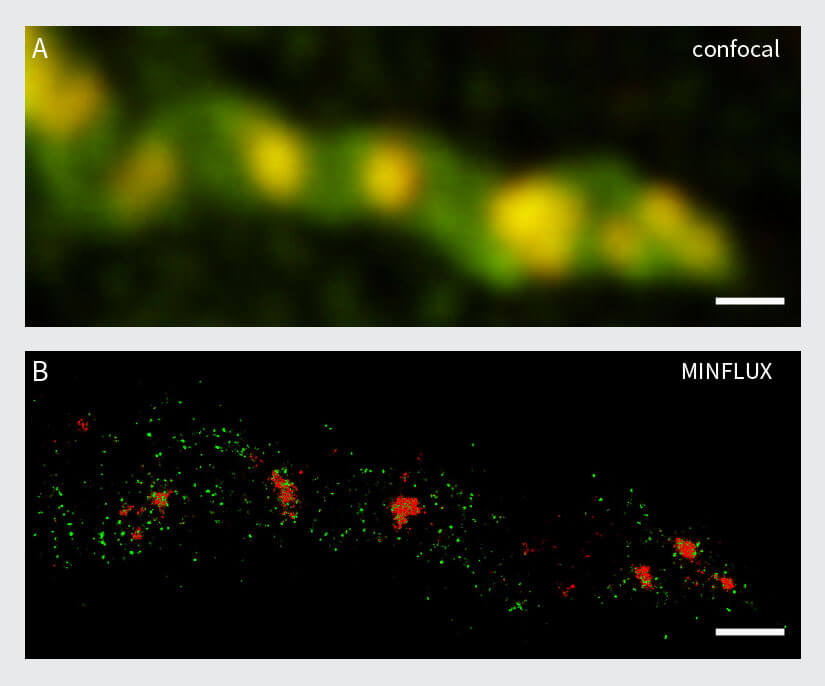
Figure 6: Two-color MINFLUX on Mitochondria Samples. The mitochondrial protein TOM20 (green) and mtDNA (red) were labelled in mammalian cells with indirect immunofluorescence using secondary antibodies coupled to sCy5 and CF680. Two-color confocal (A) and MINFLUX (B) was performed using a ratiometric detection strategy. Please note that the labelling density of both structures is highly dissimilar. For TOM20 single proteins are labeled in the mitochondrial membrane, whereas numerous binding sites are decorated in the mtDNA. MINFLUX enables the visualization and separation of both structures. Scale bars, 500 nm.
As a second example, individual proteins within peroxisomes were imaged using MINFLUX. Peroxisomes are very small cell organelles with a diameter of only ~100 nm. For MINFLUX imaging, the peroxisomal membrane protein PMP70 was labelled with indirect immunofluorescence using Alexa Fluor 647. In 2D MINFLUX mode, a high number of localizations was detected in the peroxisomes, illustrating again that not only very sparsely labelled samples, but also dense structures can be imaged successfully using MINFLUX (Fig. 7A). This applies not only to 2D MINFLUX, but to 3D MINFLUX nanoscopy as well (Fig. 7B). The 3D data shows a high number of localizations per peroxisome and allows for the evaluation of the three-dimensional shape and PMP70 distribution within each peroxisome.
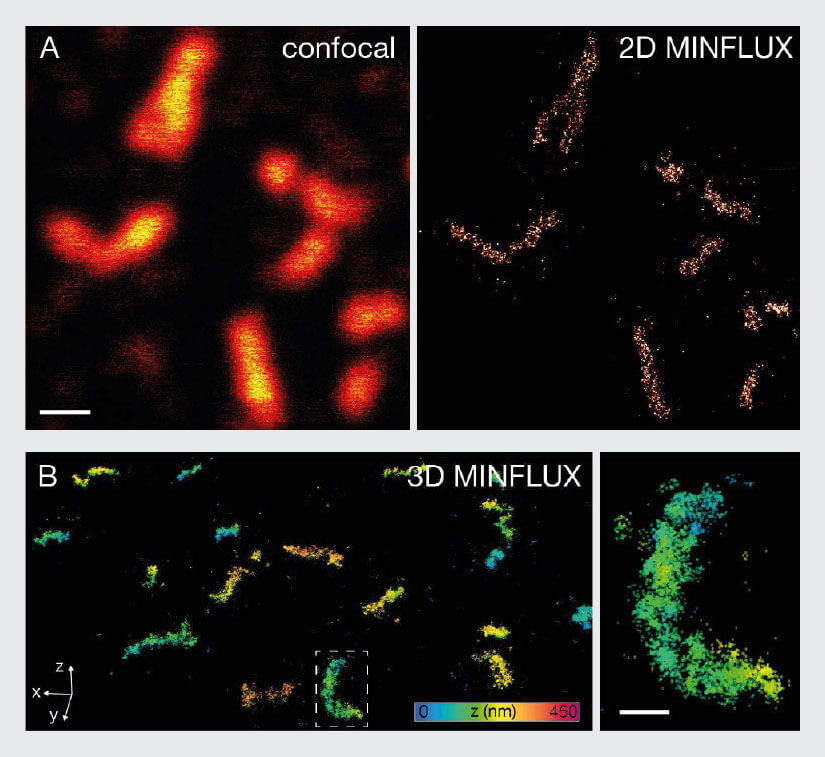
Fig. 7 MINFLUX imaging of Peroxisomal Samples. For MINFLUX imaging of peroxisomes mammalian cells were fixed and labelled with primary antibody against PMP70 and secondary antibodies coupled to Alexa Fluor 647. (A) Confocal and MINFLUX image shows that despite the high labelling density peroxisomes can be imaged with MINFLUX. (B) In addition to that 3D MINFLUX allowed to visualize the shape of peroxisomes in 3D. The displayed data set has a lateral size of 7.2 x 8.5 μm. The image on the right represents a magnification of the box in B. Scale bar: 500 nm (A), 200 nm (B)
MINFLUX Imaging of Neurobiology Samples
The resolution capabilities of MINFLUX are expected to push the limits for numerous imaging applications in neurobiology as well. To exemplify the capabilities of 2D and 3D MINFLUX nanoscopy for neuroscience applications, a well-known test structure from neurobiology called βII spectrin in primary neurons was selected. Spectrins are membrane-associated scaffolding and actin-binding proteins, which form a periodic lattice with spacings of about 190 nm along axons 21. These cytoskeletal networks play an important role in the shaping and structural organization of neurons. βII spectrin in primary hippocampal neurons was stained with Alexa Fluor 647 using indirect immunolabeling. 3D MINFLUX clearly revealed the periodic arrangement of the βII spectrin in an axon (Fig. 8) with a localization precision in the nanometer scale.
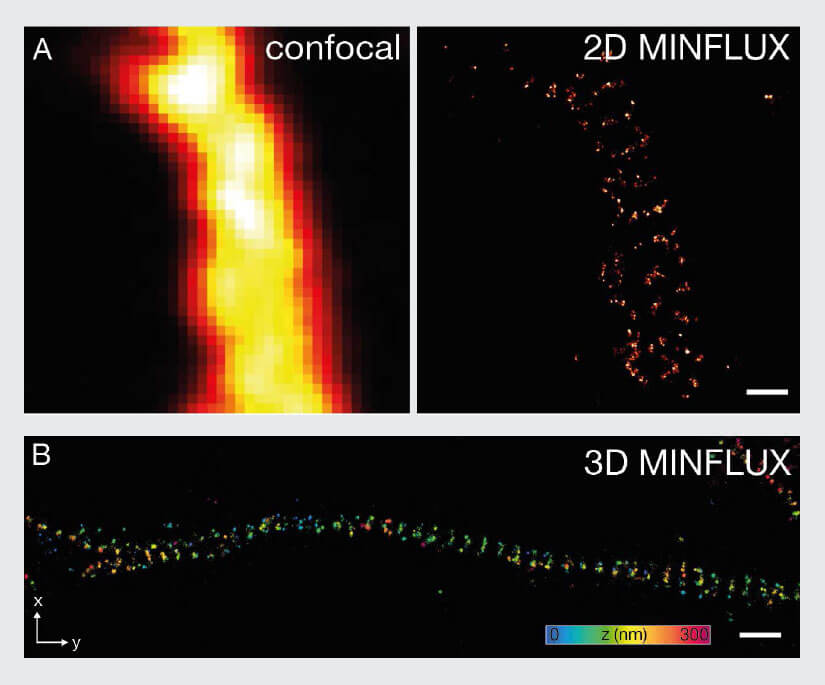
Figure 8: MINFLUX imaging of Neurobiology samples. (A) 2D MINFLUX and (B) 3D MINFLUX imaging of βII spectrin in a primary hippocampal neuron labeled with Alexa Fluor 647 by indirect immunofluorescence in top view. Scale bar: 500 nm. The axial coordinate is color-coded in B.
Summary
The abberior MINFLUX microscope is a turn-key system with integrated 3D stabilization, which makes the unique features of MINFLUX accessible to a wide range of researchers. abberior MINFLUX systems come with confocal functionality and are upgradable for further techniques like STED microscopy. 2D and 3D MINFLUX nanoscopy achieves molecular scale resolution in biomedical samples, enabling the visualization of subcellular structures which cannot be visualized with alternative fluorescence microscopy techniques. Two-color MINFLUX offers information about the localizations of two proteins in relation to each other and about their distribution with outstanding resolution. Therefore, MINFLUX nanoscopy will facilitate new insights into biological and biomedical questions.
Acknowledgements
We thank Jan Ellenberg (EMBL, Heidelberg, Germany) for the U2OS SNAP-NUP96 cell line. We thank Elisa D’Este and Jasmine Hubrich (MPI for Medical Research, Heidelberg, Germany) for the neuron sample stained for βII spectrin.
1 Schmidt R., et al. (2021) MINFLUX nanometer-scale 3D imaging and microsecond-range tracking on a common fluorescence microscope. Nat Commun., 12(1):1478.
2 Balzarotti, F. , et al. (2017). Nanometer resolution imaging and tracking of fluorescent molecules with minimal photon fluxes. Science, 355(6325), 606–612.
3 Gwosch, K. C. , et al. (2020). MINFLUX nanoscopy delivers 3D multicolor nanometer resolution in cells. Nature Methods, 17(2), 217–224.
4 Eilers Y., et al. (2018) MINFLUX monitors rapid molecular jumps with superior spatiotemporal resolution. Proc Natl Acad Sci U S A.; 115(24):6117-6122.
5 Pape, J. K., et al. (2020). Multicolor 3D MINFLUX nanoscopy of mitochondrial MICOS proteins. Proc Natl Acad Sci U S A; 117(34), 20607–20614.
6 Masullo L.A., et al. (2021) Pulsed Interleaved MINFLUX. Nano Lett.; 21(1):840-846.
7 Stephan T., et al. (2020) MICOS assembly controls mitochondrial inner membrane remodeling and crista junction redistribution to mediate cristae formation. EMBO J.; 39(14):e104105.
8 Abbe, E. (1873) Beiträge zur Theorie des Mikroskops und der mikroskopischen Wahrnehmung. Archiv. Mikrosk. Anat. 9, 413–418
9 Hell S.W. & Wichmann J. (1994) Breaking the diffraction resolution limit by stimulated emission: Stimulated-emission-depletion fluorescence microscopy. Opt Lett.; 19:780–782.
10 Klar T.A., et al. (2000) Fluorescence microscopy with diffraction resolution barrier broken by stimulated emission. Proc Natl Acad Sci USA.; 97:8206–8210.
11 Sahl S.J., Hell S.W., Jakobs S. (2017) Fluorescence nanoscopy in cell biology. Nat Rev Mol Cell Biol.; 18:685–701.
12 Rust M.J., Bates M.,& Zhuang X. (2006) Sub-diffraction-limit imaging by stochastic optical reconstruction microscopy (STORM) Nat Methods.; 3:793–795.
13 Lampe A., et al. (2012) Multi-colour direct STORM with red emitting carbocyanines. Biol Cell.; 104(4):229-37.
14 Betzig E., et al. (2006) Imaging intracellular fluorescent proteins at nanometer resolution. Science.; 313(5793):1642-5.
15 Hess S.T., Girirajan T.P.K.,& Mason M.D. (2006) Ultra-high resolution imaging by fluorescence photoactivation localization microscopy. Biophys J.; 91:4258–4272.
16 Fölling J., et al. (2008) Fluorescence nanoscopy by ground-state depletion and single-molecule return. Nat Methods.; 5(11):943-5.
17 Testa I., et al. Multicolor fluorescence nanoscopy in fixed and living cells by exciting conventional fluorophores with a single wavelength. Biophys J. 2010 Oct 20;99(8):2686-94.
18 Fornasiero EF, Opazo F. Super-resolution imaging for cell biologists: concepts, applications, current challenges and developments. Bioessays. 2015 Apr;37(4):436-51.
19 Thevathasan J. V., et al. (2019). Nuclear pores as versatile reference standards for quantitative superresolution microscopy. Nature Methods, 16(10), 1045–1053.
20 Jakobs S., Wurm C.A. (2014) Super-resolution microscopy of mitochondria. Curr Opin Chem Biol.; 20:9-15.
21 Xu K., Zhong G.,& Zhuang X. (2013) Actin, spectrin, and associated proteins form a periodic cytoskeletal structure in axons. Science.; 339(6118):452-6.


