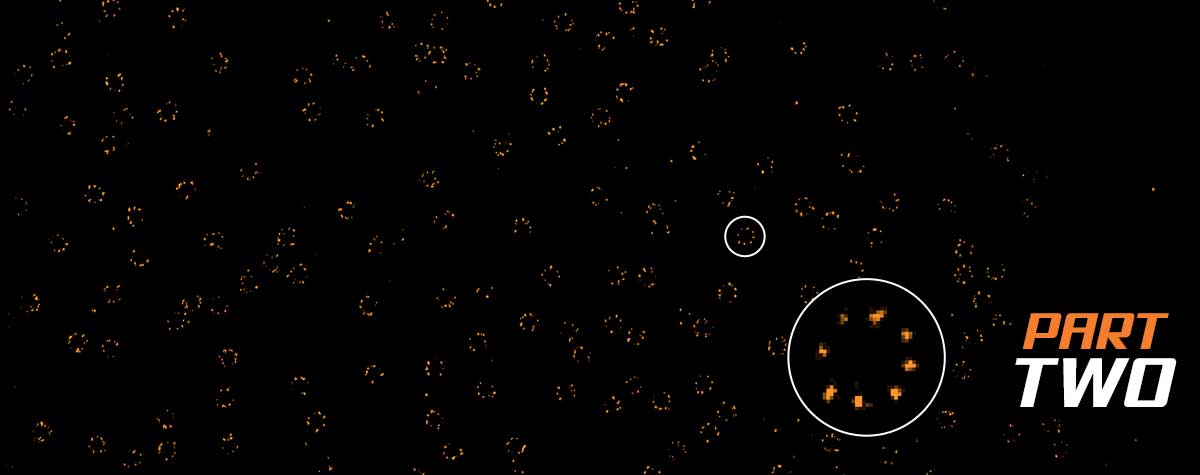
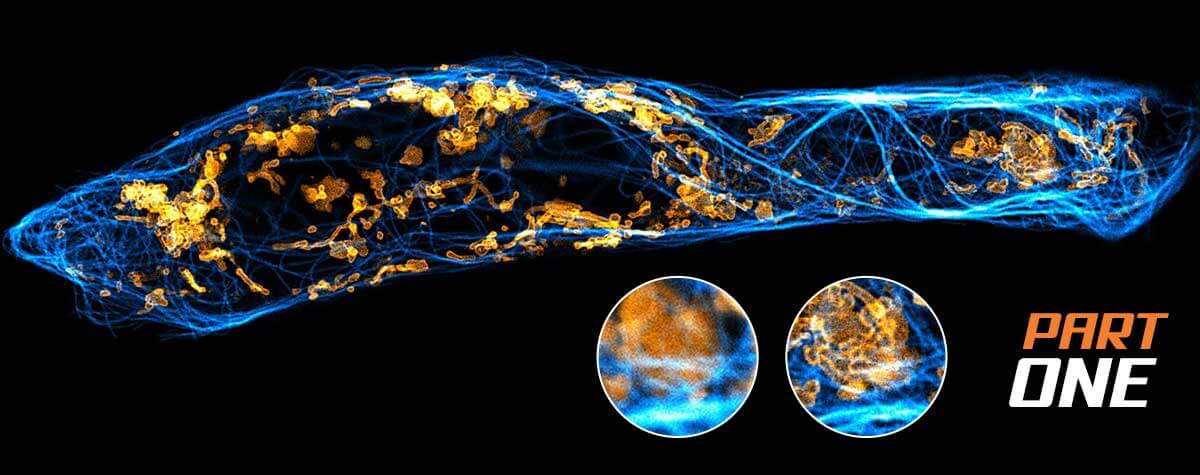
SIM vs STED
Structured illumination microscopy uses frequency patterns produced when you illuminate a sample with a grid of light to resolve details that are invisible to a wide-field microscope. However, the system can only extract so much resolution information and it heavily relies on post-processing for image reconstruction, leaving it short of a superresolution technology like STED. In terms of resolution, SIM and confocal roughly have the same limitations. Read on to find out why.
a limitation of frequencies
In 2001, Mats Gustafsson published a short communication in the Journal of Microscopy.1 In it, he pointed out that resolution improvements of confocal fluorescence microscopy over wide-field microscopy were limited. He explained that “a confocal microscope detects extended resolution information only weakly and only if operated with a pinhole that is significantly smaller than the Airy disk. Such a small pinhole discards much of the desired in-focus emission light together with the unwanted out-of-focus light.” Gustafsson then proposed an alternative method: illuminating a sample with fine stripes of light would produce patterns containing high-resolution information that could be extracted computationally. He called the method structured illumination microscopy (SIM).
Since then, SIM has become a widespread tool for fluorescence imaging. SIM is fast because it requires no scanning, compatible with conventional fluorescent labels, and reliably generates decent images due to integrated data processing (but beware – not everything that looks good is good, as will be discussed below). Nevertheless, resolution with SIM is just as limited as with confocal, albeit at higher signal levels. Generally, commercial SIM systems can improve resolution over a wide-field microscope by a factor of 2 – about 100 nm laterally and roughly 350-400 nm axially. So, in terms of generating clear images at resolutions in double or even single-digit nanometric scales, superresolution systems like STED far outstrip the capabilities of SIM (see table further below for a comparison).
To understand that limitation, we need to take a quick jaunt into the world of frequencies.
From real space to frequency space
Any visual stimulus – a signal, an image – can be represented as the sum of multiple sine waves of different frequencies and amplitudes. The high frequencies contributing to the sum generally correspond to fine detail, whereas low frequencies are the coarse aspects of the stimulus. A Fourier transform breaks down that sum into its constituent sine waves, essentially translating information from the spatial domain to the frequency domain.

Constituent sine frequencies of a visual signal can be extracted via a Fourier transform. The passband limit prevents high spatial frequencies from passing through the system, limiting resolution.
The diffraction barrier that curbs the resolution of conventional optical systems in the spatial domain corresponds to a passband limit in the frequency domain that prevents high spatial frequencies from passing through the system.
Footnote: Note that we’re talking about spatial frequencies here: the number of cycles a signal varies as we move in space, for example along a sample dimension. There is also such a thing as temporal frequency, which tells us how often something happens when we move in time. For the purpose of describing SIM here, when we say frequency, we’re talking about spatial frequencies.
So, in an epifluorescence wide-field microscope, the high-frequency components of the emission signal are cut off and go undetected. Without high frequencies, less detail is captured, and resolution is low. One way to increase the resolution is to manipulate those high frequencies as to shift them into the passband. You might recall from high-school that multiplying two signals with different frequencies generates additional frequencies at the sum and differences of the original frequencies.It turns out, this is exactly what we need for SIM!
Exciting at one frequency
SIM uses a striped, sinusoidal pattern of known frequency to excite fluorophores in a sample. Let’s say that this frequency is just at the edge of the passband of the microscope. The resulting distribution of excited fluorophores in the sample is essentially the product of this excitation frequency with the unknown frequencies that describe the sample. This means, some frequency mixing must have happened; we now also have the difference of the excitation and sample frequencies in addition to the original ones. This resulting difference frequency is small for all sample frequencies that are just a little higher (and lower) than the excitation frequency, just as the difference of two similar numbers is small.
But small frequencies can be detected, because they are lower than the original frequencies and can pass through the diffraction-limited detection passband. This means that we now can detect frequencies that are a bit higher than the excitation frequency that we put at the limit of the passband; frequencies that would normally be blocked. Thus, the emission signal includes extended resolution information.
However, that information is not directly accessible to produce an image, because the down-shifted frequencies mingle with the lower sampler frequencies that are still present. Also, striped illumination with a single excitation frequency obviously cannot excite fluorophores at all positions, and we’re also still only mixing along one spatial direction. Therefore, multiple readouts are made with the excitation illumination in different phases and angles, and these are then processed to computationally reconstruct the sample image.
Exciting and detecting in a spot
In essence, confocal microscopy does the same thing as SIM. The key difference is simply that there is not just one frequency of excitation stripes as in SIM, but many of them. A confocal microscope’s illumination spot contains a continuous spectrum of low to high frequencies up to the passband, whose sum is exactly an Airy pattern.
Consequently, you can think of the emission signal as a sum of original and down-mixed sample frequencies. The key point is that some high frequencies are again shifted into the passband of the system, and the detected signal will include more detail than the equivalent in a wide-field microscope, where the frequency of excitation is exactly zero, meaning that no mixing happens. In a confocal microscope, excitation is localized in a tight spot instead of being spread out as stripes all over the sample like in SIM. For this reason, one can perfectly get away without computational processing. The raw data are the image, albeit just one small, though detailed, spot.
So, confocal microscopes scan the field of view to generate a complete image, one or a few spots at a time (depending on microscope type). What’s important to recognize about both SIM and confocal microscopy is that image formation is still diffraction-limited and the resolution is finite. An exception is nonlinear SIM, which uses high powers to saturate excitation, thereby generating a series of frequencies even higher above the passband, but nonlinear SIM has not seen widespread use due to excessive bleaching.
Still wavelength-dependent or time to move on?
Modern SIM setups perform long imaging sessions (>1 h) and, being inherently parallelized, offer speeds of over 500 frames per second with a large field of view (> 200 µm). They can image samples up to a few cell layers thick and they standardly accommodate 4–6 different color labels. SIM images tend to look better than confocal images. For one, closing the pinhole of a confocal microscope to improve resolution also curtails the detection signal. And two, the mandatory post-processing step in SIM usually entails some kind of smoothing step.
However, these advantages of SIM are accompanied by some relevant limitations. The accuracy of SIM depends on knowing the shape of its excitation illumination. Optics and sample can distort those stripes, which generates artifacts in the reconstruction process, in particular with thicker samples or imperfect match of refractive indices. Although those artifacts have been characterized, they won’t always be apparent because the post-processing will still return an image based on warped data. Therefore, imaging fidelity requires careful alignment and calibration of the microscope, attention to differences in the refractive index of sample and immersion liquid, and knowledge about the impact of illumination and point spread function characteristics on the reconstructed image.
How does this compare to superresolution using stimulated emission depletion (STED)? While SIM and STED share some strengths, the disadvantages of SIM detailed above are unknown to STED. STED microscopy means true physical superresolution and the raw data is final, leaving no room for misinterpretation (read here how STED works). To top it off, today’s STED comes as a plug-and-play box that lets users generate superresolution images immediately and with minimal training.

The most important distinction between STED and SIM, however, is the fact that structured illumination imaging is still wavelength-dependent. That limitation cannot be overcome in the nanometric realm. Only systems that circumvent the diffraction limit will look deeper and more clearly at the molecular intricacies of the natural world.
So, maybe it’s time to move on.
1 Gustafsson, M.G.L. 2001. Surpassing the lateral resolution limit by a factor of two using structured illumination microscopy. J. Microscopy 198: 82. DOI: 10.1046/j.1365-2818.2000.00710.x


