

Sample gallery
Fluorescence imaging, whether at confocal, STED or MINFLUX resolution, guarantees unique insights into the function and structure of life at the molecular level. Besides the scientific information content, some sample portraits provide simply beautiful images. Enjoy browsing our sample gallery.
the fine art of science

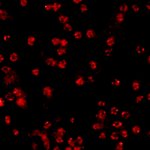
Description
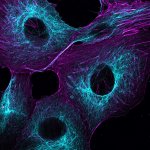
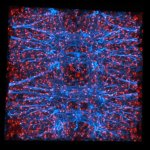
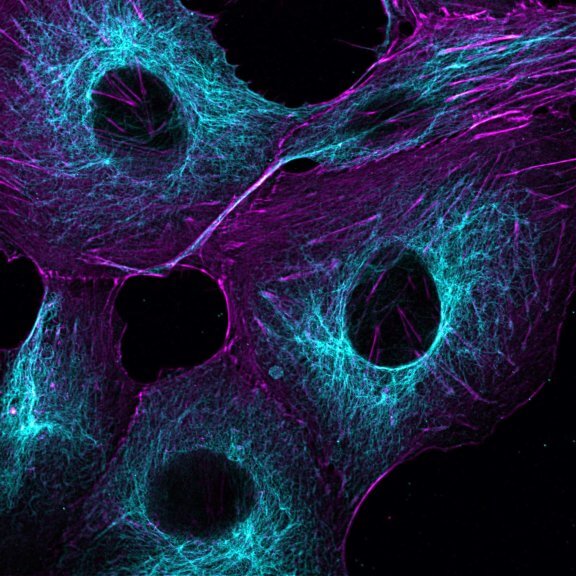
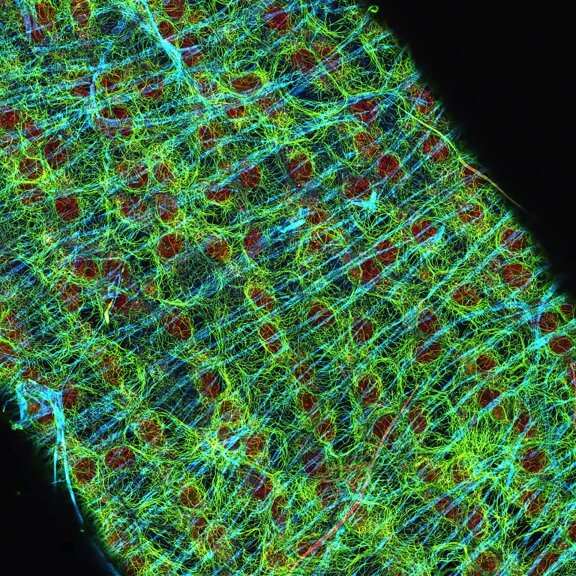
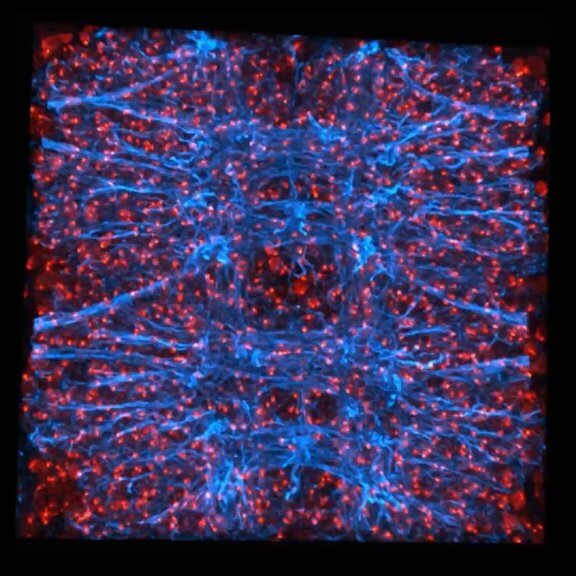
Mammalian cells stained for actin (purple, abberior STAR RED) and vimentin (cyan, abberior LIVE 460L). Differential detection with the MATRIX array detector was used to improve resolution, optical sectioning, and signal-to-background-ratio.
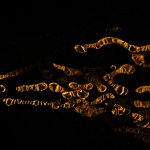
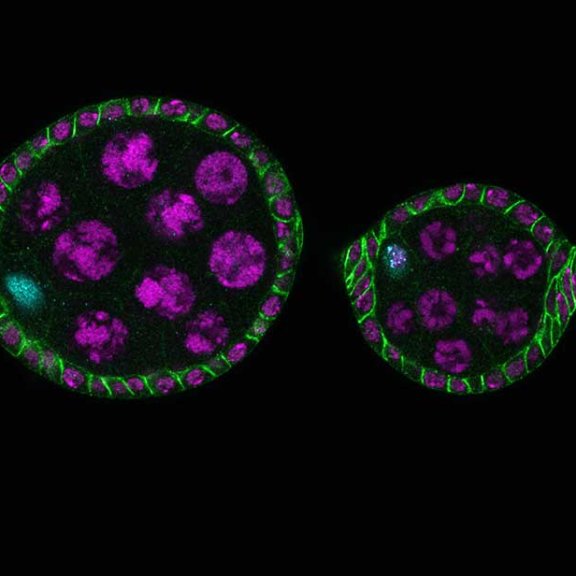
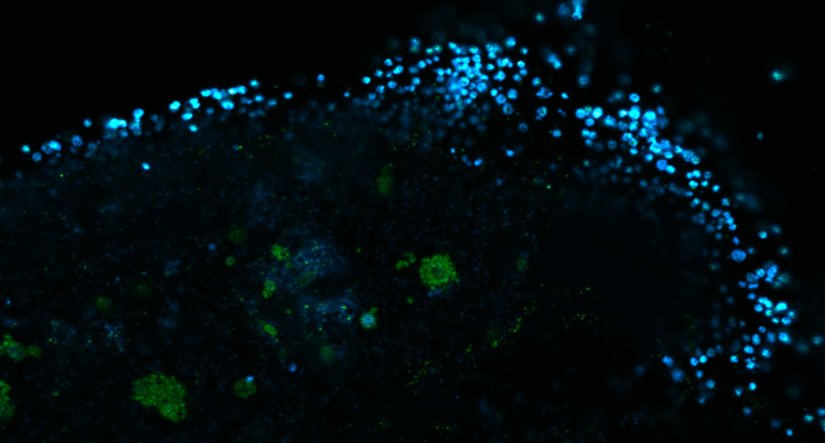
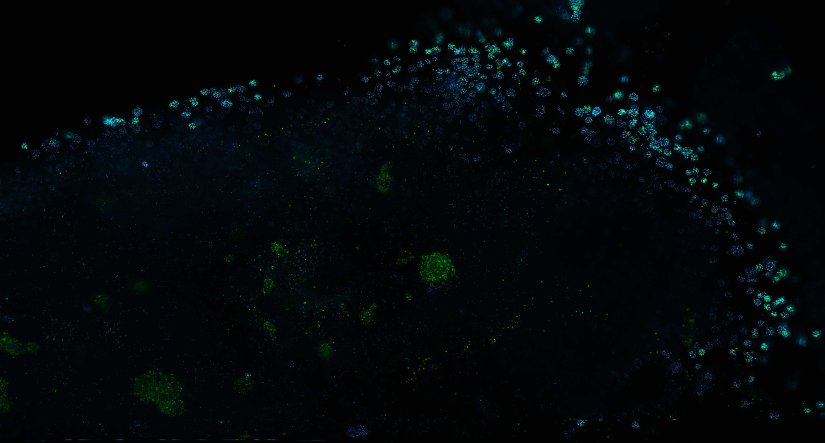
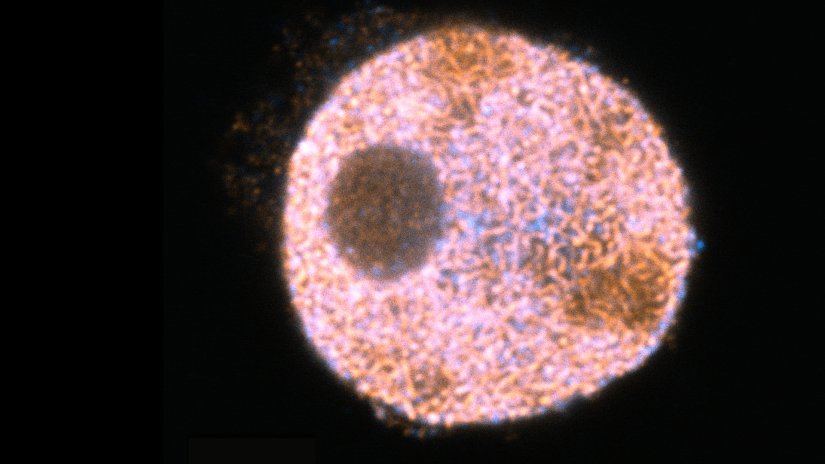
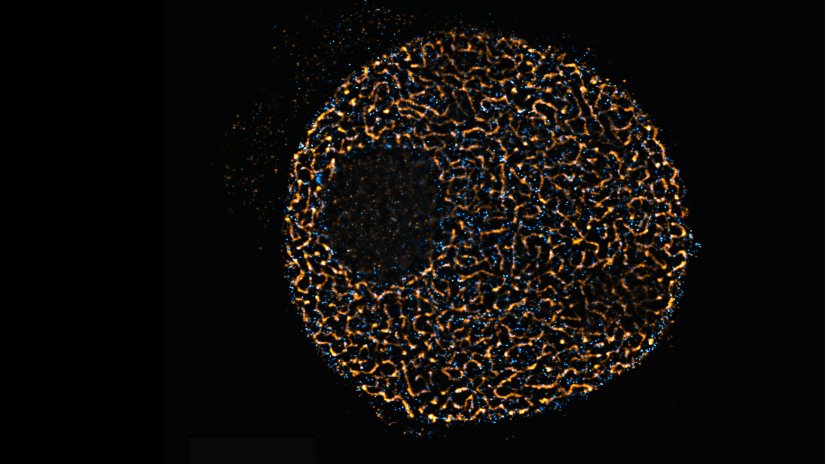
Description
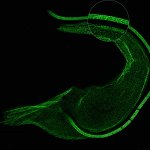
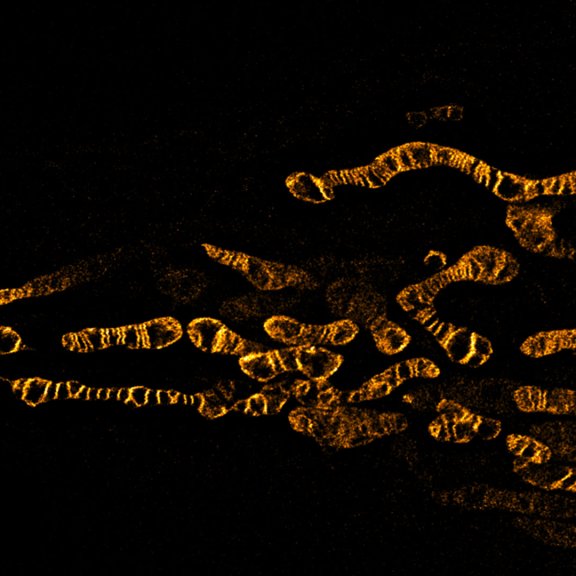
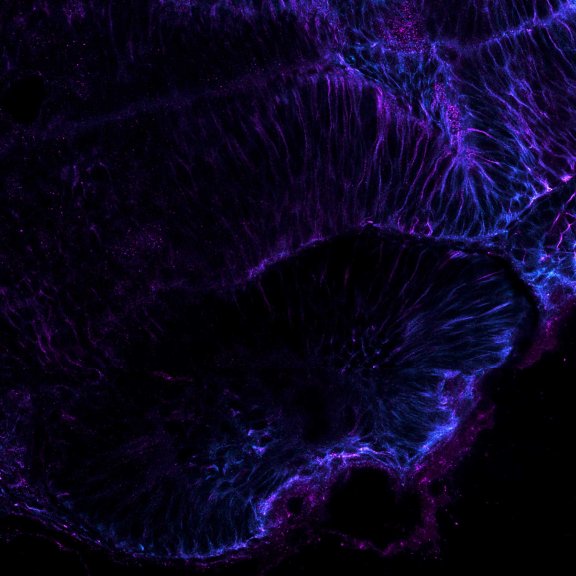
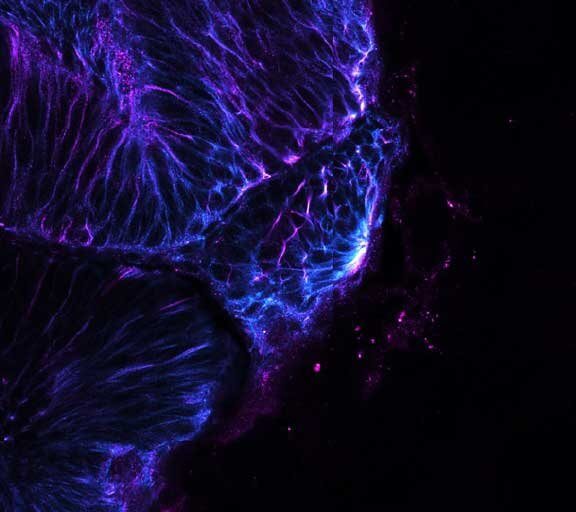
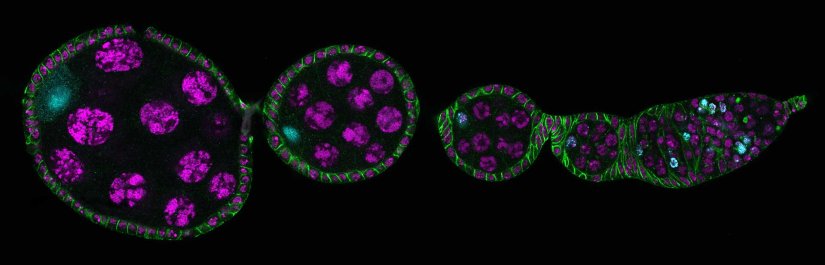
Drosophila ovariole stained for the synaptonemal complex protein C3G (cyan, abberior STAR RED), showing how the complex is formed and disassembled during oocyte development. DNA was stained with DAPI (purple), spectrin with abberior STAR ORANGE (green).
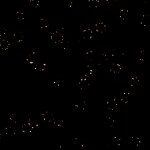
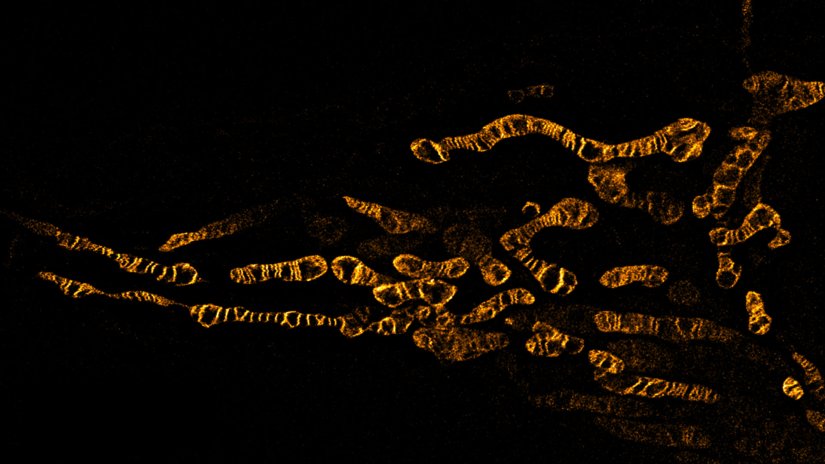
Description
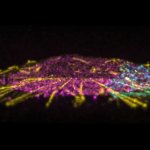
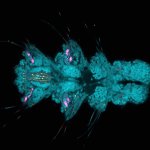
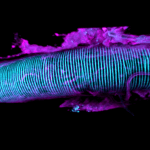
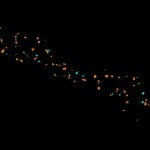
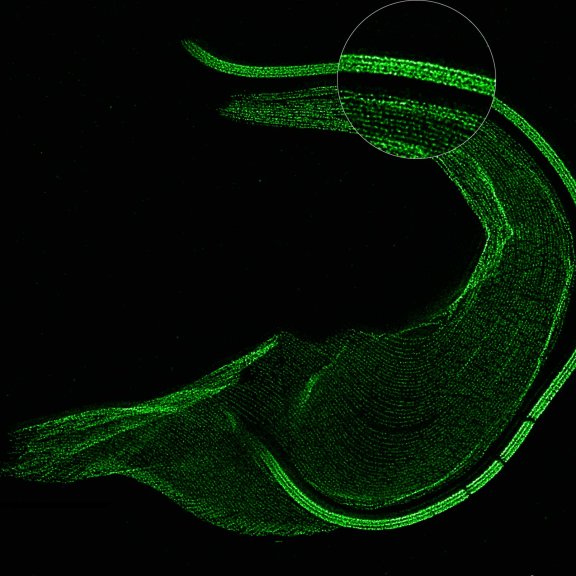
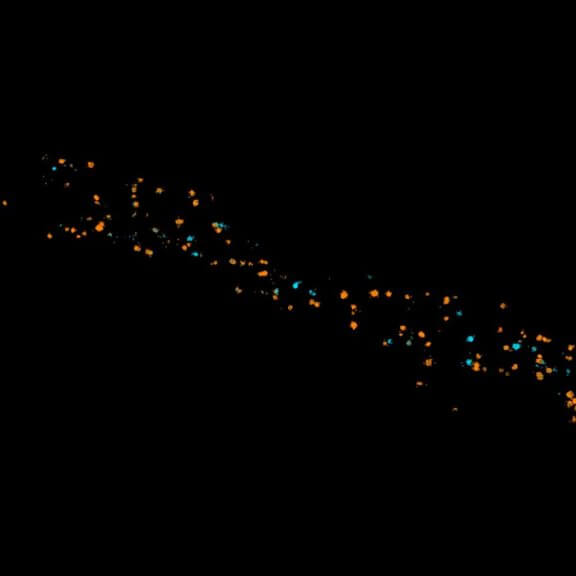
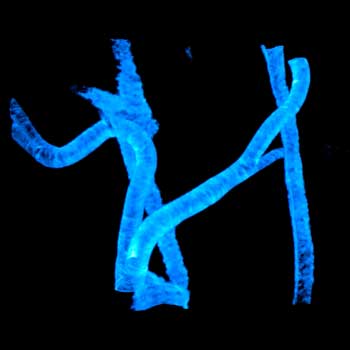
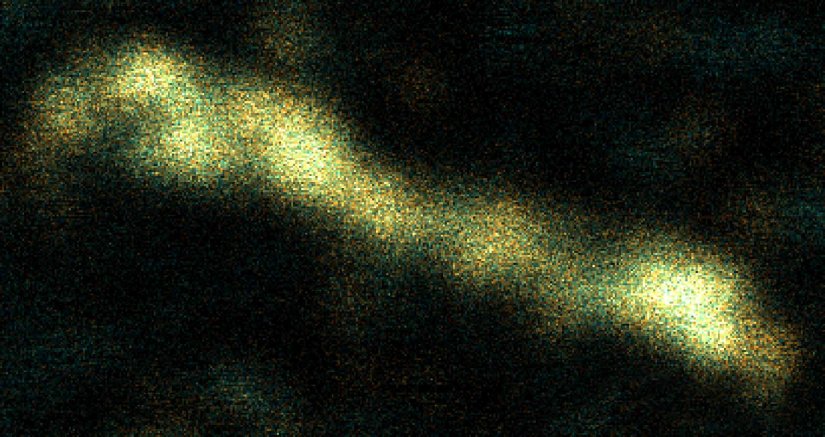
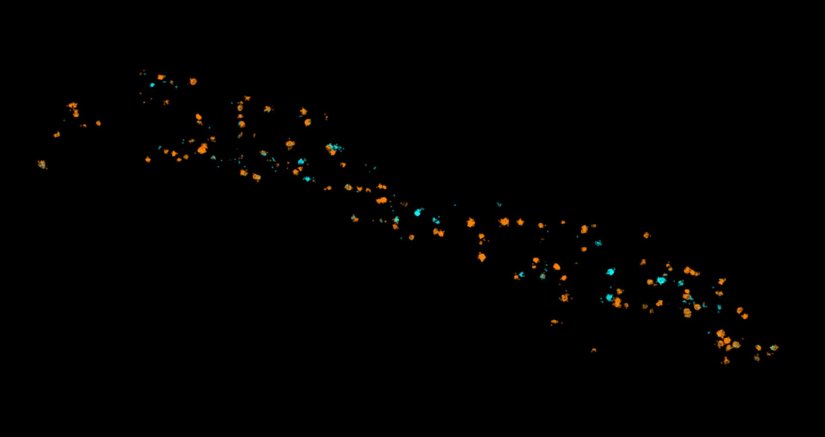
The protozoan Trypanosoma, fixed and three-fold expanded, was stained for tubulin, imaged with STED, and deconvolved with TRUESHARP image boosting. The combination of expansion and STED provides a resolution at which the four tubulin fibers of the flagellum are clearly visible. Scale bar refers to expanded specimen.
Sample courtesy: Mélanie Bonhivers, Laboratoire de Microbiologie Fondamentale et Pathogénicité, CNRS / Université Bordeaux, France

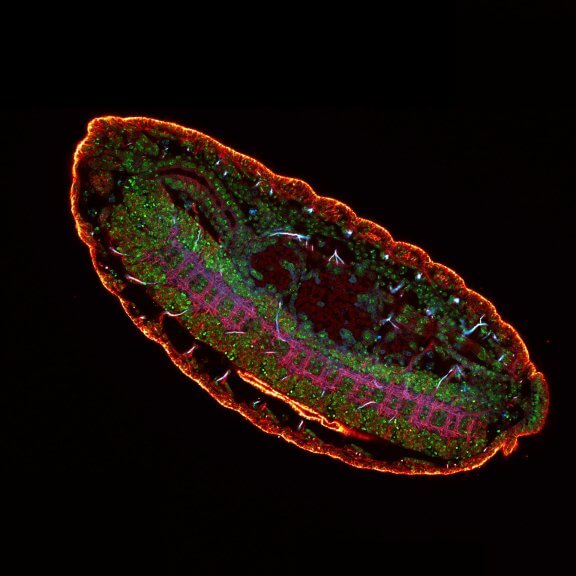
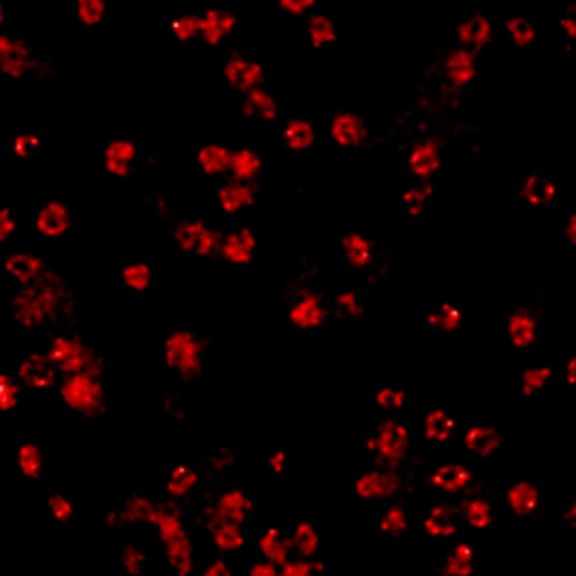
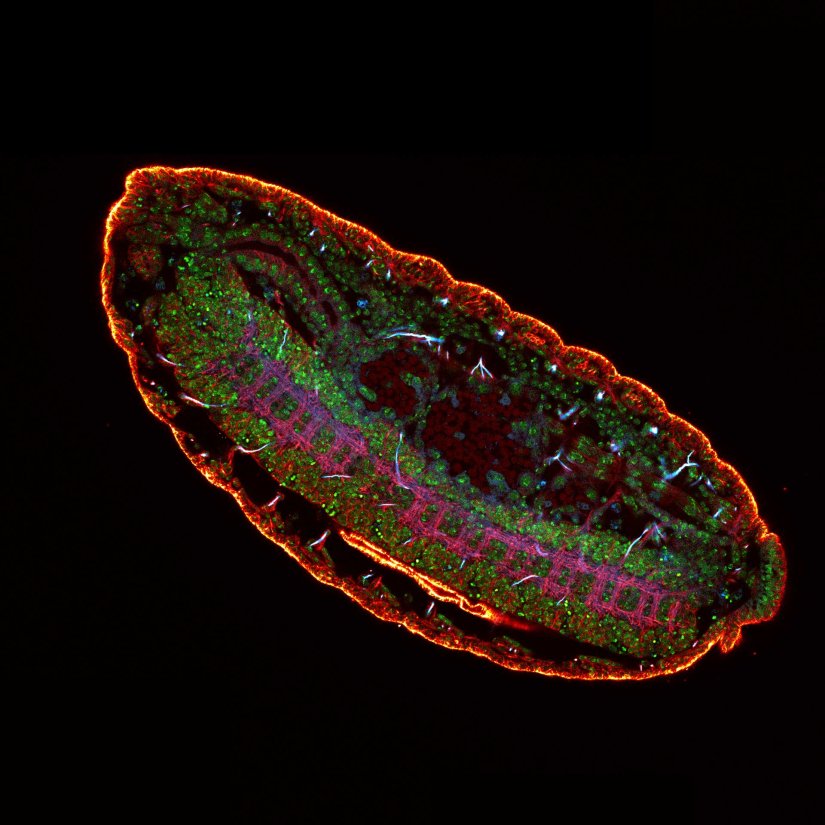
Description
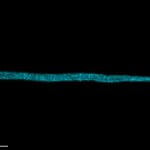
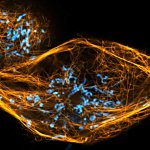
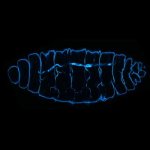
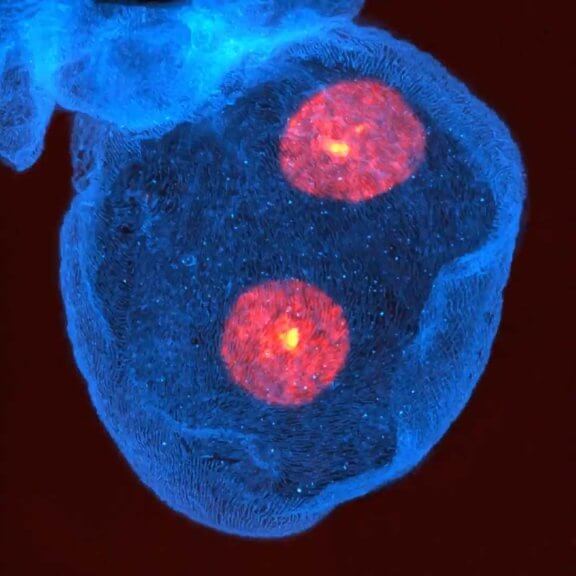
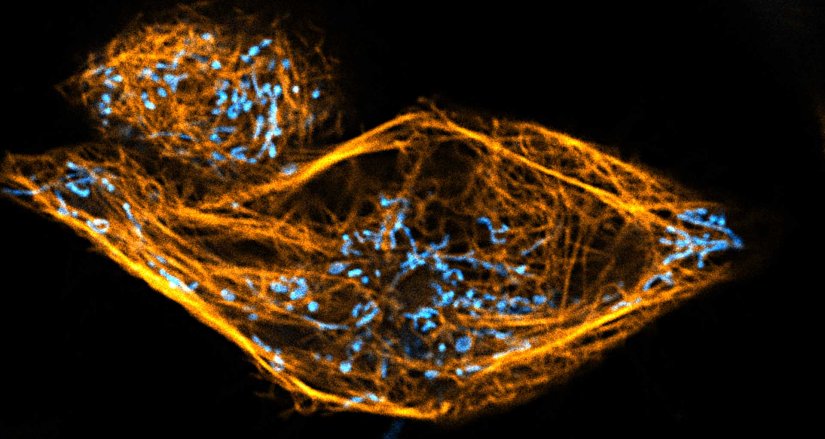
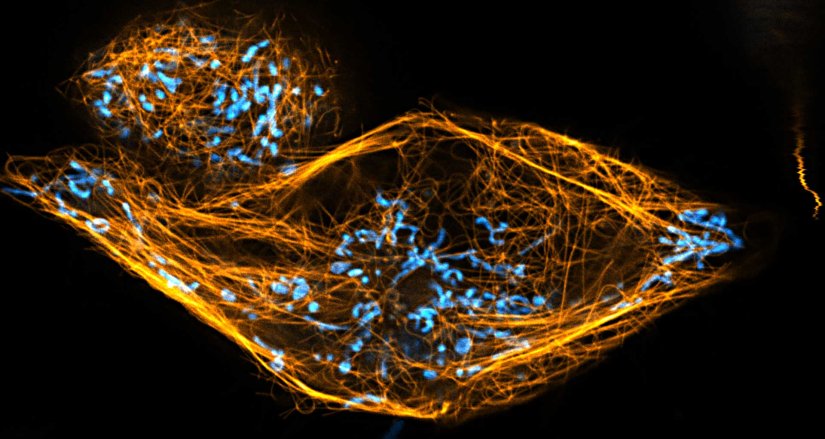
Drosophila egg in the ovary stained for tubulin (green, abberior STAR RED), actin (blue, abberior STAR GREEN), and DNA (red, abberior LIVE 590).
Description
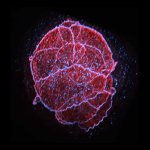
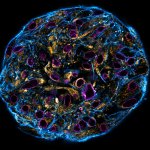
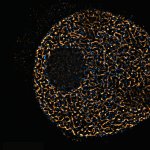
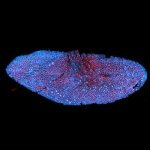
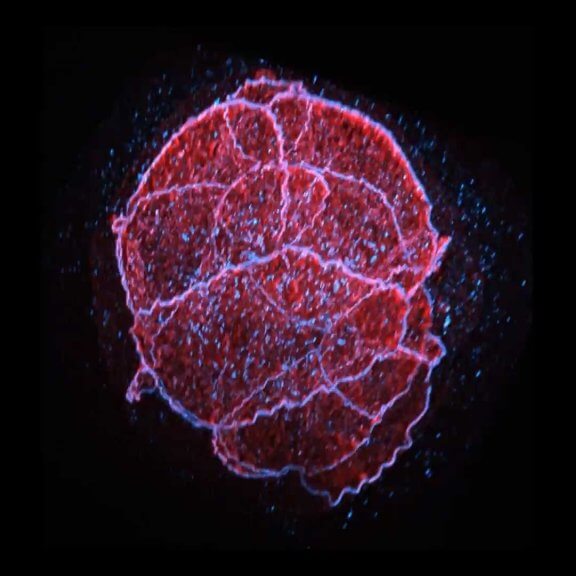
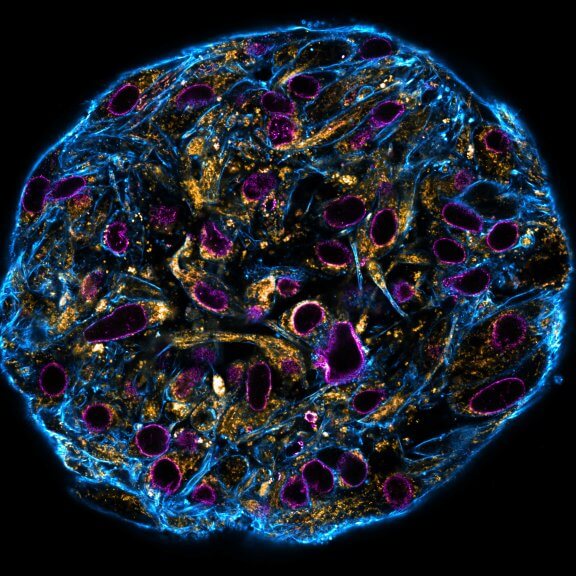
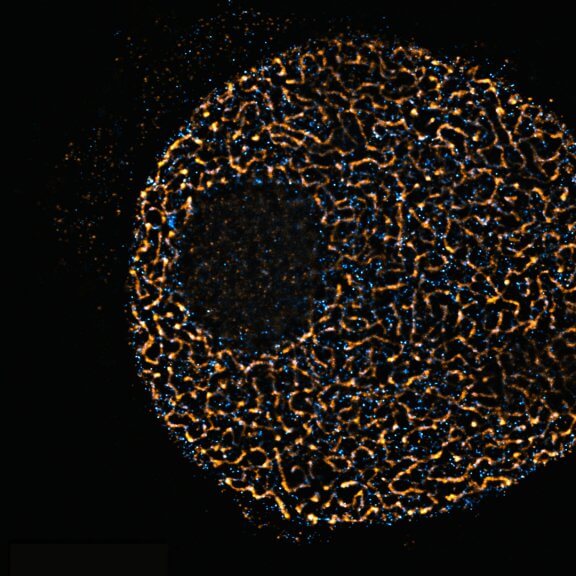
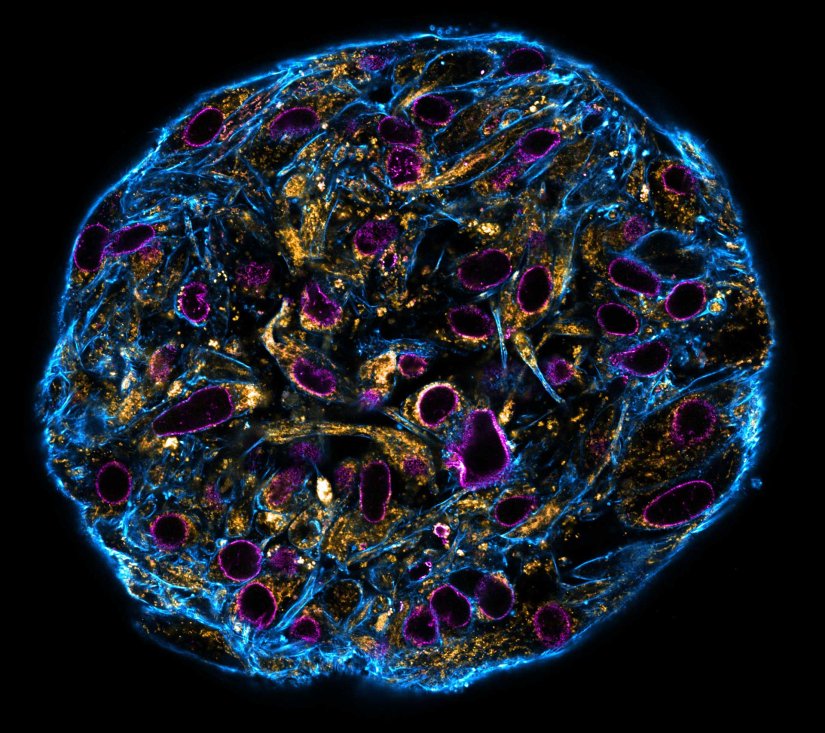
Confocal stitched image of a spheroid stained for nuclear pores (magenta), actin cytoskeleton (blue), and mitochondria (orange).
NIH-313 spheroid, fixed with 4% PFA, kindly provided by ibidi and prepared on µ-Slide VI 0.4 µ-Pattern ibiTreat.
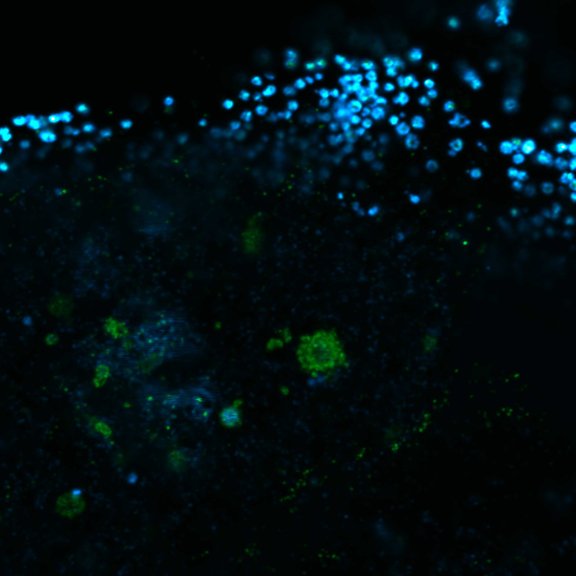
Description
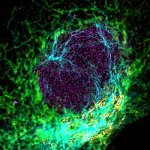
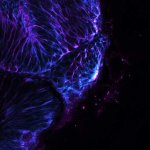
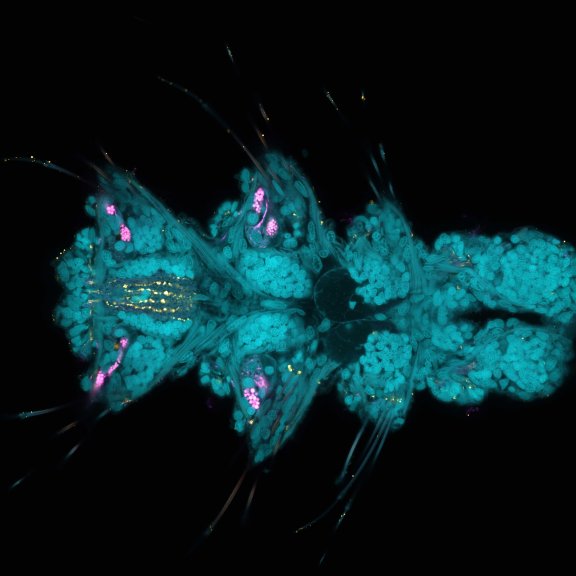
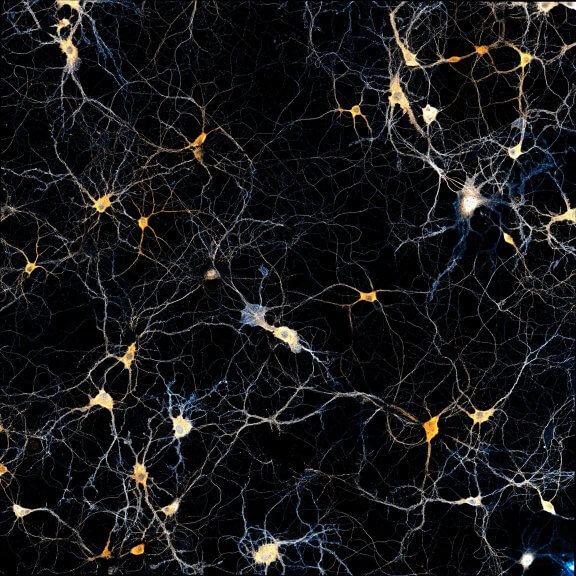
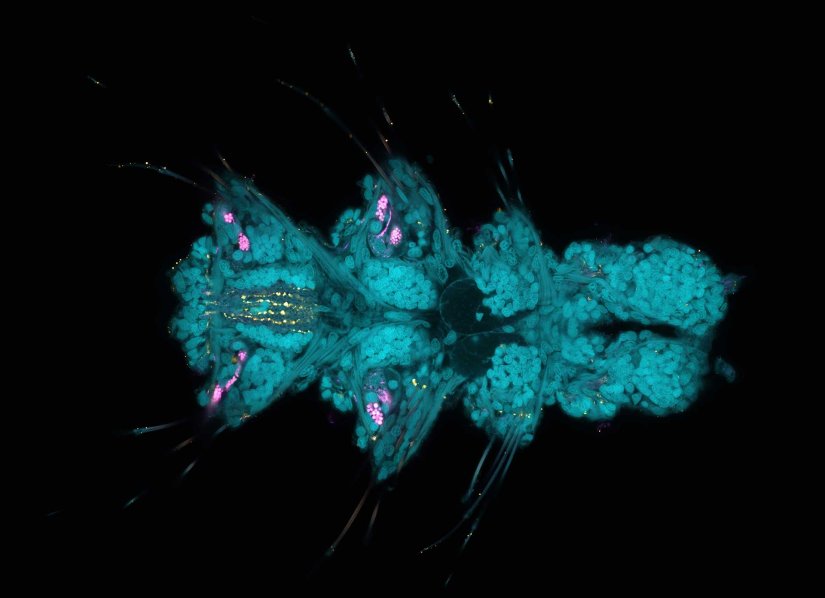
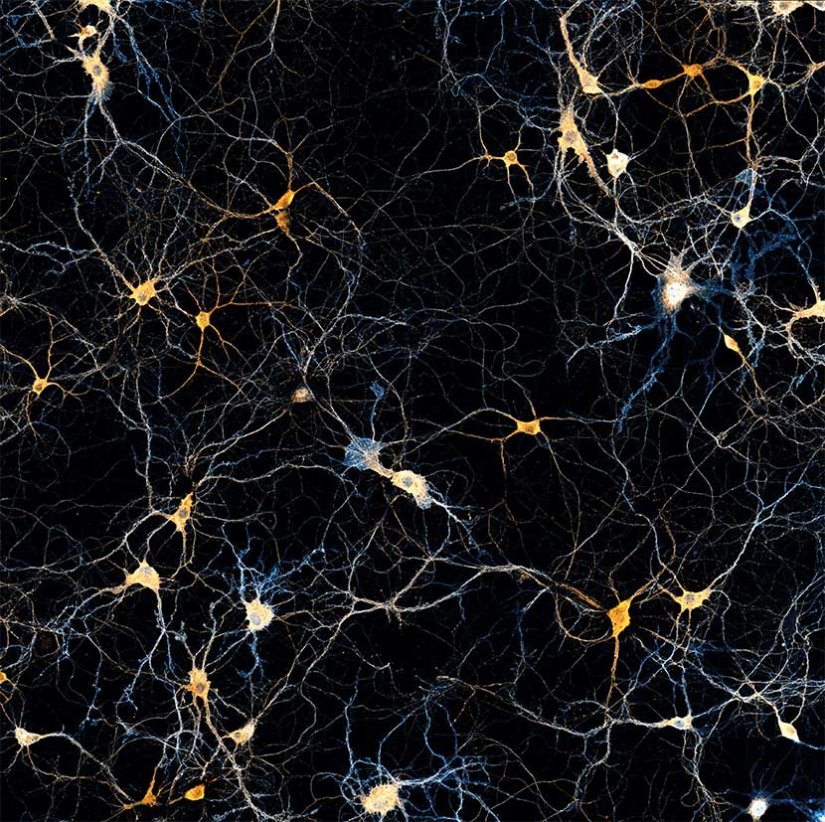
Larva of Platynereis dumerilii acquired in a confocal overview. Nuclei are shown in cyan (DAPI), tubulin in magenta, and serotonin-positive neurons in yellow.
Description
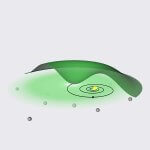
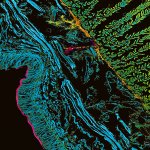
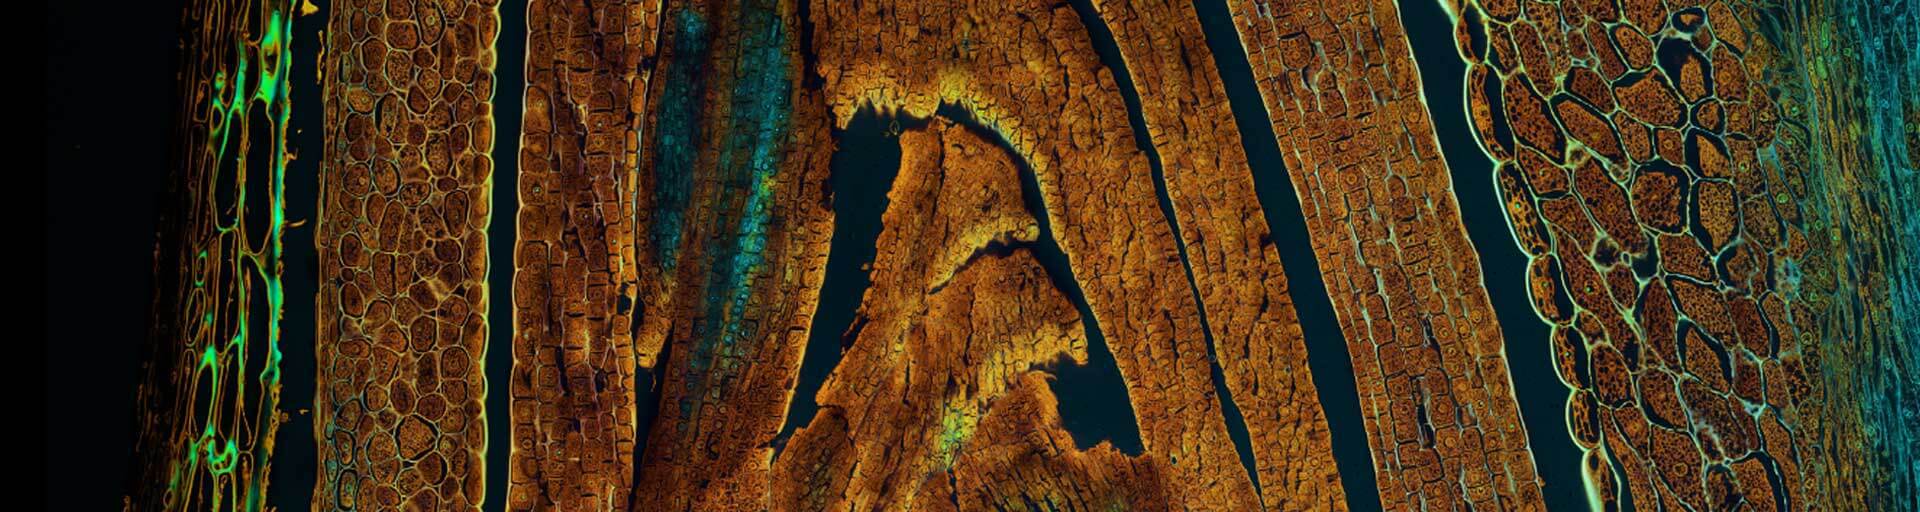
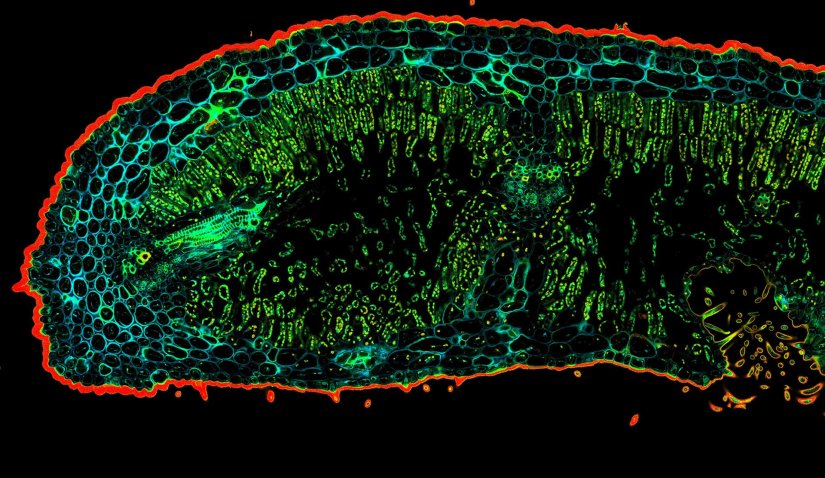
Confocal TIMEBOW acquisition of an Oleander leaf tip showing a range of autofluorescence lifetimes originating from different tissue components.
Description
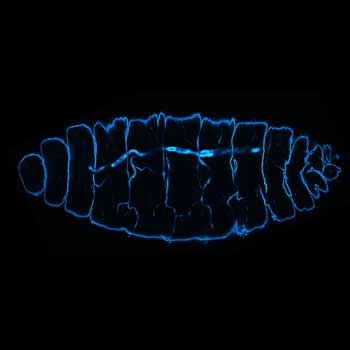
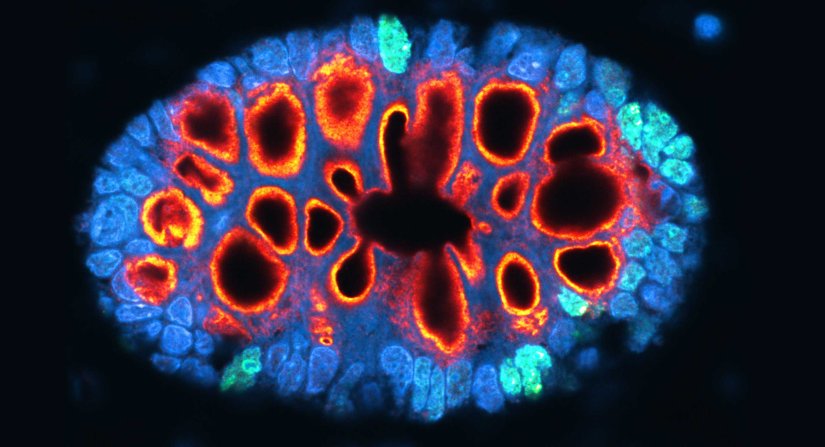
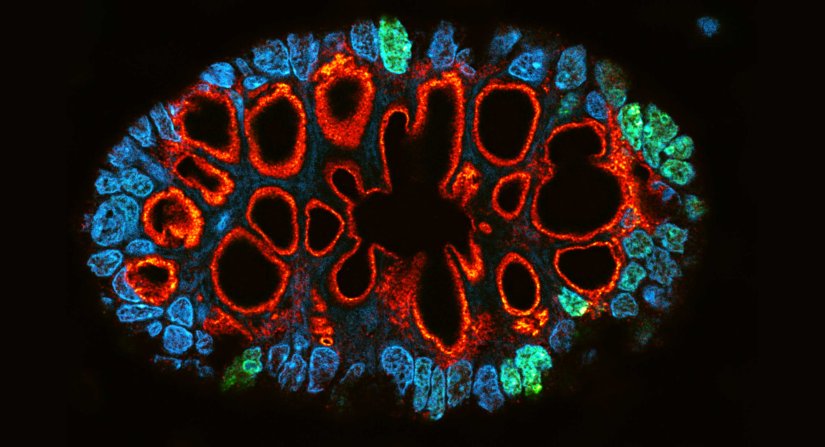
3 color confocal image of a Drosophila embryo stained for chitin (abberior STAR RED, cyan), tubulin (abberior STAR ORANGE, magenta), and DNA (PicoGreen, green).
Description
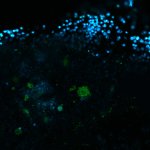
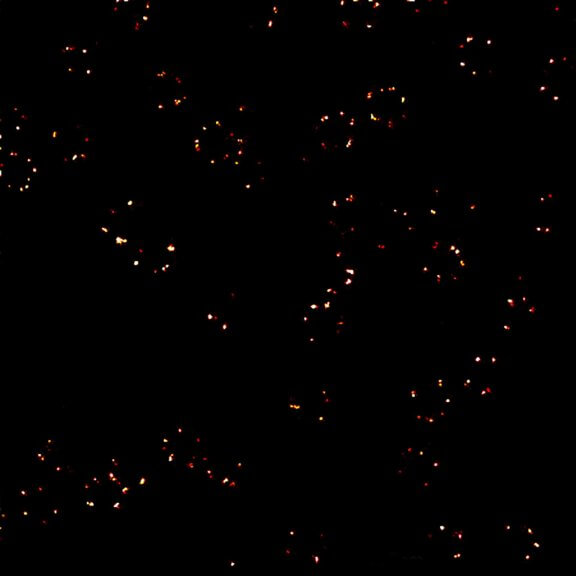
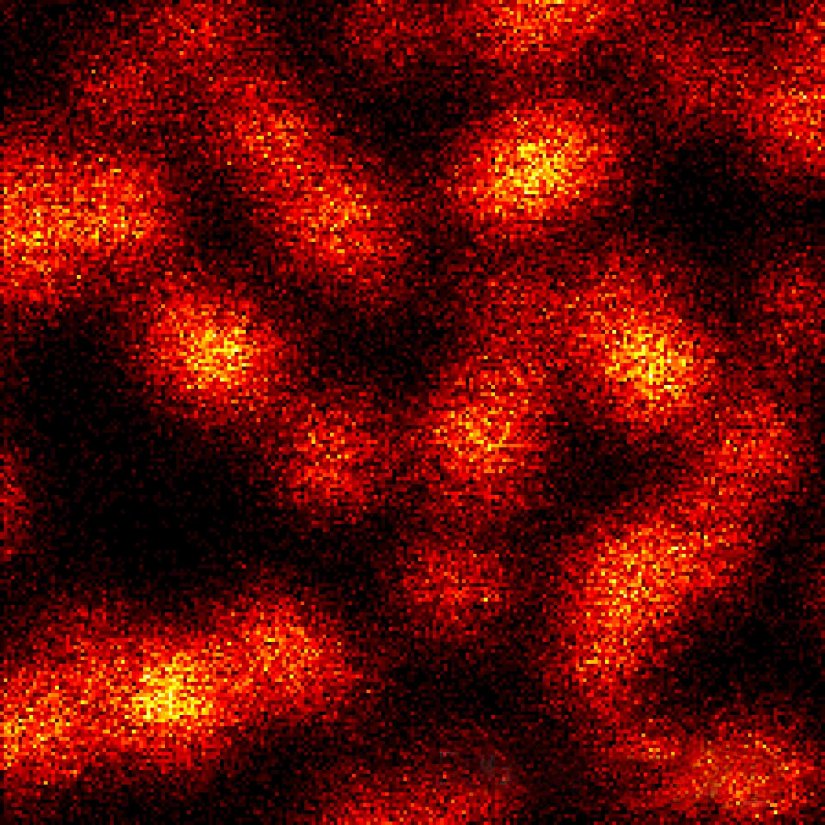
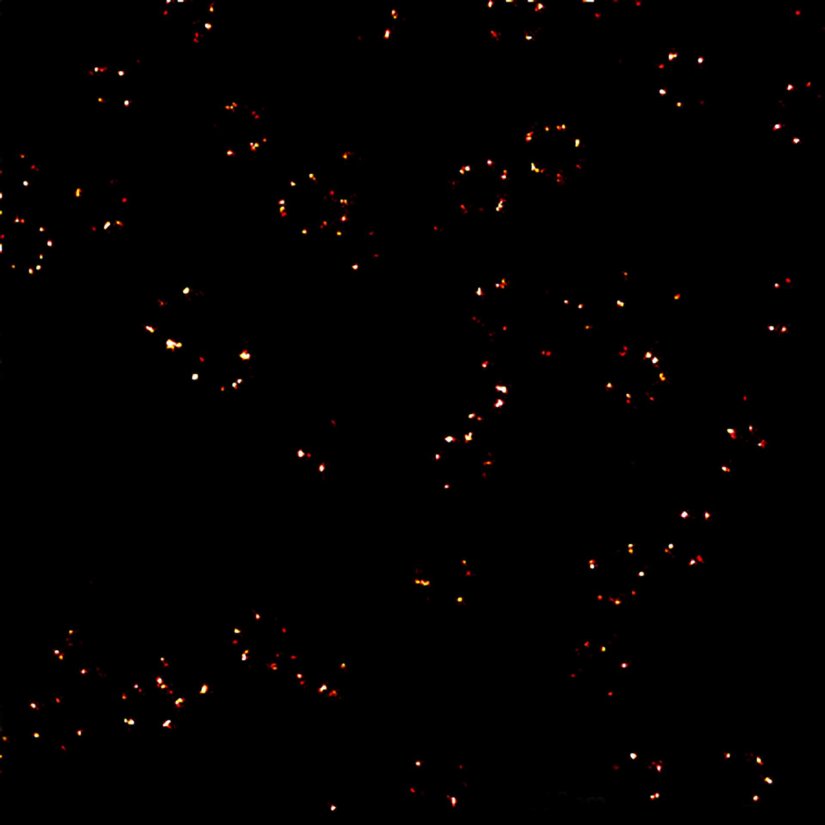
Human cytomegalovirus particles in infected human foreskin fibroblasts, labeled for a viral glycoprotein (abberior STAR RED, blue) and a tegument protein (abberior STAR 580, green). The sample was 4x gel-expanded and imaged with STED.

Description
PFA-fixed mammalian cell stained by using Smart Secondaries® from NanoTag Biotechnologies. Stained structures are intermediate filaments (cyan, abberior STAR 460L), mitochondria (green, abberior STAR GREEN), golgi (orange, abberior STAR ORANGE) and nuclear pore complex (magenta, abberior STAR RED).
Description
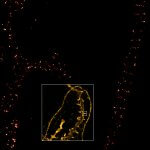
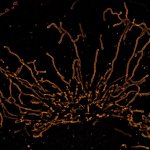
Dendrite with spines of a neuron grown on a coverslip, stained for βII spectrin and imaged in confocal mode and with the MINFLUX module of the MIRAVA POLYSCOPE.
Modules:

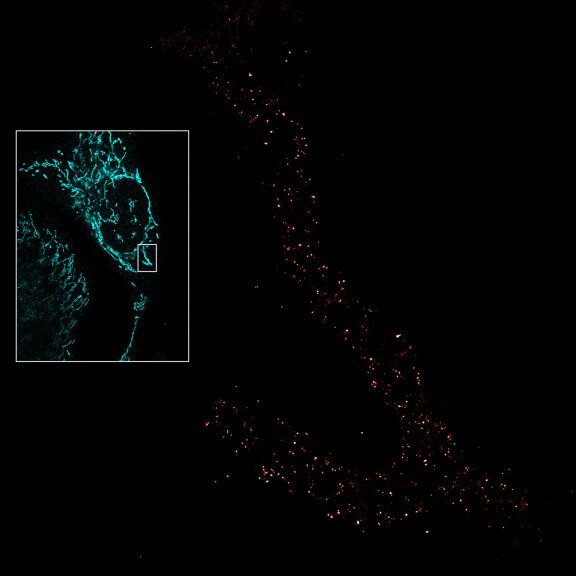
Description
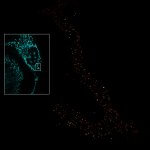
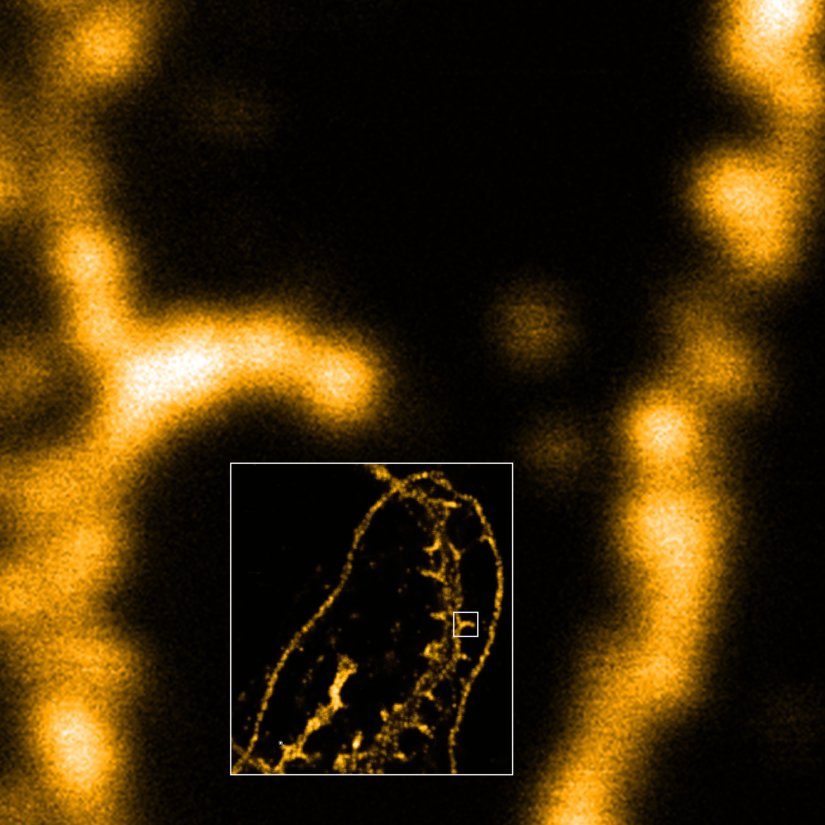
Mitochondria labeled for the outer membrane protein TOMM20, imaged in confocal mode and with the MINFLUX module of the MIRAVA POLYSCOPE.
Modules:
Description
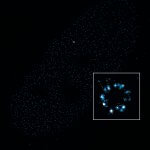
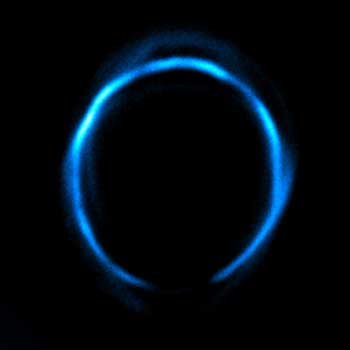
2D MINFLUX image of nuclear pore complex subunits, imaged in fixed mammalian cells expressing GFP-tagged NUP96 stained with abberior DNA-PAINT 660. The molecular resolution of the MINFLUX module of the MIRAVA POLYSCOPE allows visualizing the shape and arrangement of individual subunits of the nuclear pore complex.
Modules:
Description
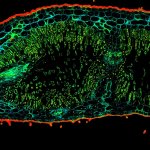
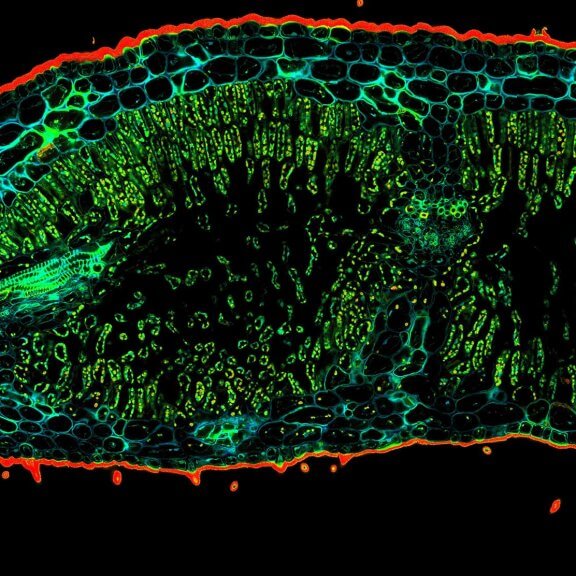
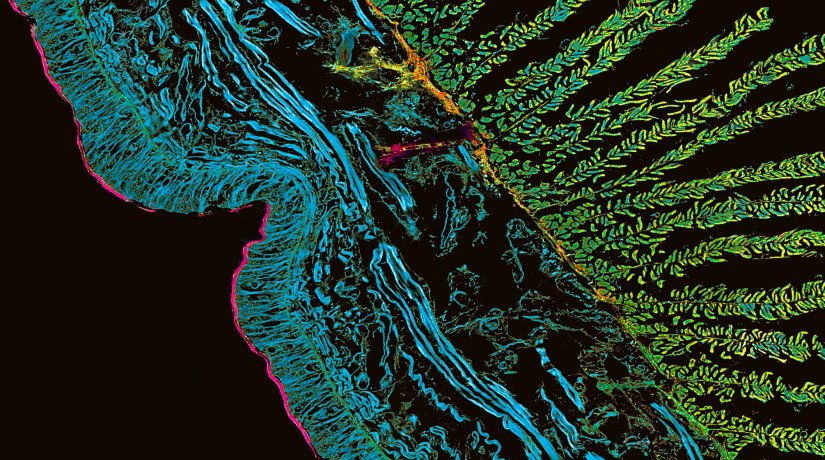
Confocal image of autofluorescence in a cross-section of the earthworm Lumbricus terrestris. TIMEBOW lifetime imaging detects differences in fluorescence lifetime, which depend on the type of autofluorescent molecule and its nano-environment, and visualizes them in distinct colors.
Modules:
Description
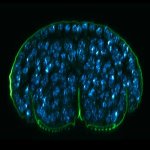
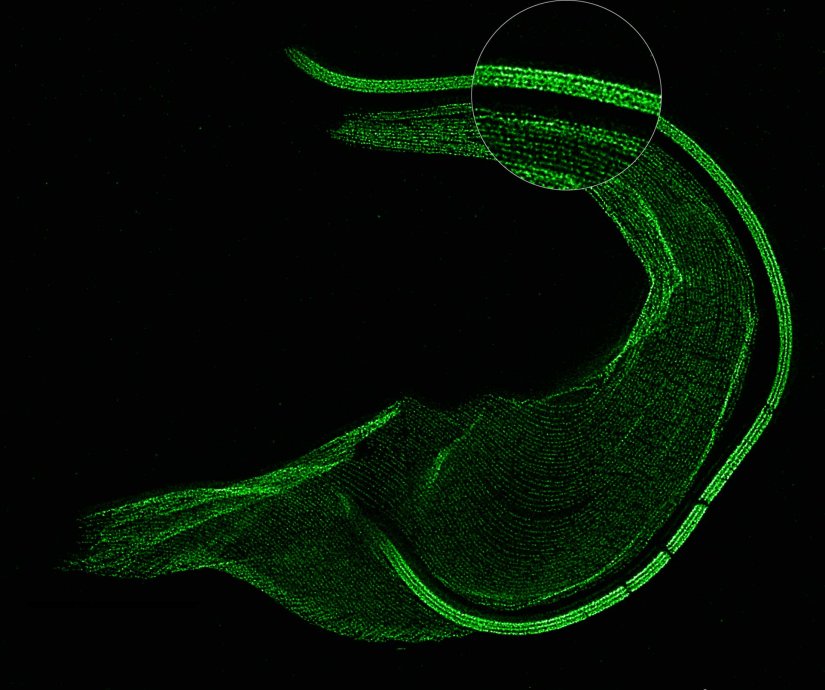
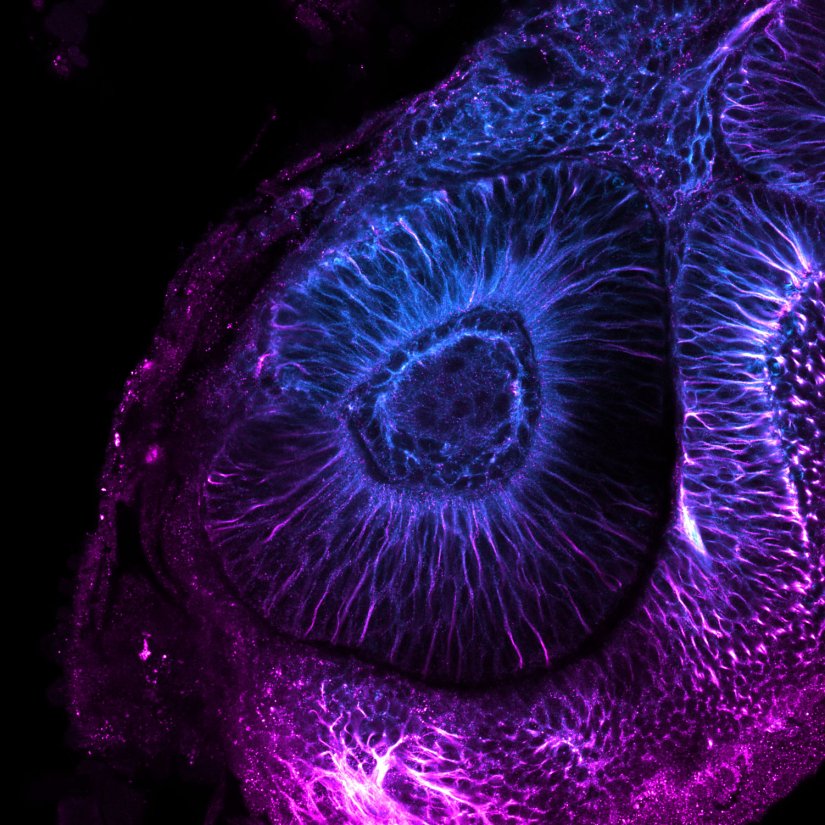
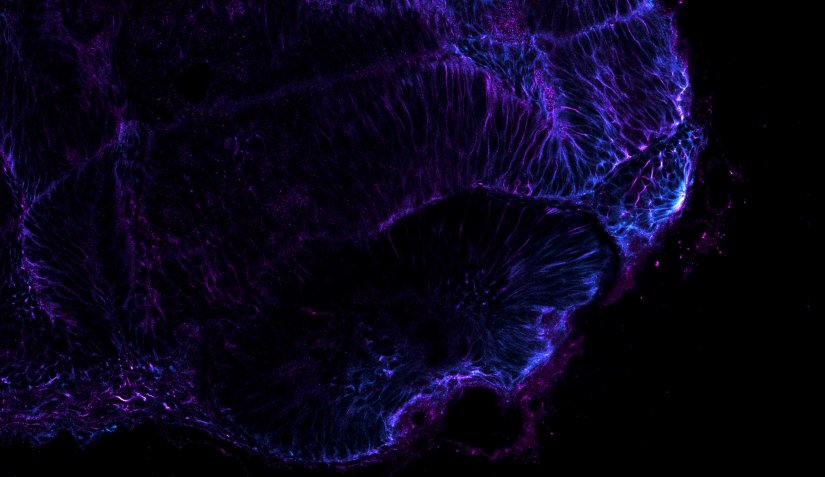
Confocal image of a developing zebrafish eye showing tubulin stained with abberior STAR RED and abberior STAR ORANGE.
Image courtesy of Graziamaria Paradisi, Marco Tartaglia, Antonella Lauri, Ospedale Pediatrico Bambino Gesù, Rome, Italy
Modules:

Description
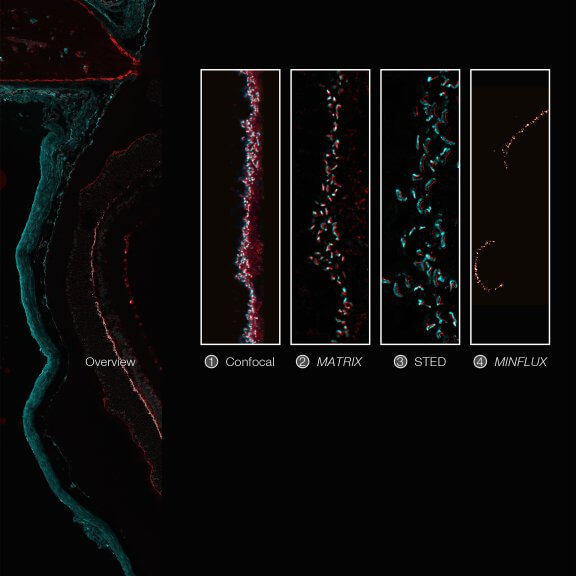
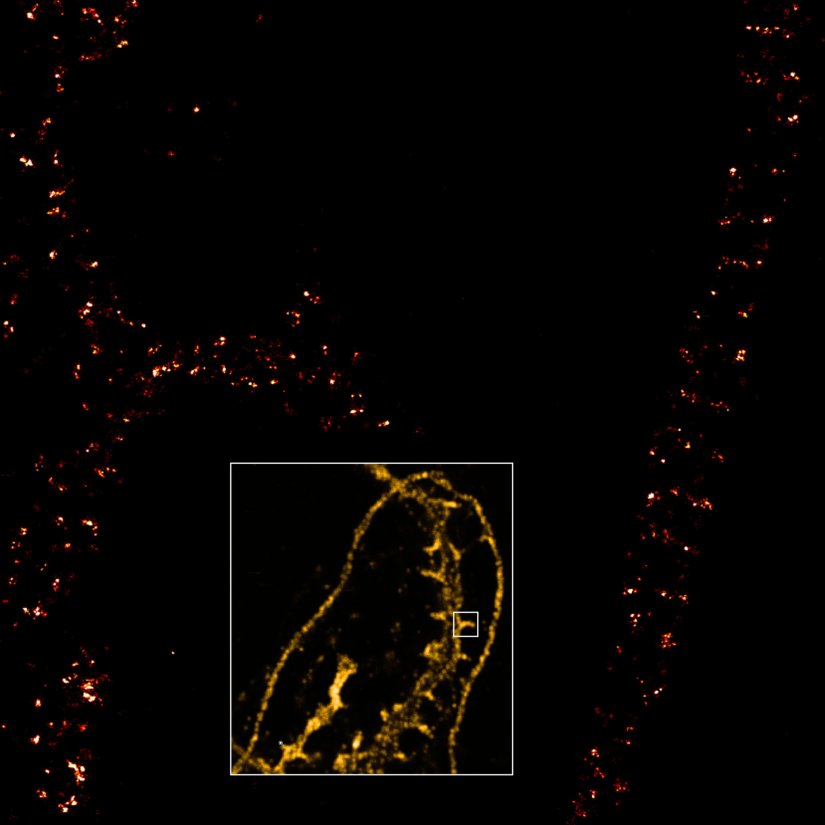
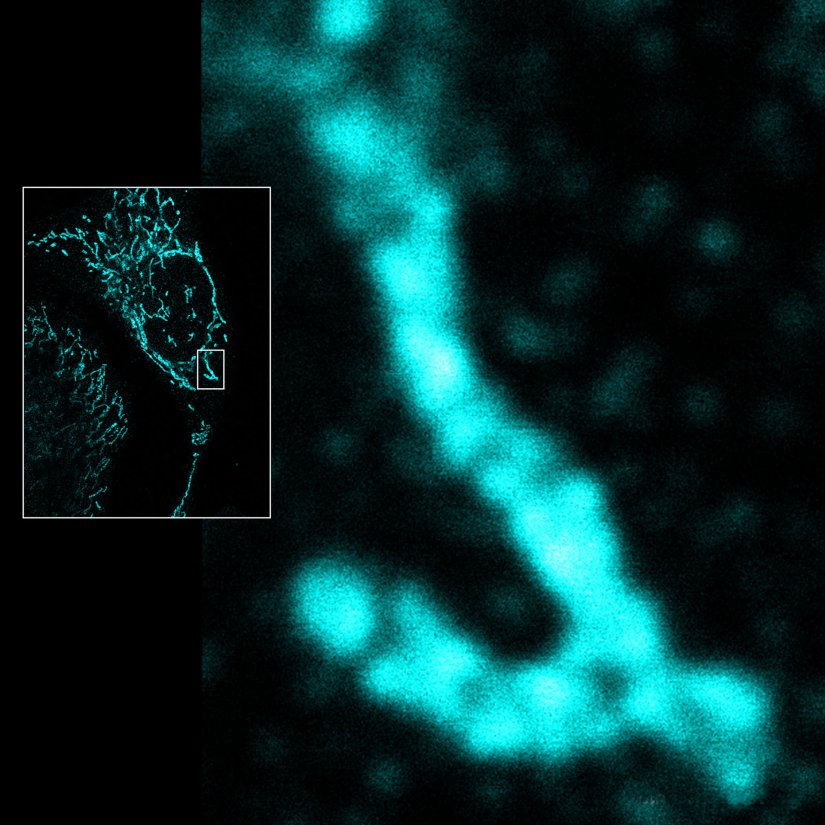
Imaging across scales from diffraction-limited to molecular resolution: ribbon synapses in fixed mouse retina tissue stained for VAMP1 (abberior STAR RED) and CtBP2 (abberior STAR ORANGE) (confocal, MATRIX, STED) or for Bassoon (MINFLUX).
Sample courtesy: Arlene Hirano, PhD, University of California Los Angeles, Los Angeles, CA, USA (confocal, MATRIX, STED), and by Dr. Chad Grabner and Prof. Dr. Tobias Moser, Max Planck Institute for Multidisciplinary Sciences, Göttingen, Germany (MINFLUX).
Modules:
Description
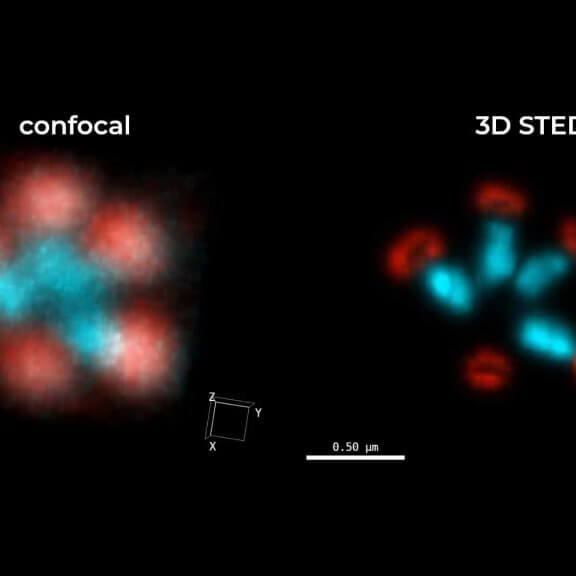
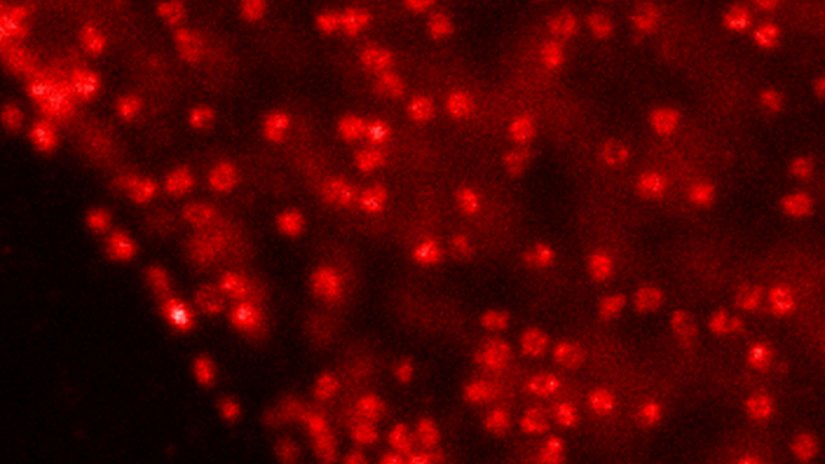
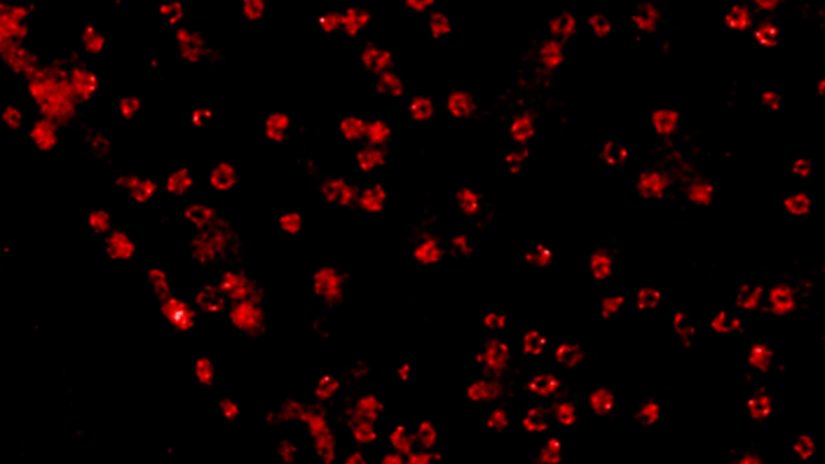
A confocal image compared to a MATRIX + TRUESHARP STED image of nuclear pore complexes in mammalian cells stained for NUP96 with abberior STAR RED.
Modules:
Description
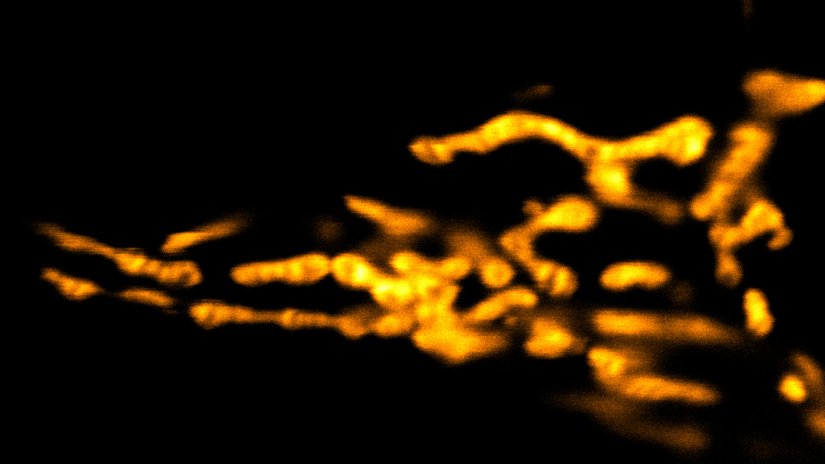
Living HeLa cells stained with the mitochondrial membrane marker abberior LIVE ORANGE mito, visualizing both outer and inner membranes. Confocal and STED images where deconvolved with TRUESHARP image boosting.
Modules:
Description
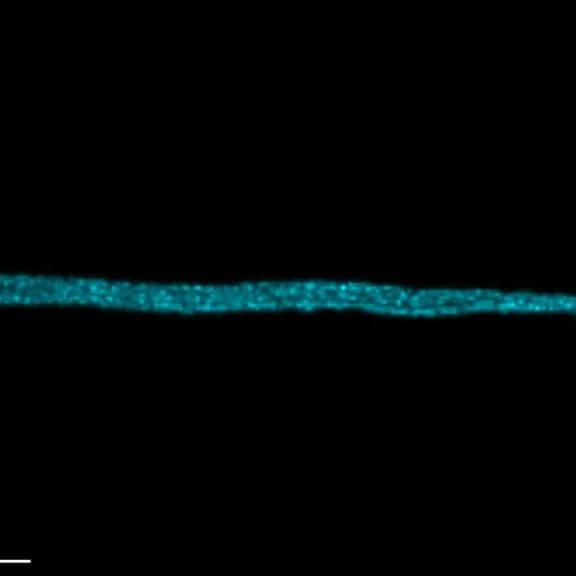
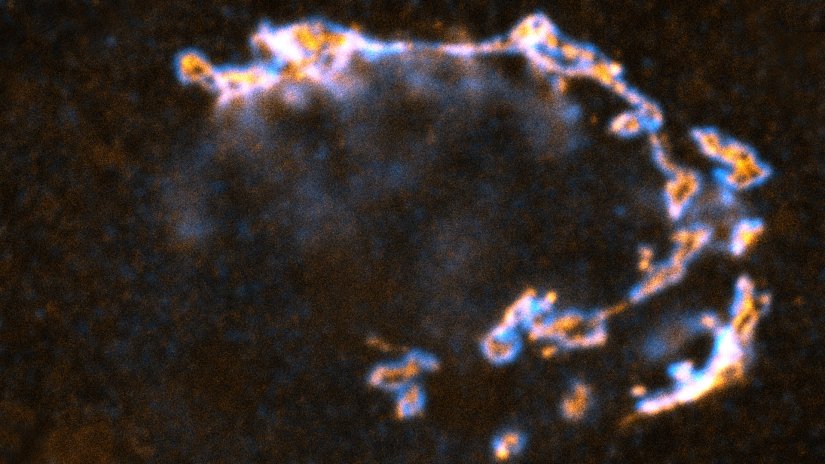
Confocal and STED image of a meiotic cell of Chinese spring wheat stained for two synaptonemal complex components.
Sample courtesy: Sepsi Adél, HUN-REN, Centre for Agricultural Research, Martonvásár, Hungary.
Modules:

Description
STED image of the golgi apparatus in a fixed mammalian cell, recorded with MATRIX array detection and deconvolved with TRUESHARP image boosting. Stained are the golgi proteins GM130 (cyan, abberior STAR RED) and giantin (orange, abberior STAR ORANGE).
Modules:
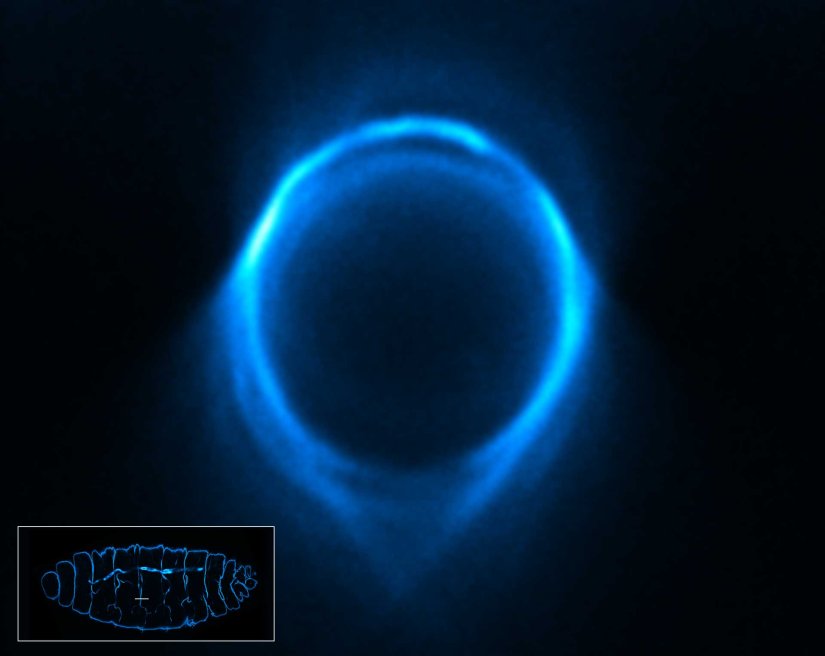
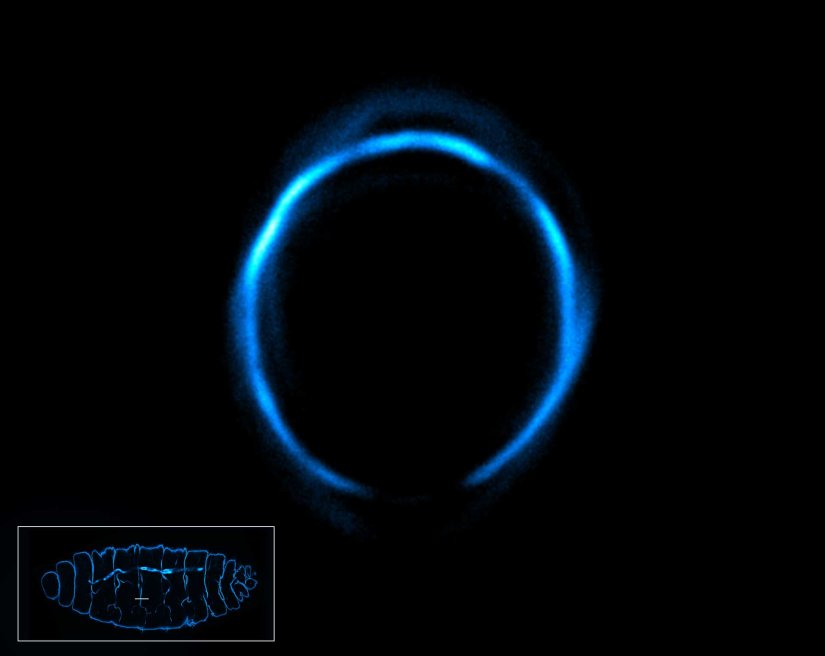
Description
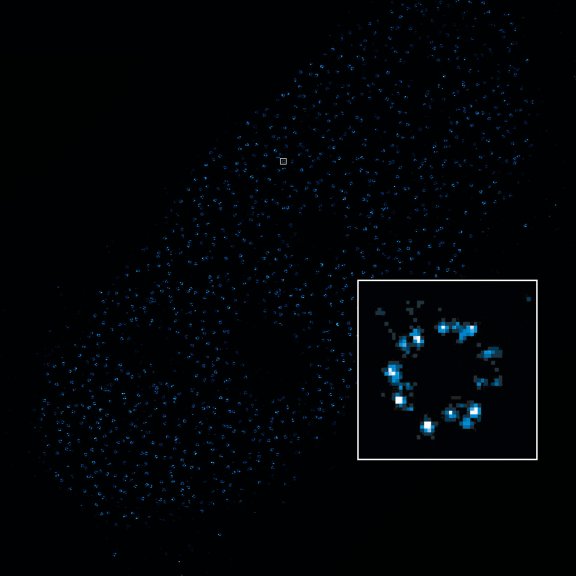
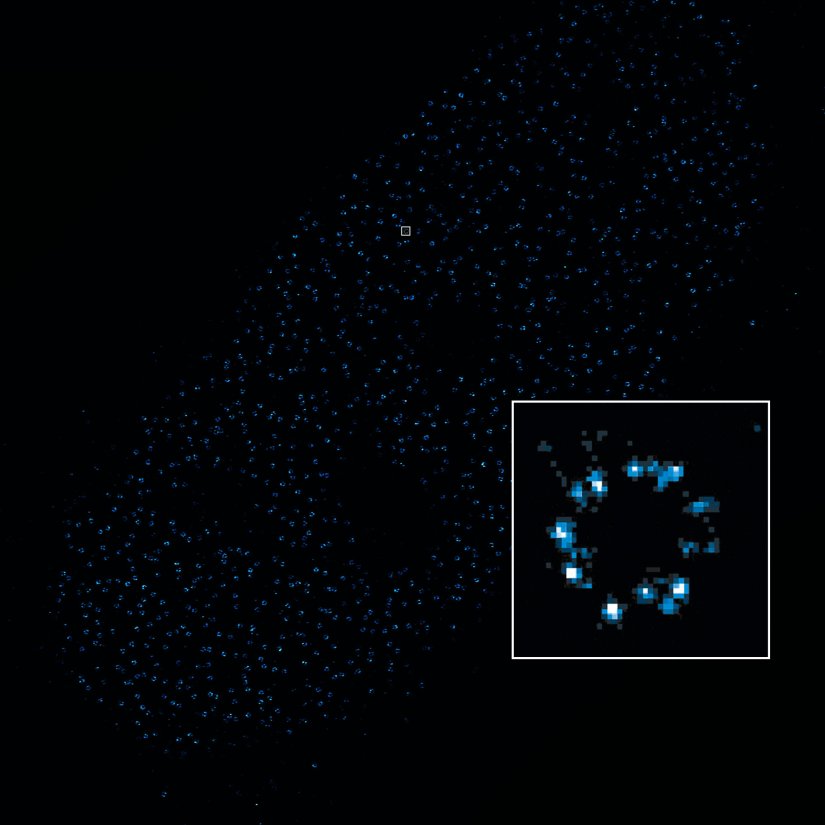
2D MINFLUX nanoscopy of the nuclear pore complex subunits, labeled with abberior FLUX 647 conjugated to JIR AffiniPure-VHH Fragment antibodies (secondary nanobodies). In contrast to confocal microscopy, 2D MINFLUX allows visualization of the shape and arrangement of individual nuclear pore complex subunits. Here, we reach localization precisions of ~ 2 nm in raw localization data.
Description
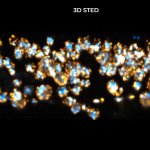
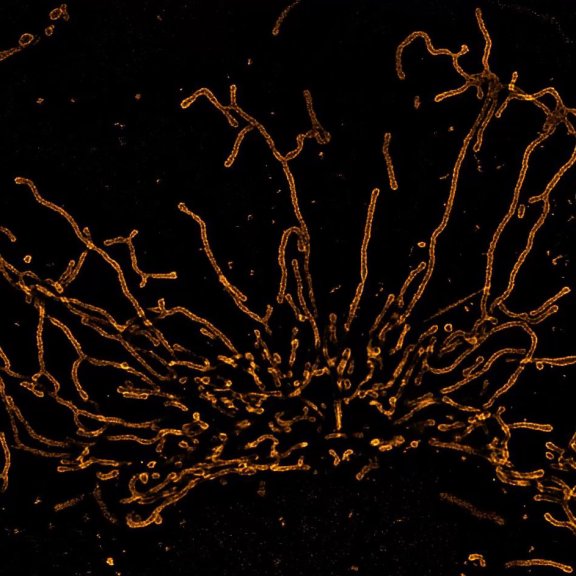
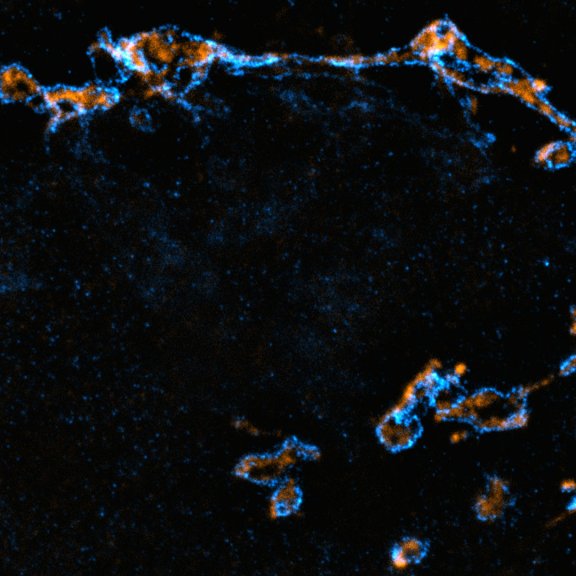
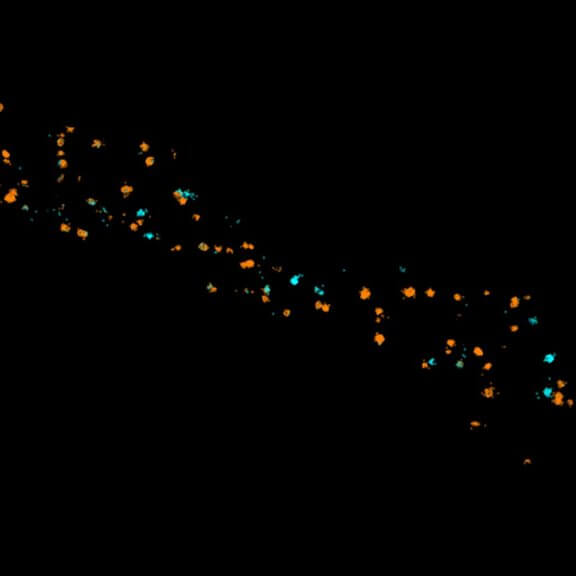
Two-color 3D MINFLUX revealing an inner and outer mitochondrial membrane marker. Cultured mammalian cells labeled with indirect immunofluorescence using JIR AffiniPure-VHH Fragment antibodies (secondary nanobodies) coupled to abberior FLUX 640 (orange) and FLUX 680 (cyan). MINFLUX enables the visualization and separation of both structures.
Description
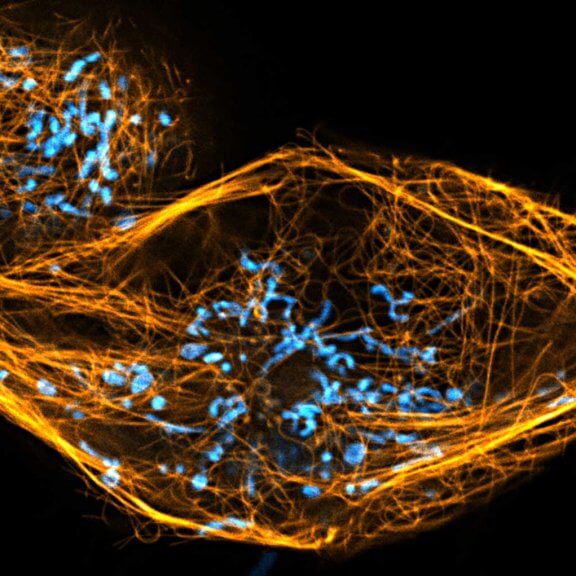
Two color live-cell confocal and STED image of a mammalian cell directly labeled with abberior LIVE 510 mito (cyan), and LIVE RED tubulin. This image was acquired with a STEDYCON microscope.
Description
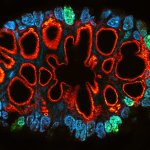
Paraffin section of gut biopsy stained for Ki67 (abberior STAR ORANGE), Muc2 (abberior STAR RED), and DAPI.
Modules:
Description
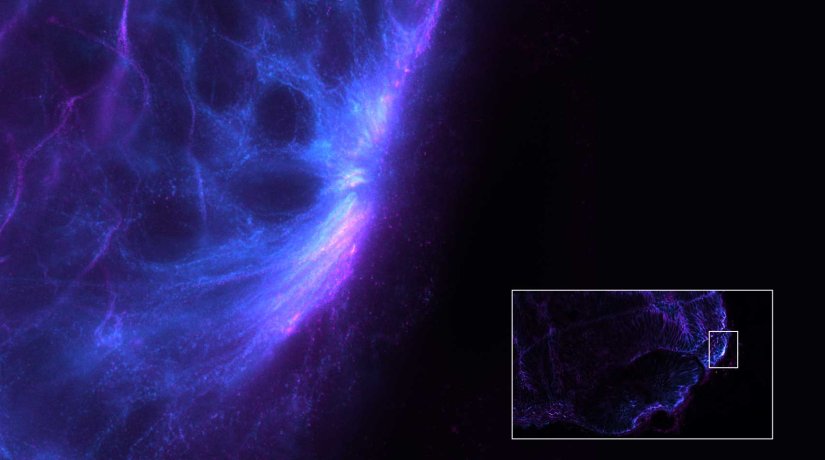
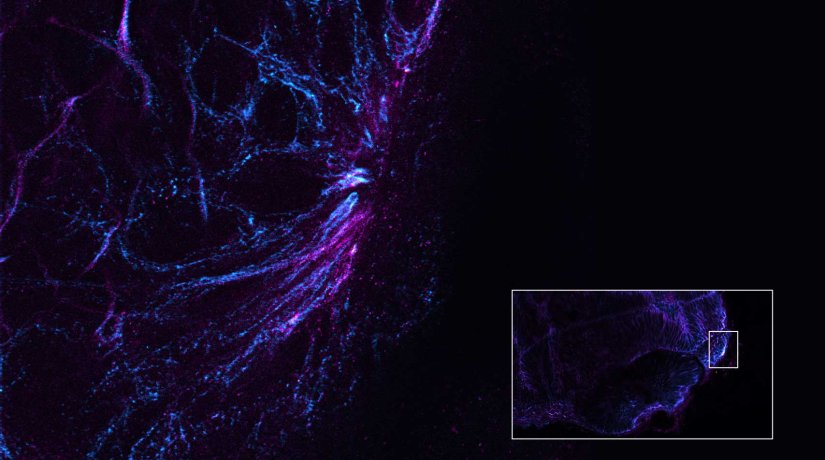
Gain in both signal-to-background ratio and resolution: MATRIX detection dramatically improves a conventional STED image of the zebrafish olfactory epithelium, resulting in a perfect and crystal-clear image revealing even more detail than STED alone can.
Modules:
Description
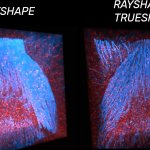
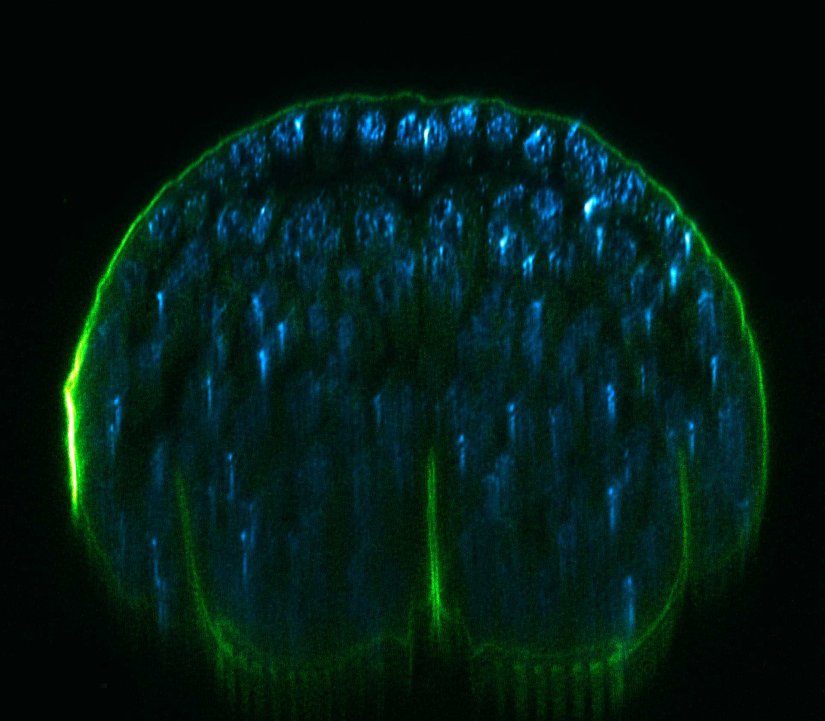
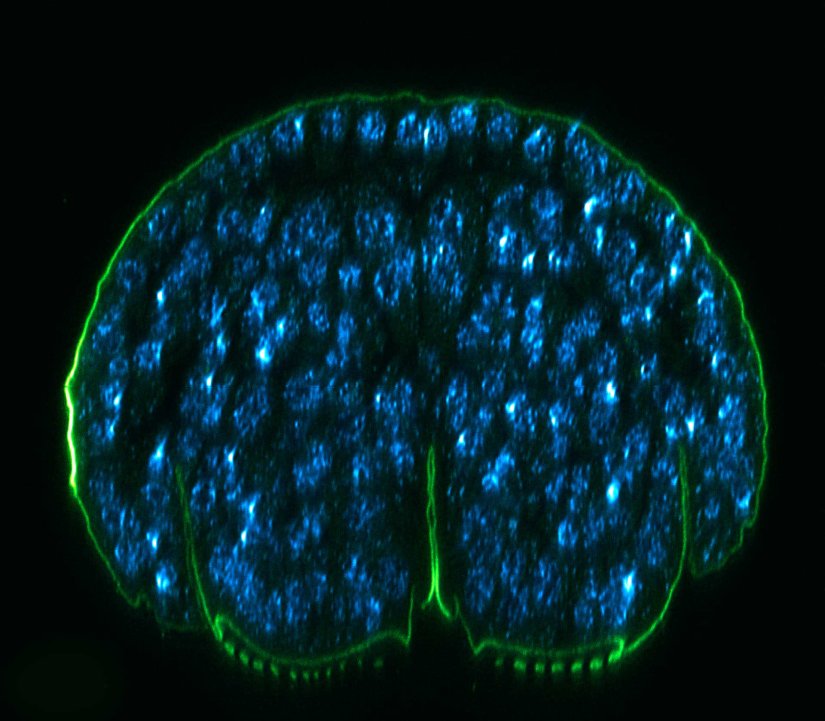
xz section of a stage 17 Drosophila embryo stained for chitin (abberior LIVE 610, green) and DNA (abberior LIVE 550, cyan).
RAYSHAPE preserves resolution and brightness over the whole sample depth of about 200 µm by dynamically redirecting aberrated light to the right places.
In comparison, mechanical optics using a correction collar can only correct a limited z-range of approximately 20 µm
Modules:
Description
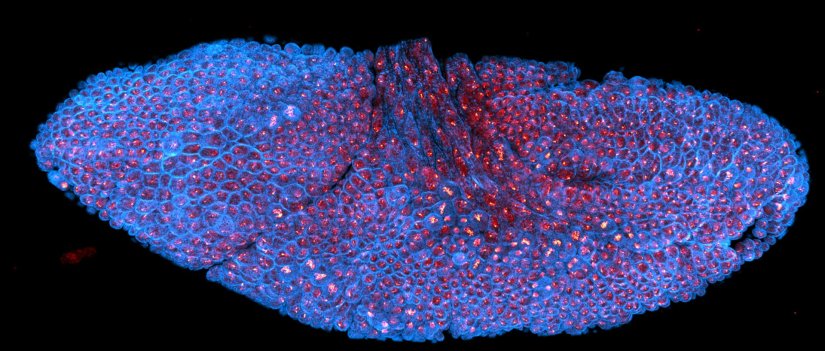
Drosophila stage 12 embryo, imaged with RAYSHAPE, stained for tubulin with abberior STAR RED and for DNA with abberior LIVE 550.
Modules:
Description
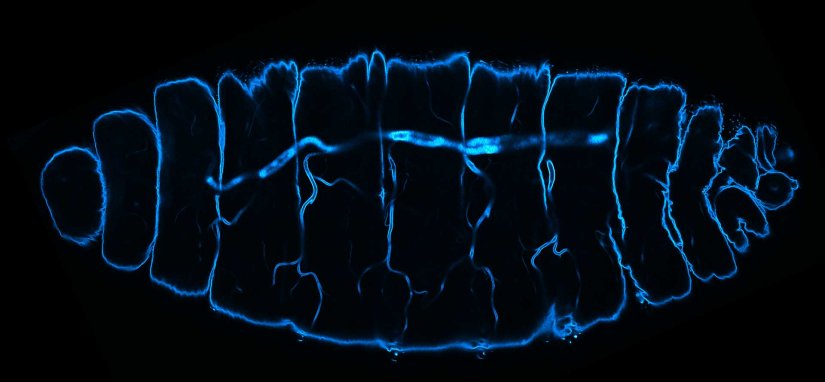
Deep tissue imaging with RAYSHAPE of a stage 17 Drosophila embryo stained for chitin with abberior LIVE 610.
Modules:
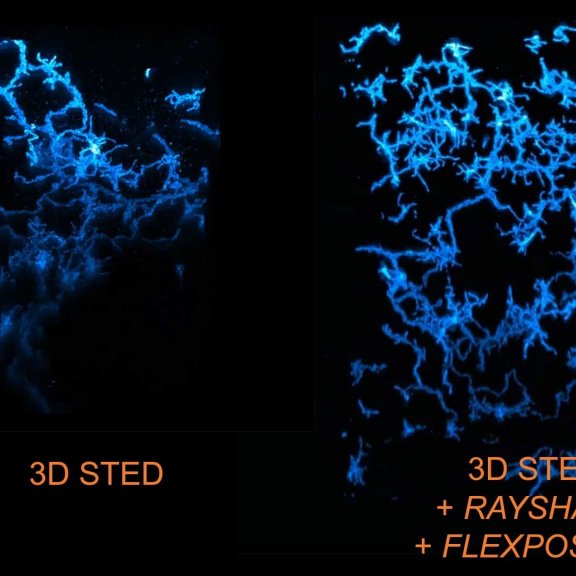
Description
3D STED xz section of a Drosophila embryo trachea, imaged with RAYSHAPE and without abberation correction, depth 15 µm. Chitin was stained with abberior LIVE 610.
Modules: