

Sample gallery
Fluorescence imaging, whether at confocal, STED or MINFLUX resolution, guarantees unique insights into the function and structure of life at the molecular level. Besides the scientific information content, some sample portraits provide simply beautiful images. Enjoy browsing our sample gallery.
the fine art of science

Description
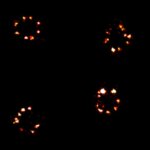
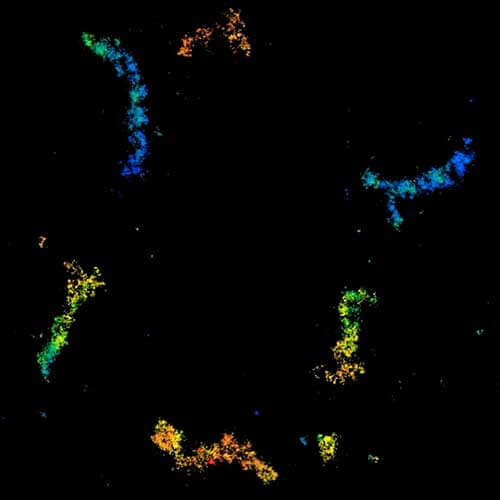
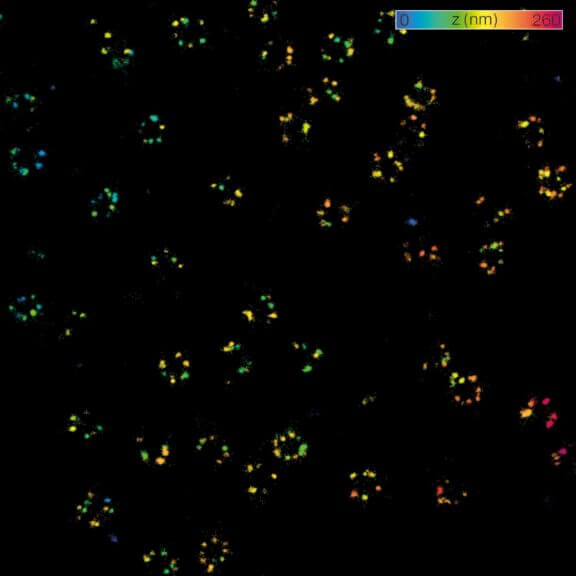
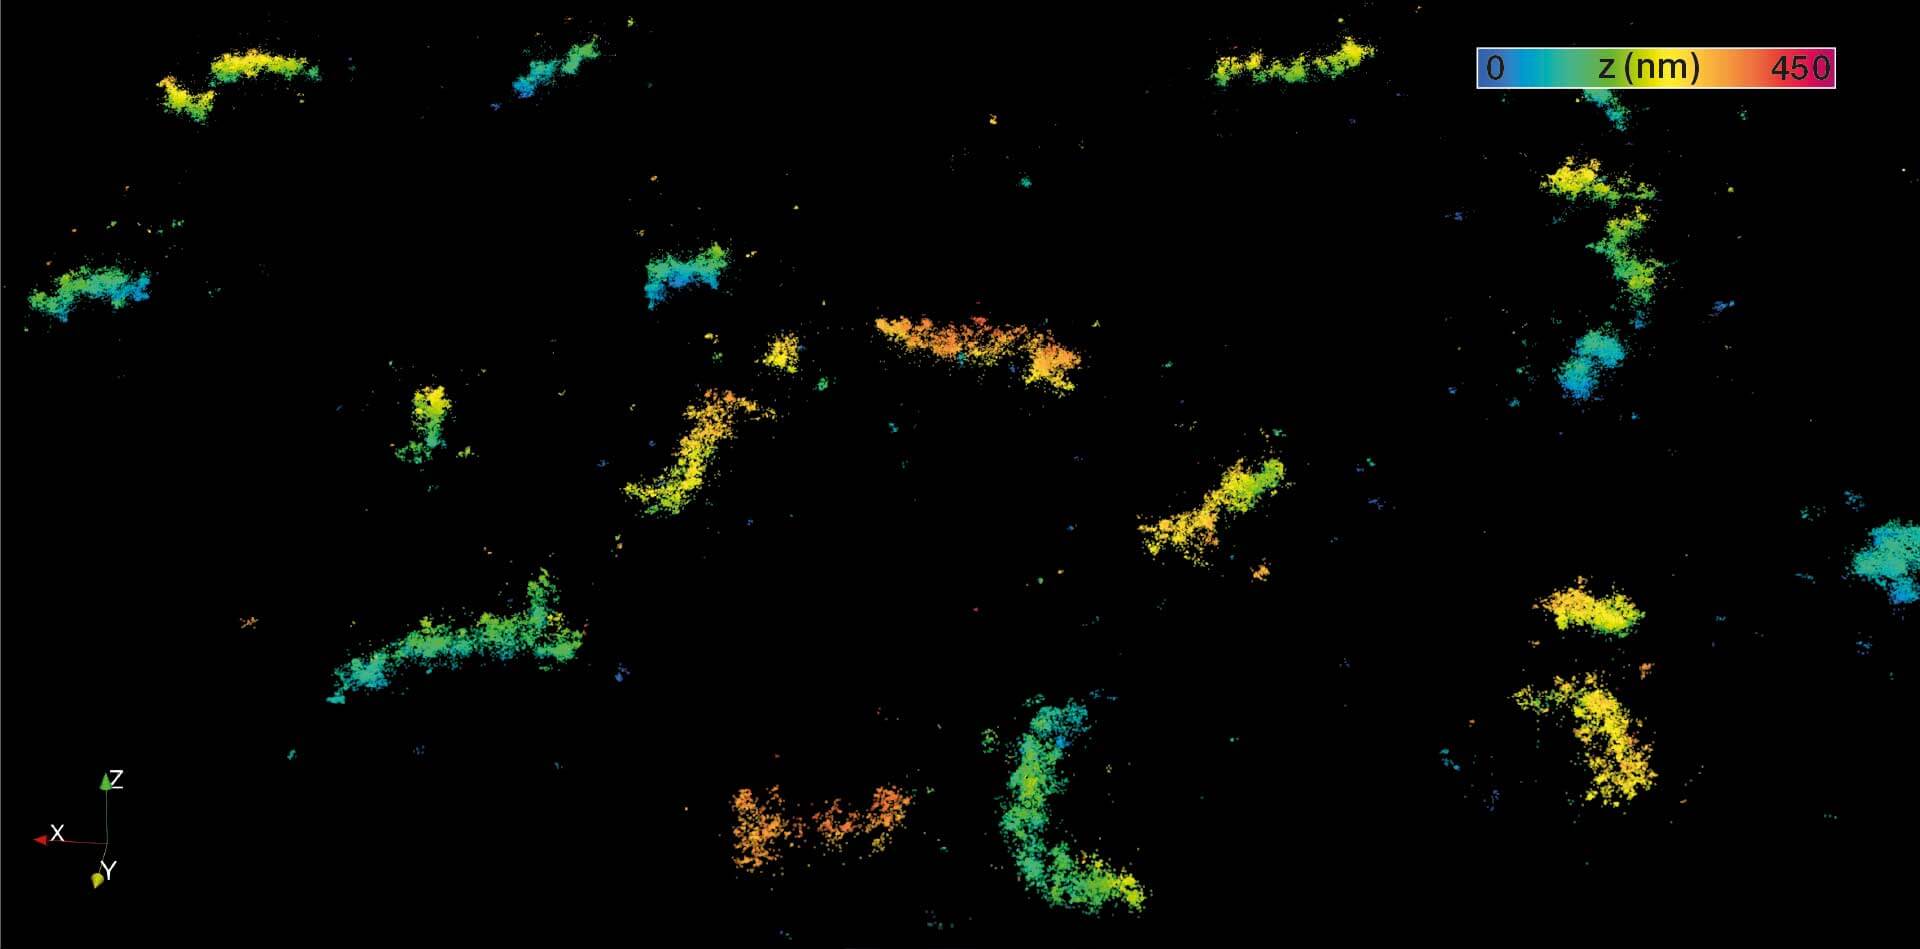
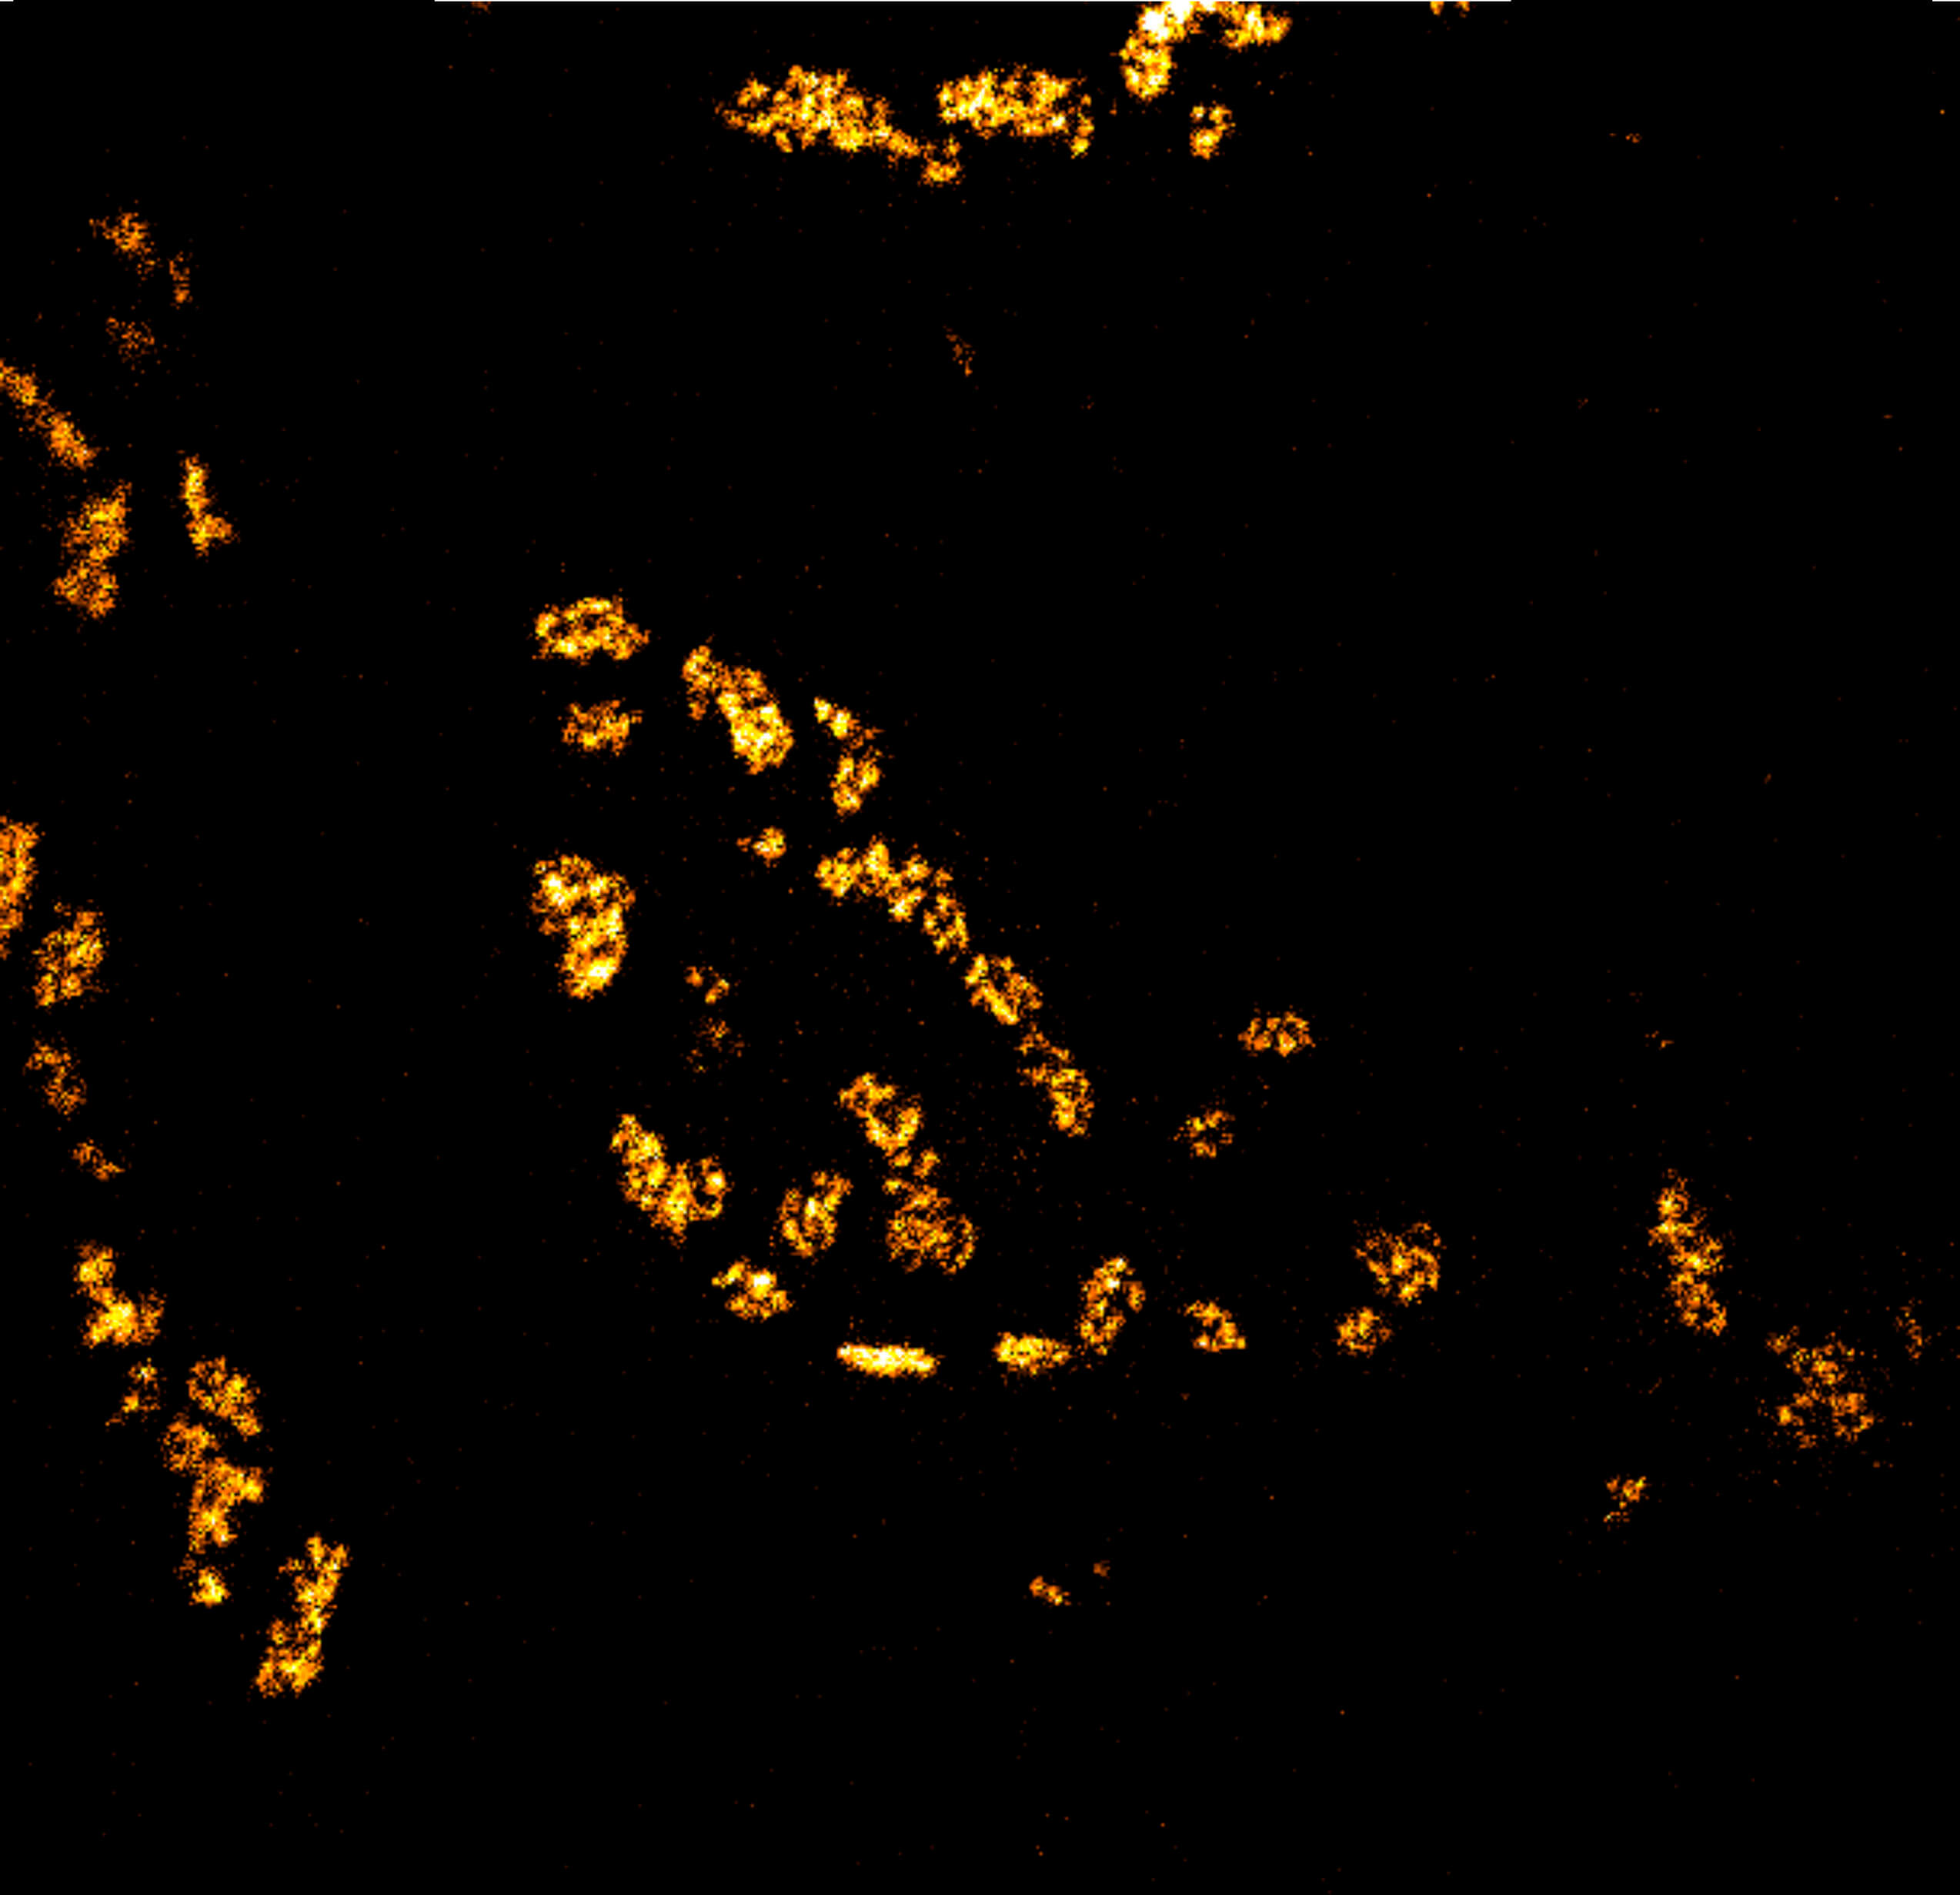
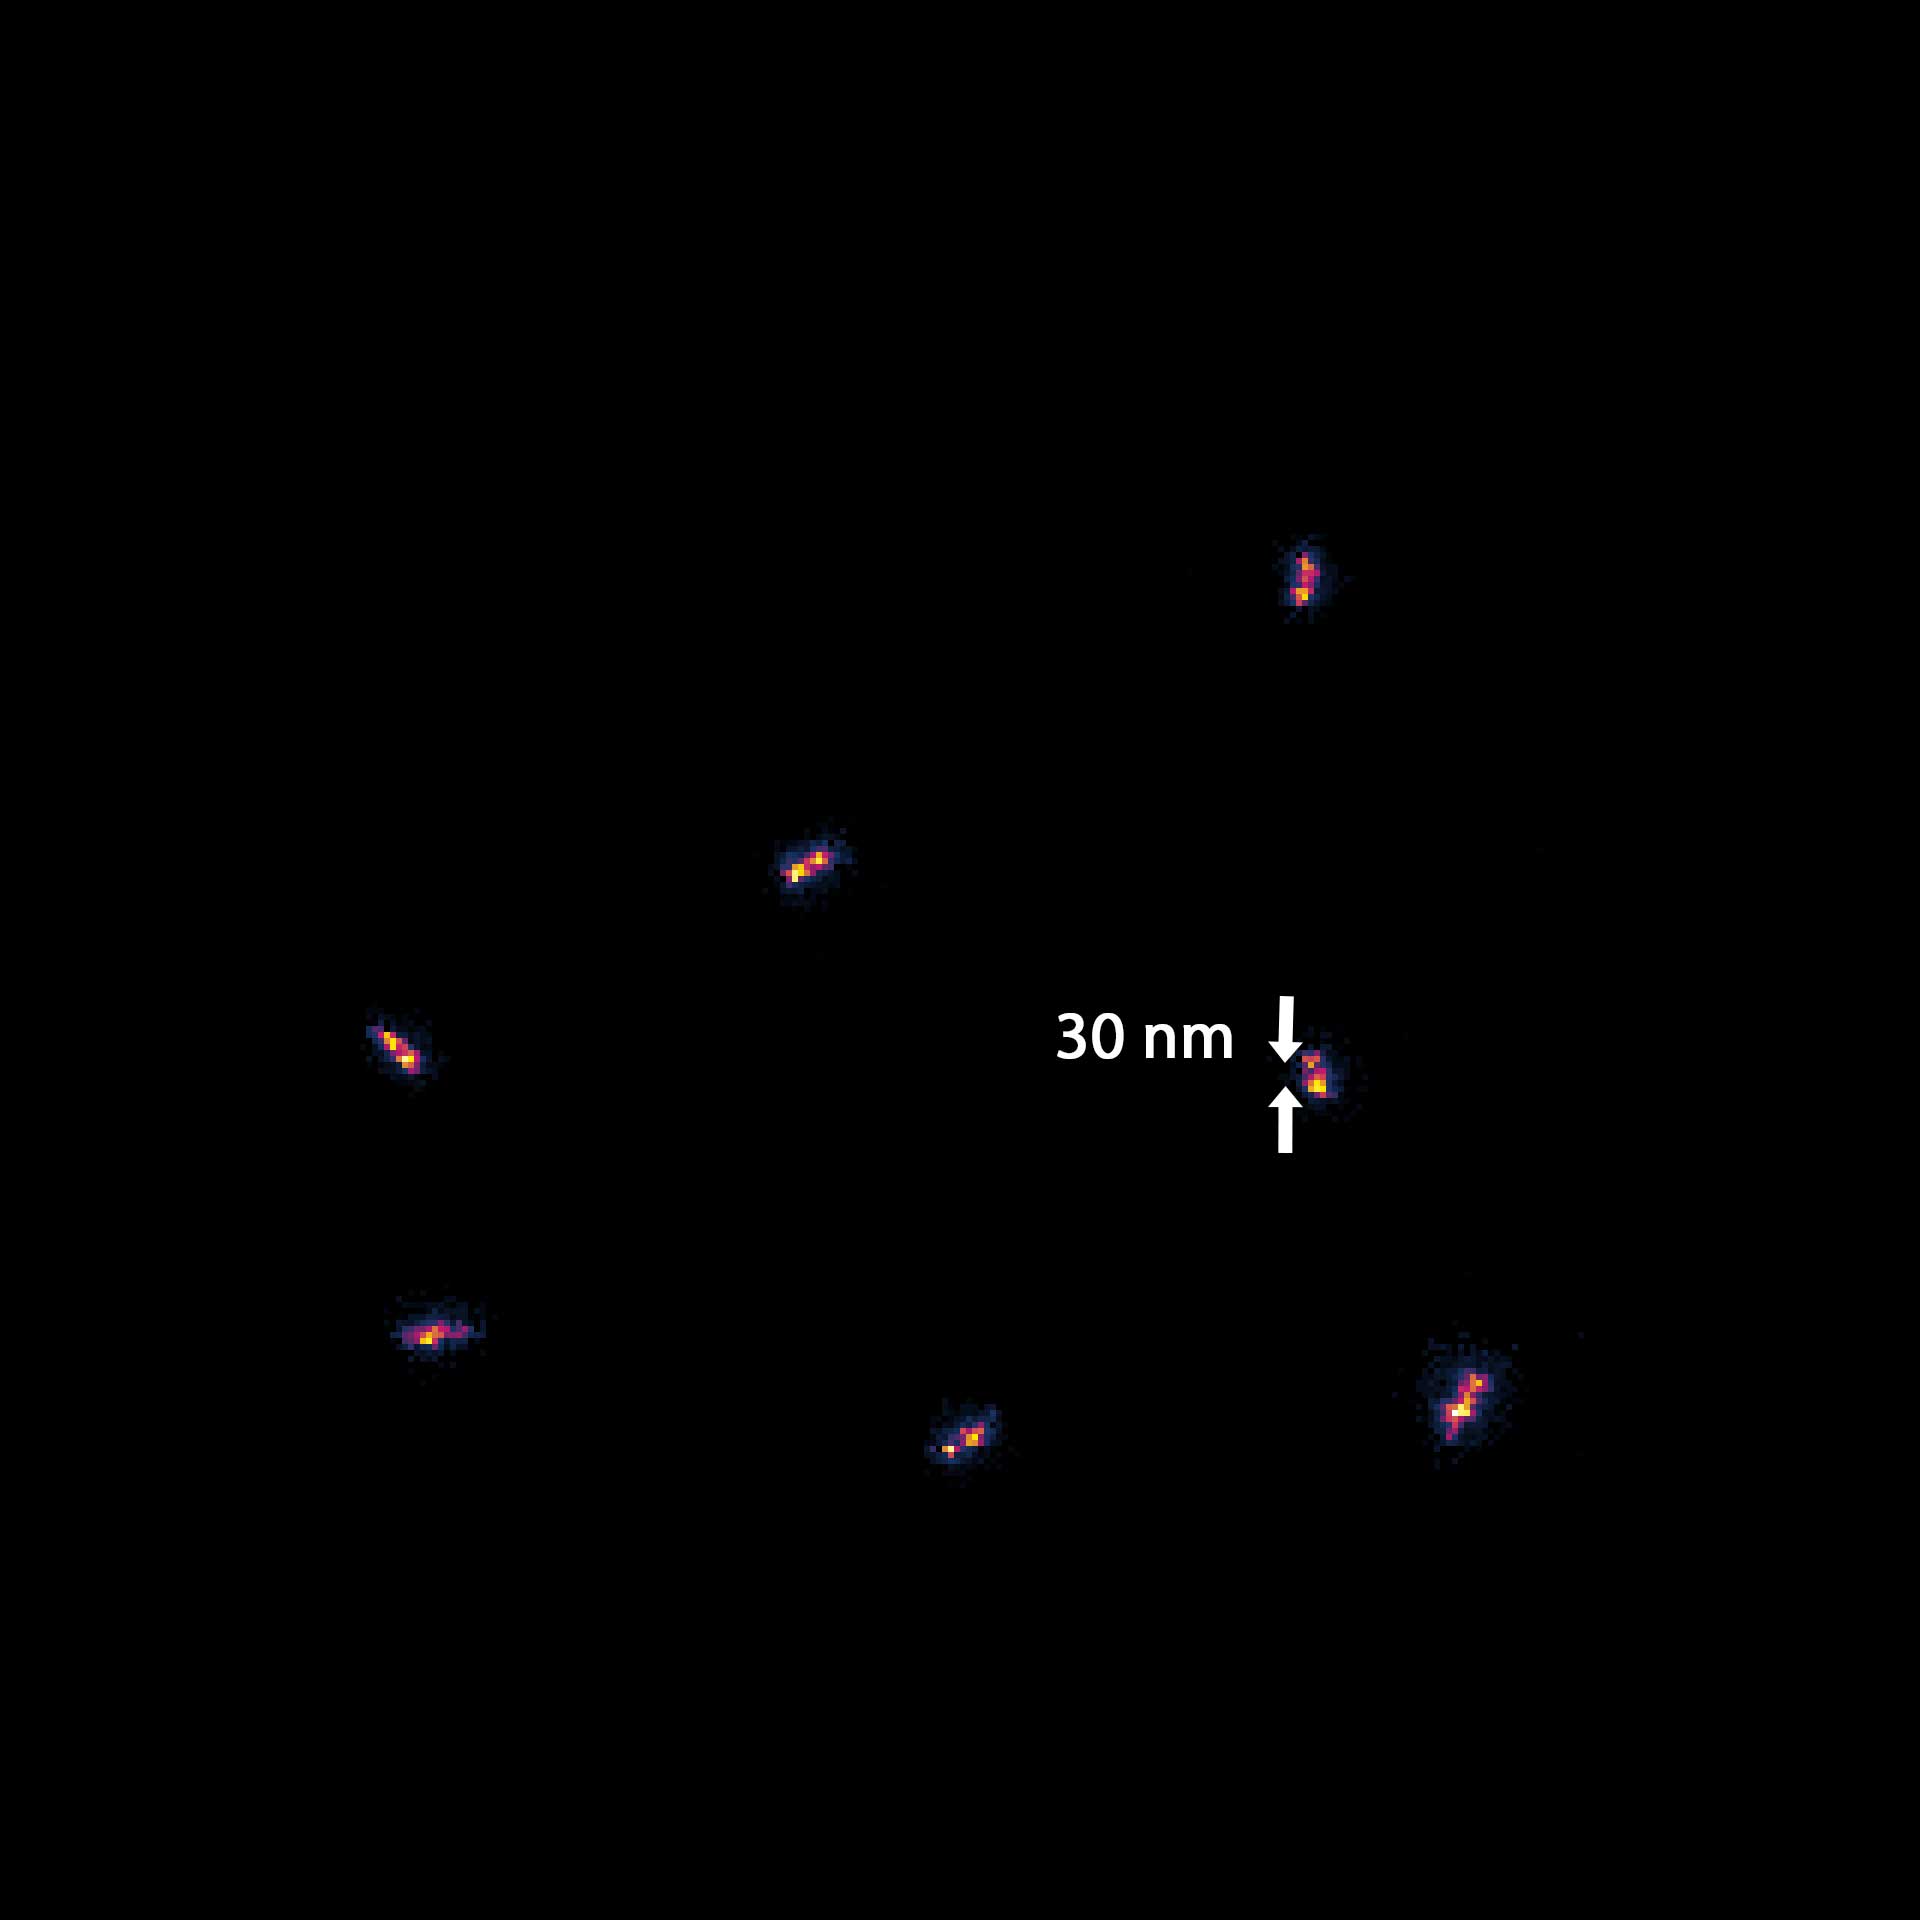
MINFLUX 3D on nuclear pore complexes. Localization precision is better than 3 nm along all directions
Description
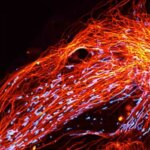
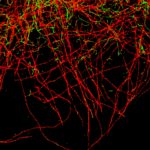
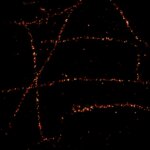
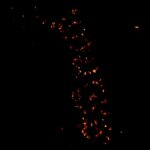
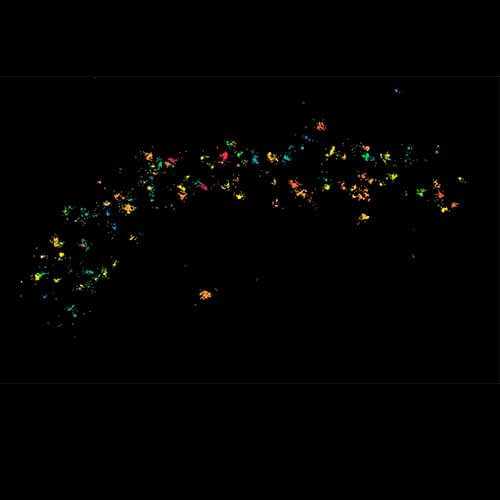
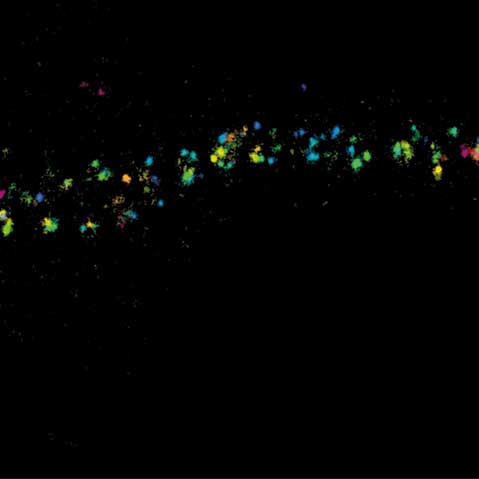
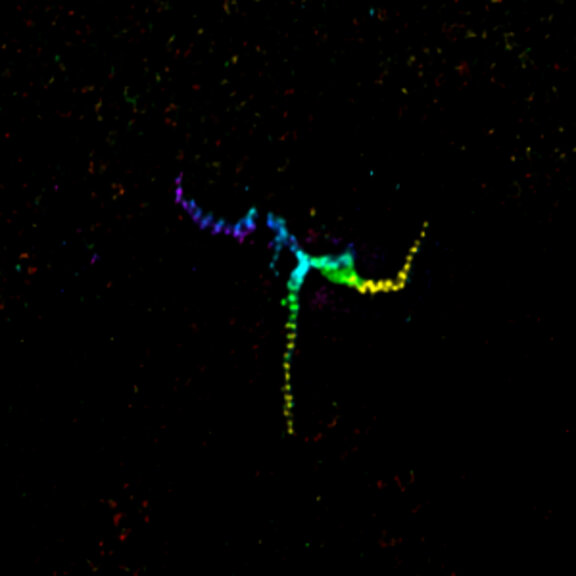
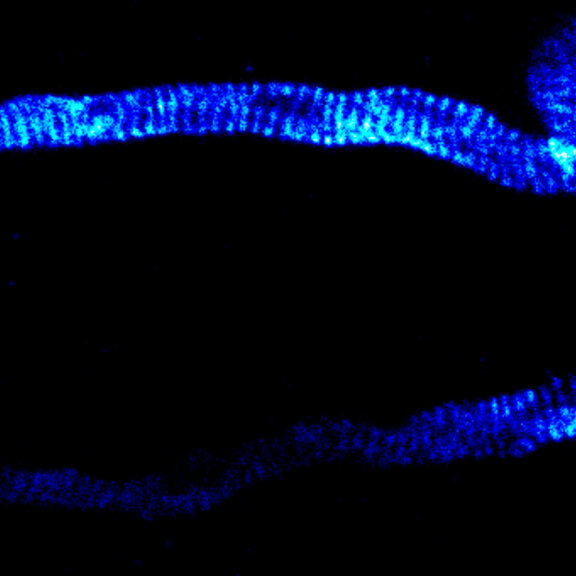
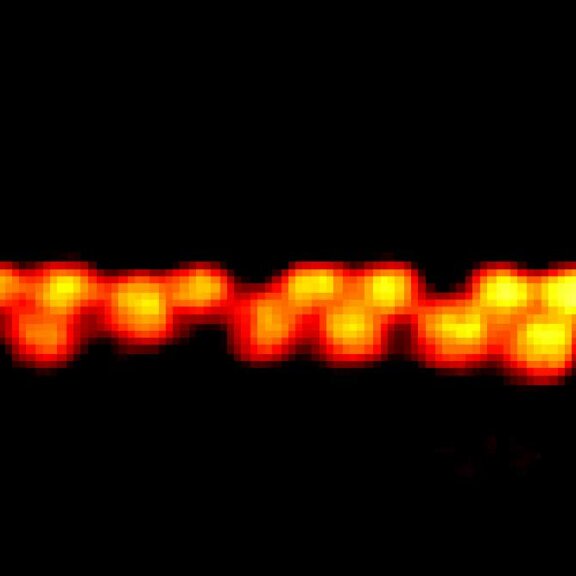
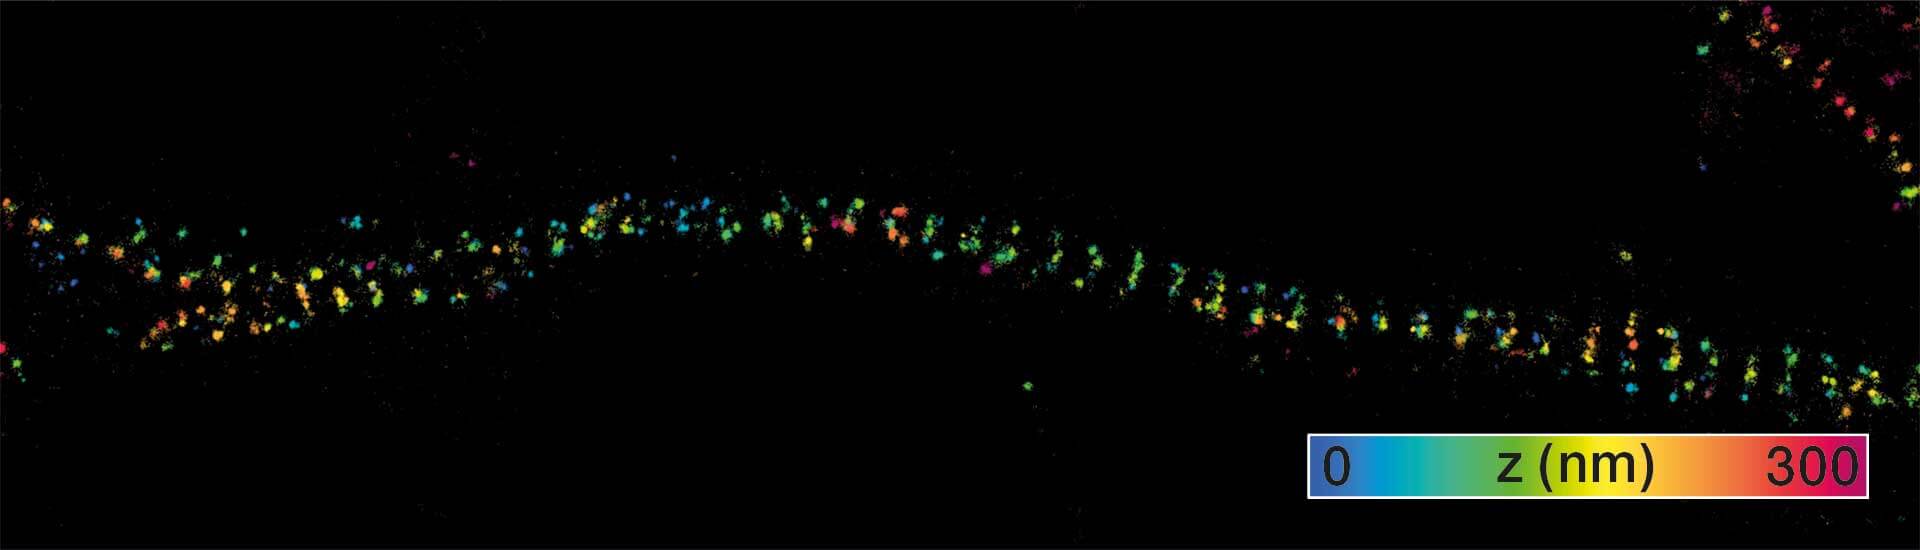
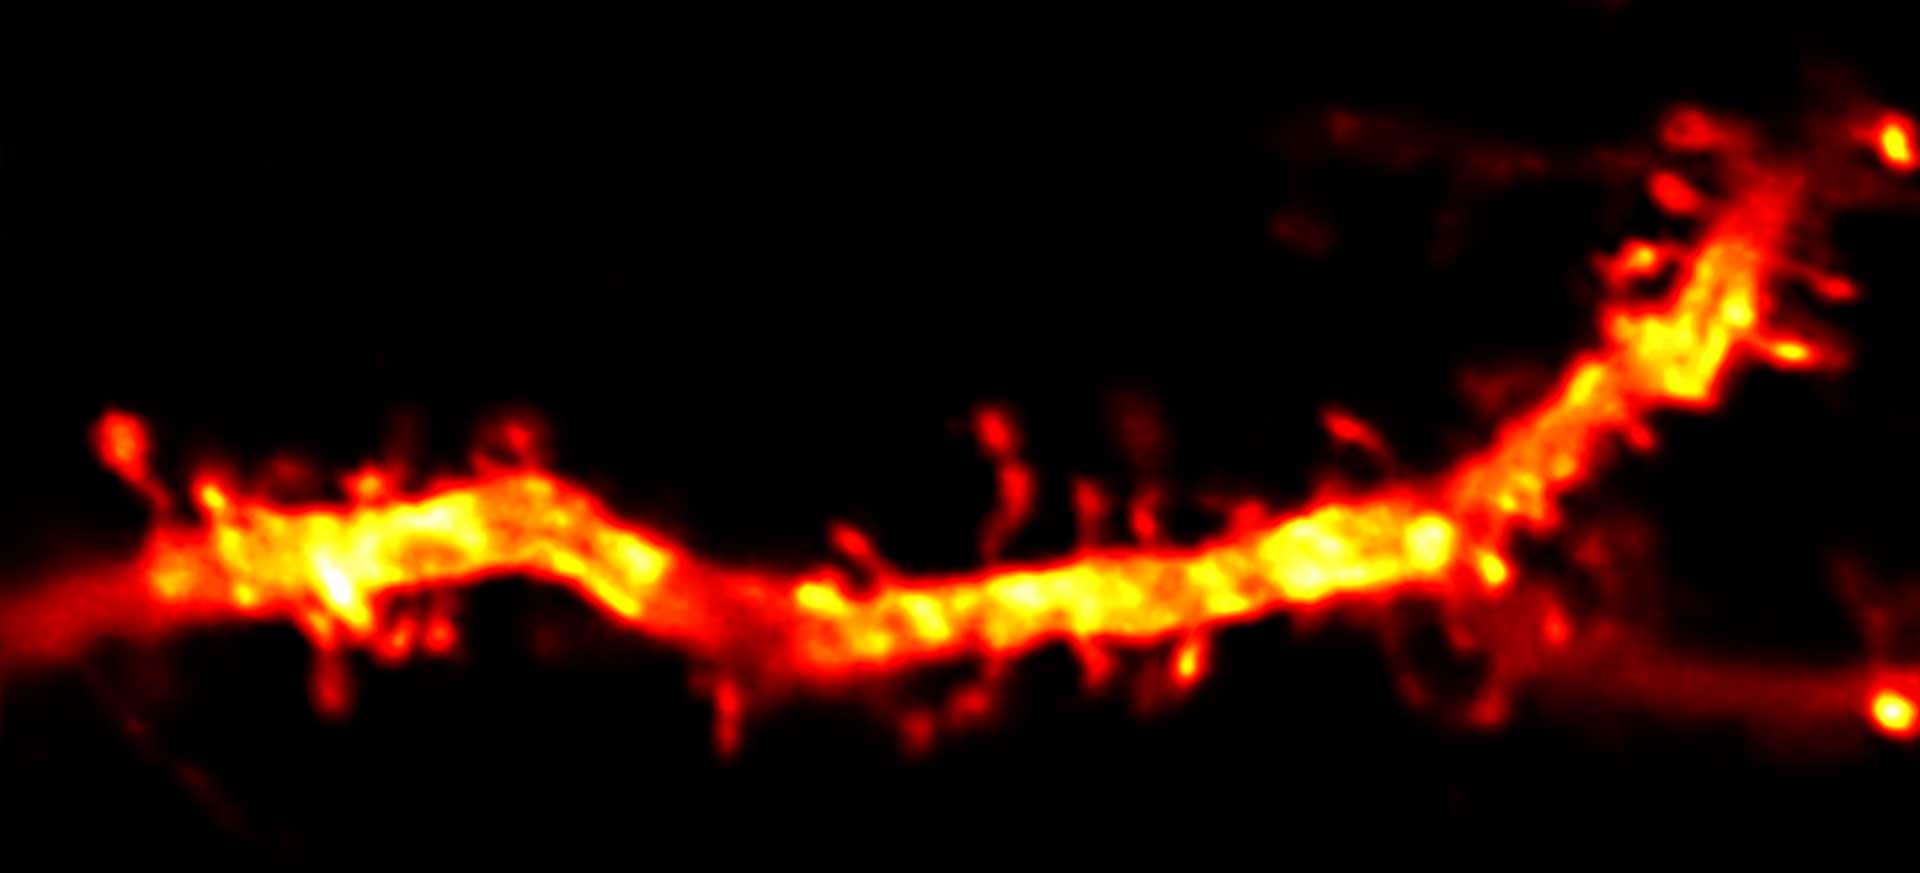
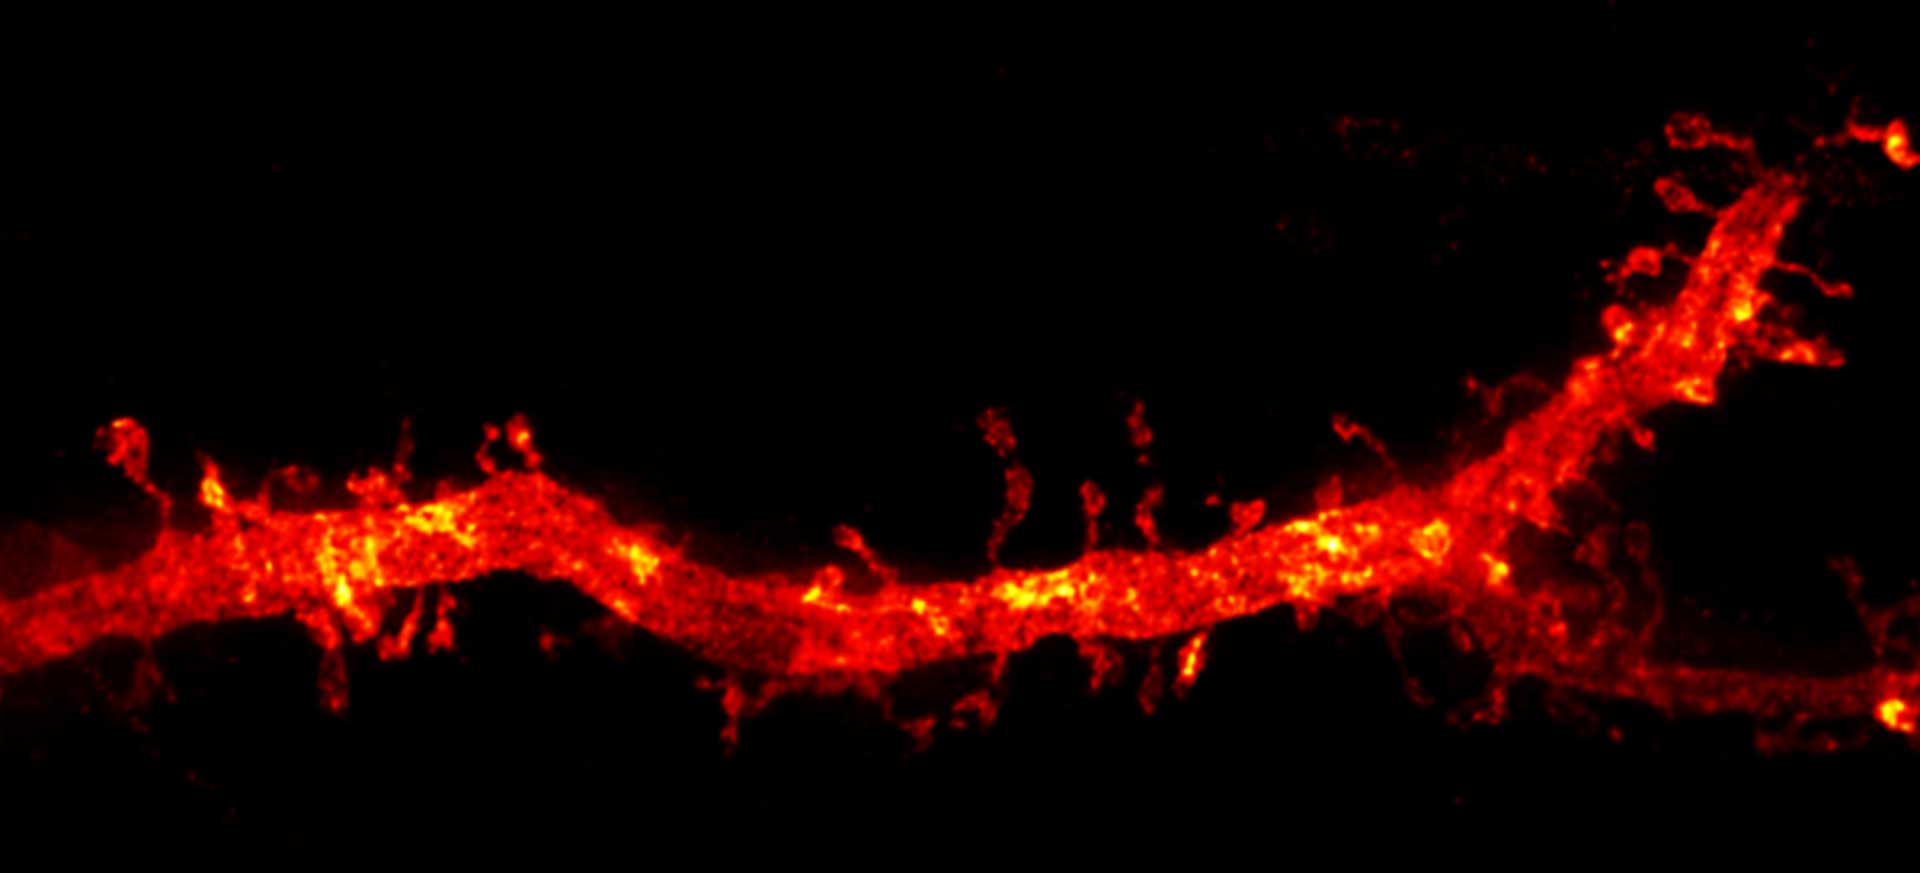
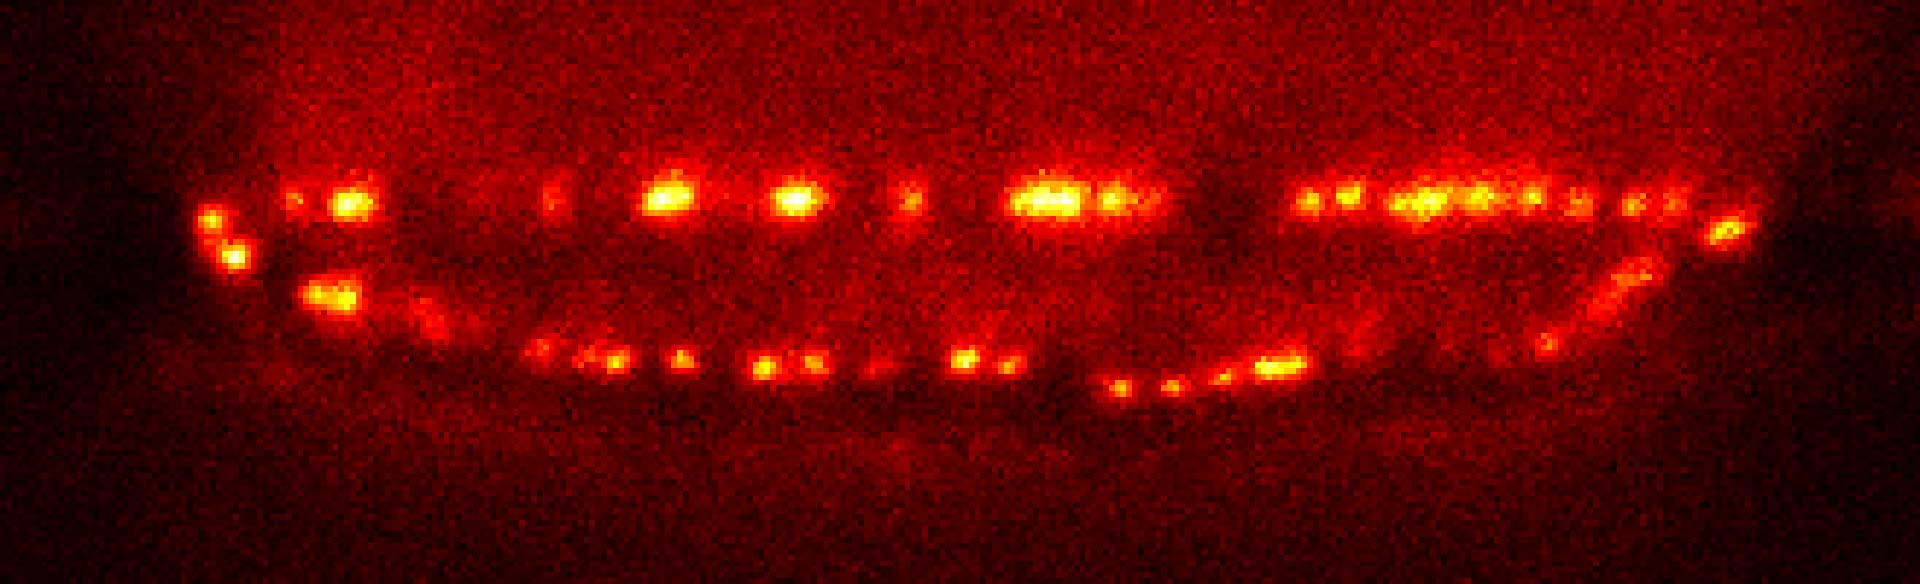
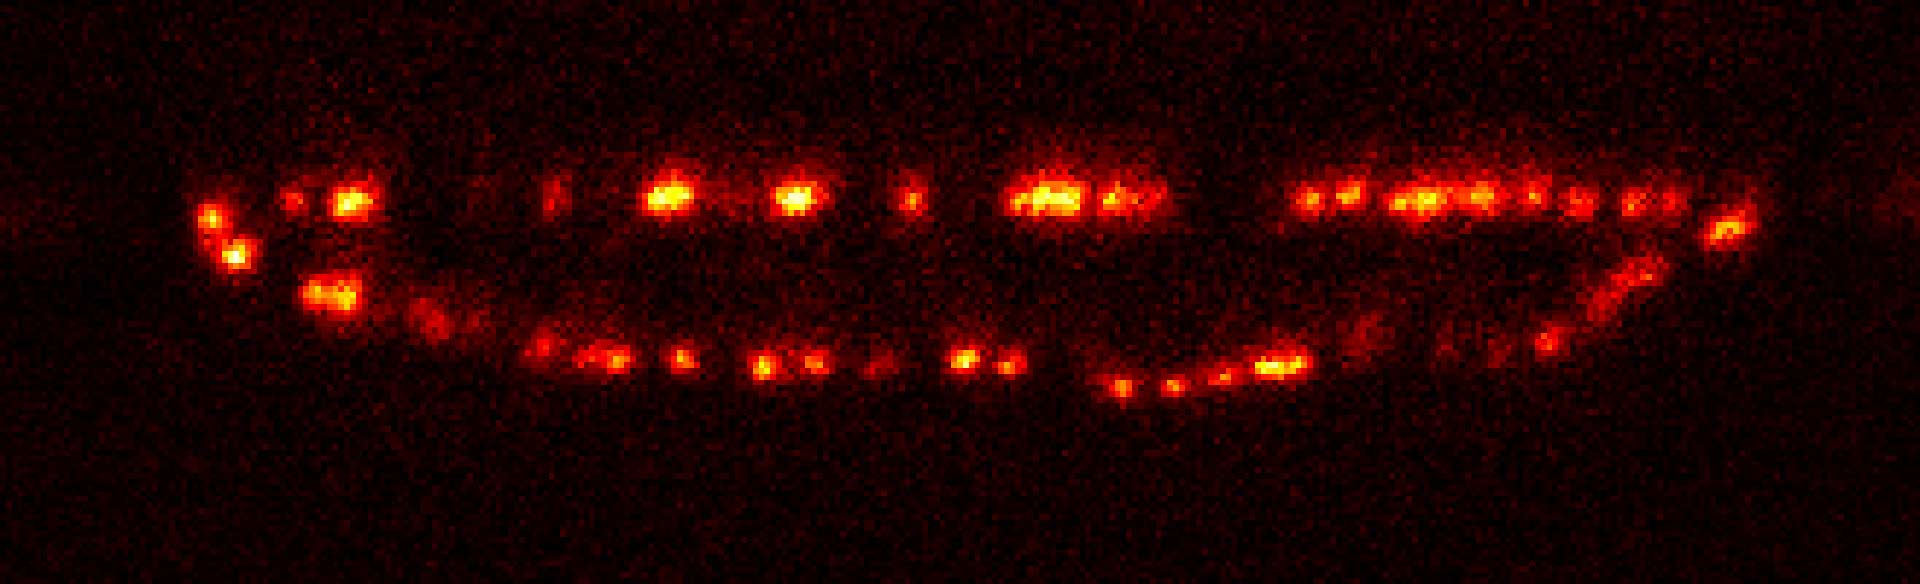
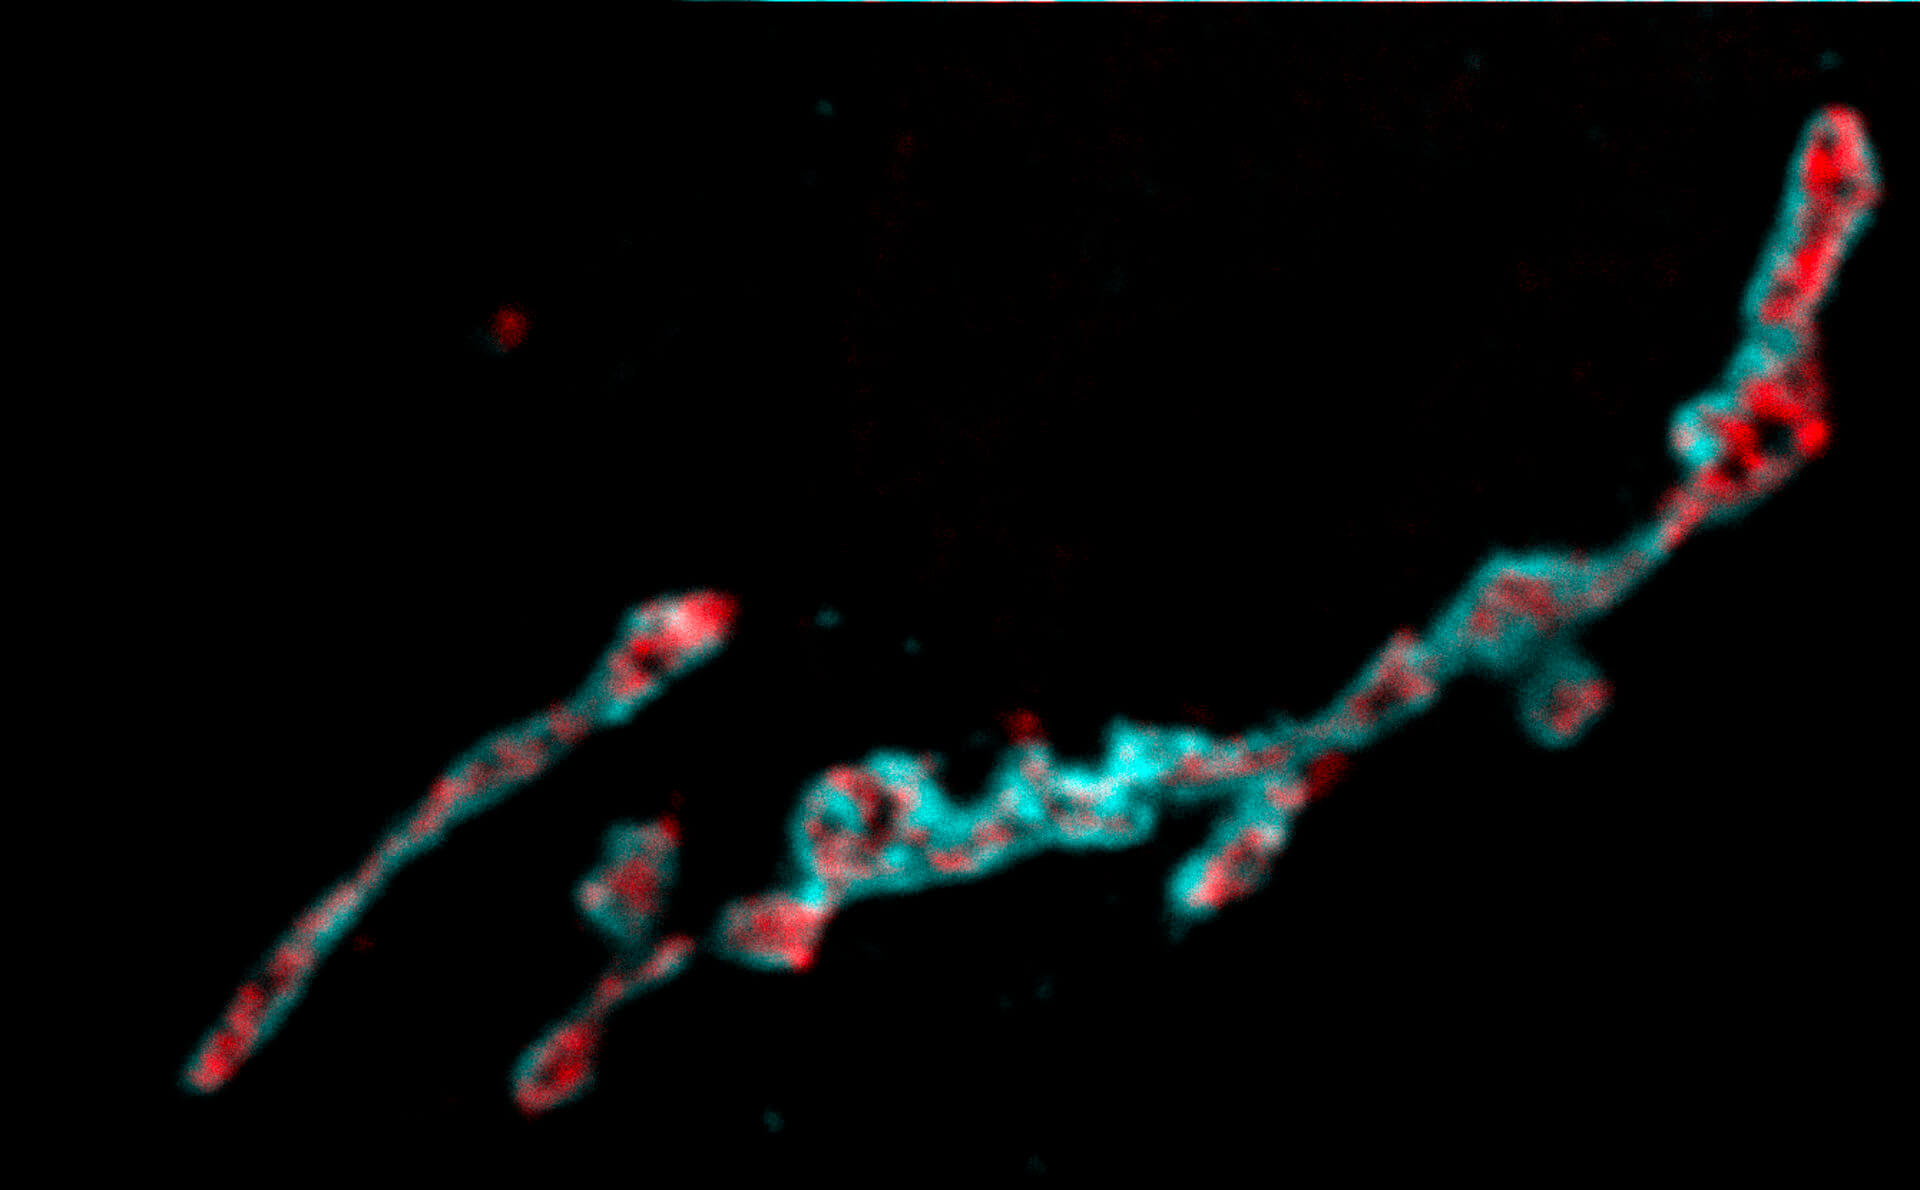
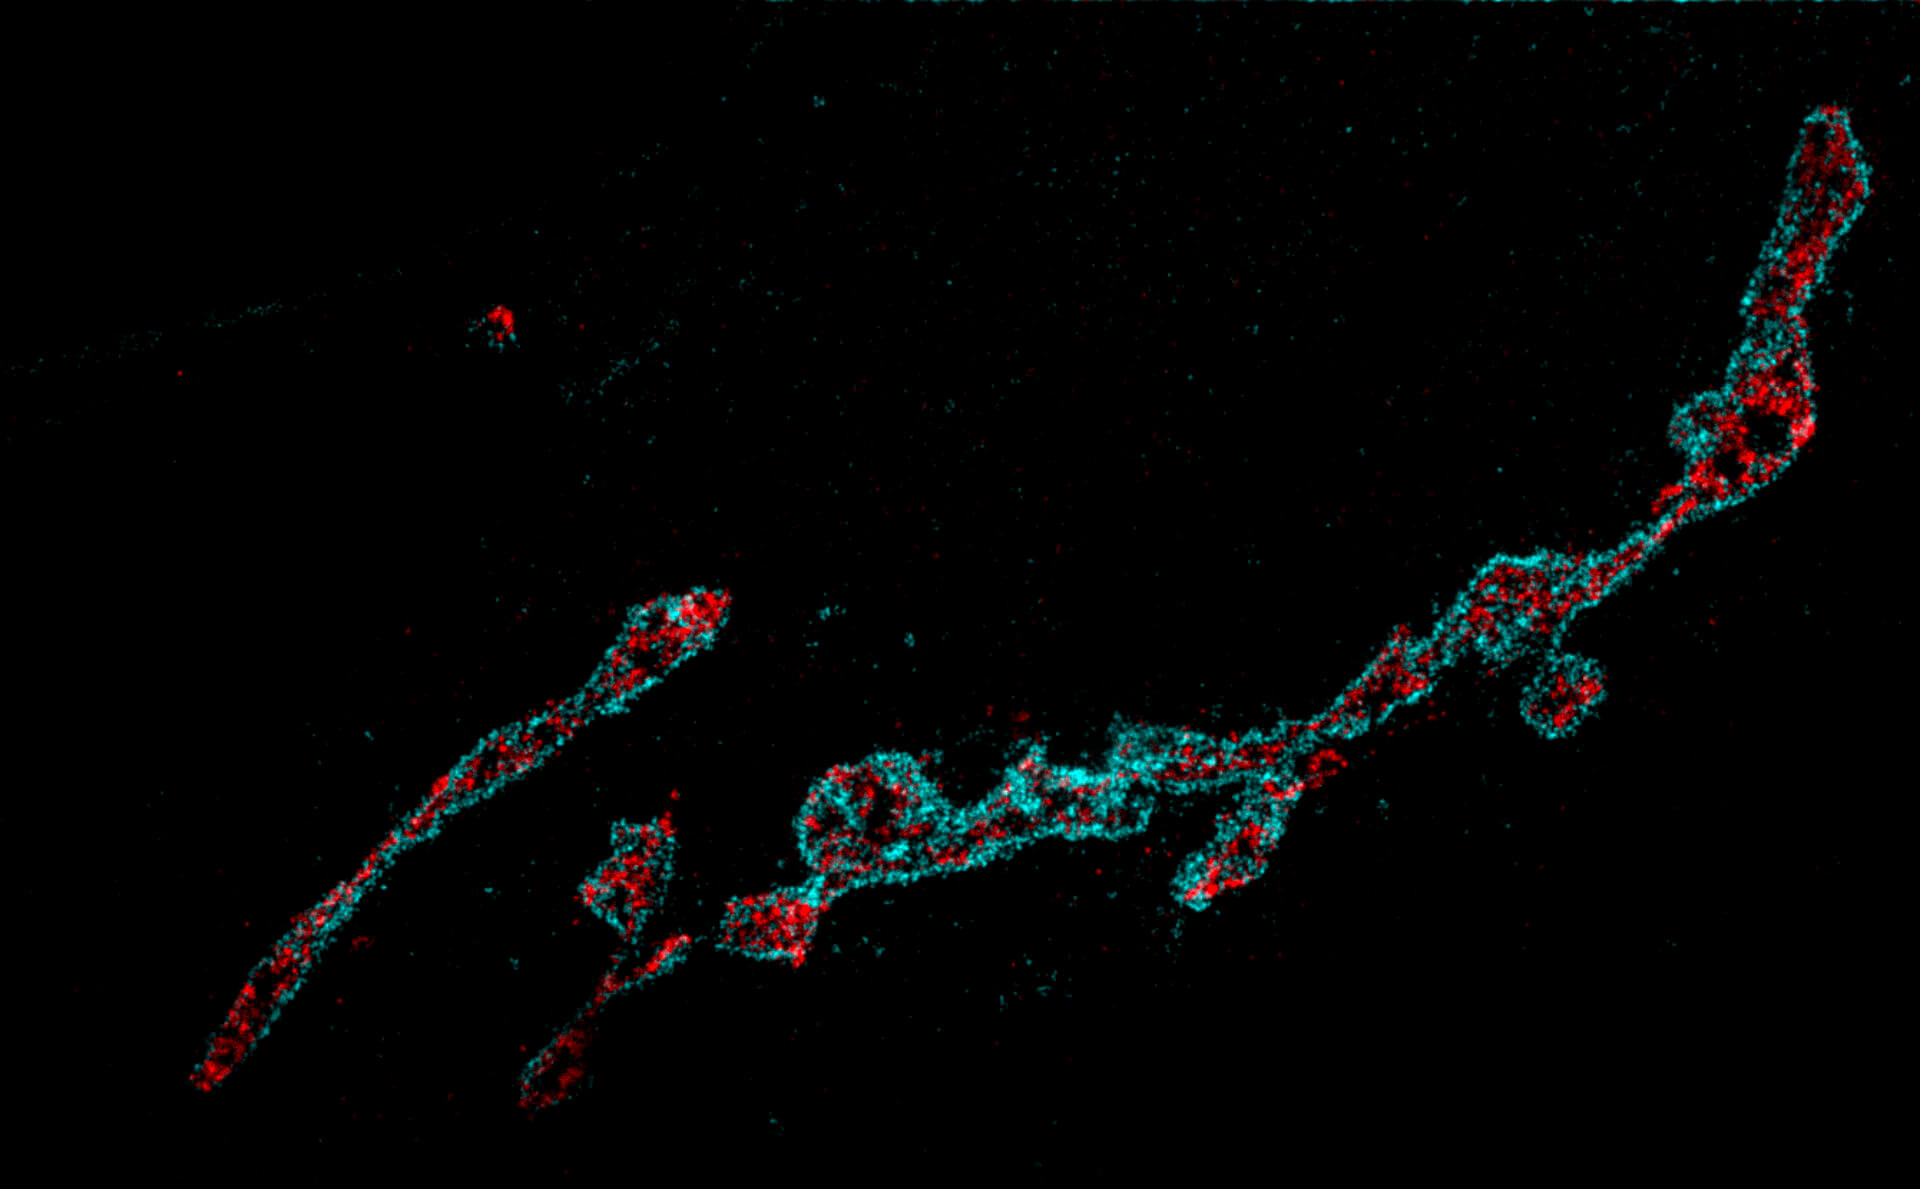
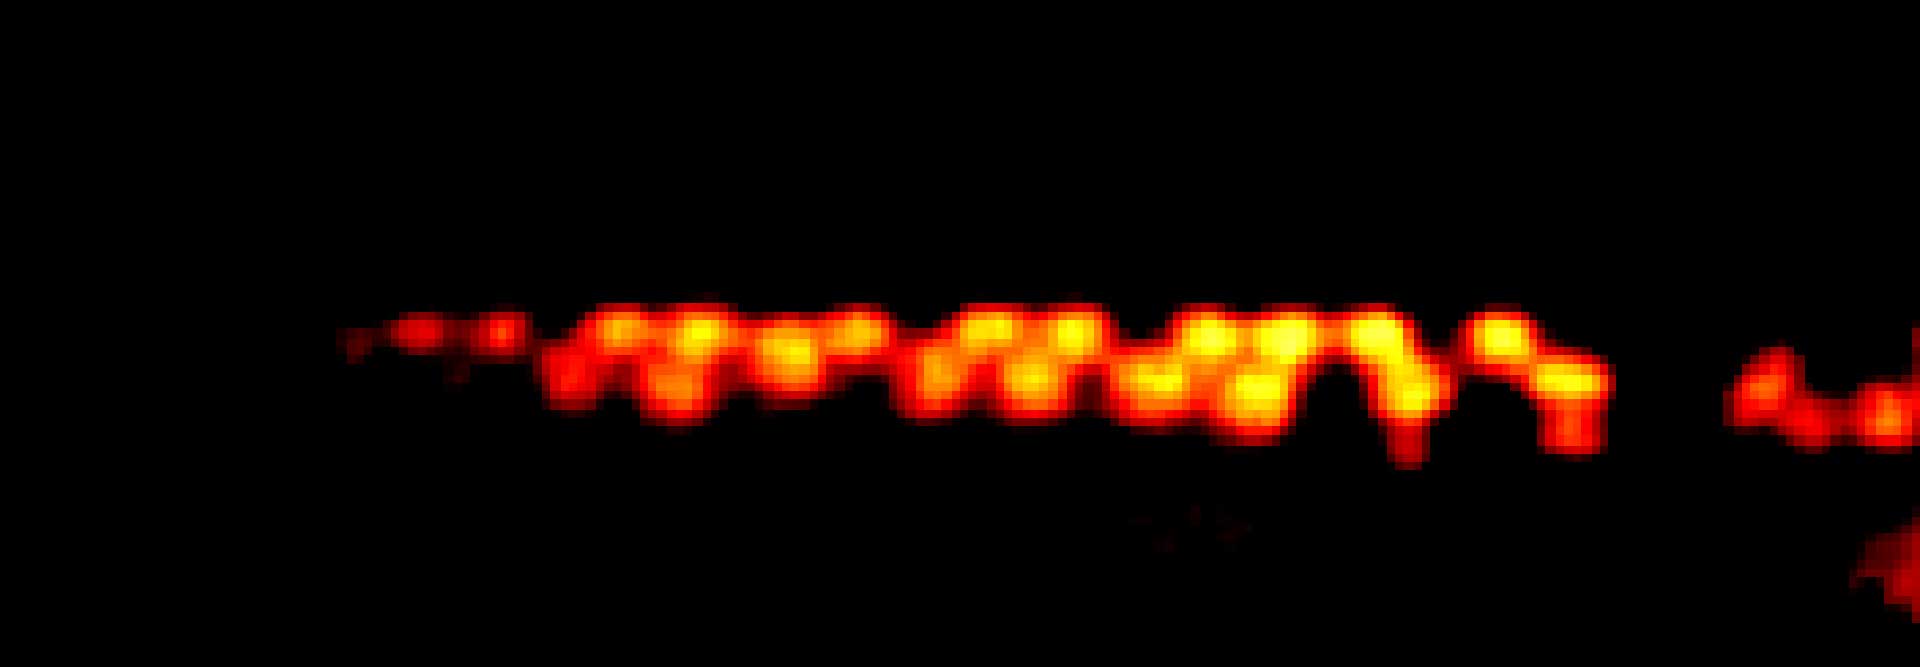
3D MINFLUX imaging of βII spectrin in a primary hippocampal neuron labeled with Alexa Fluor 647 by indirect immunofluorescence
Description
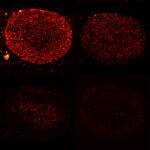
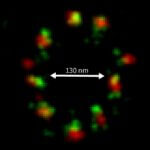
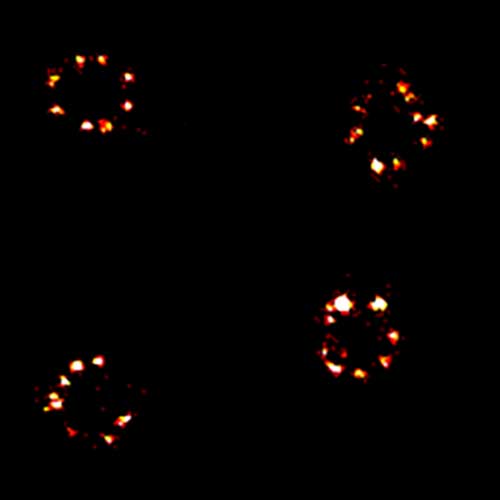
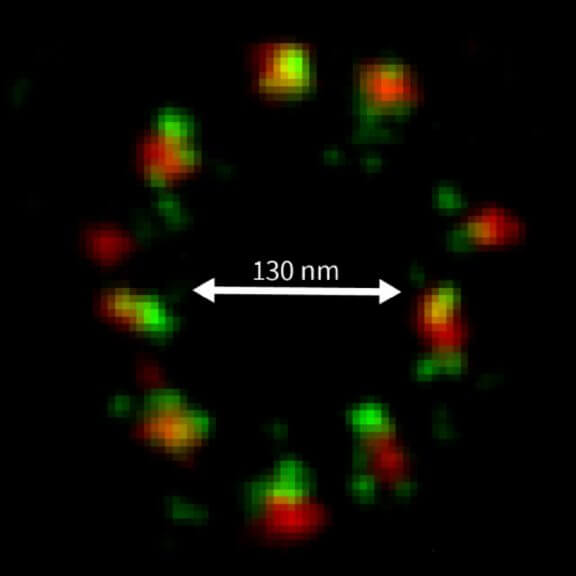
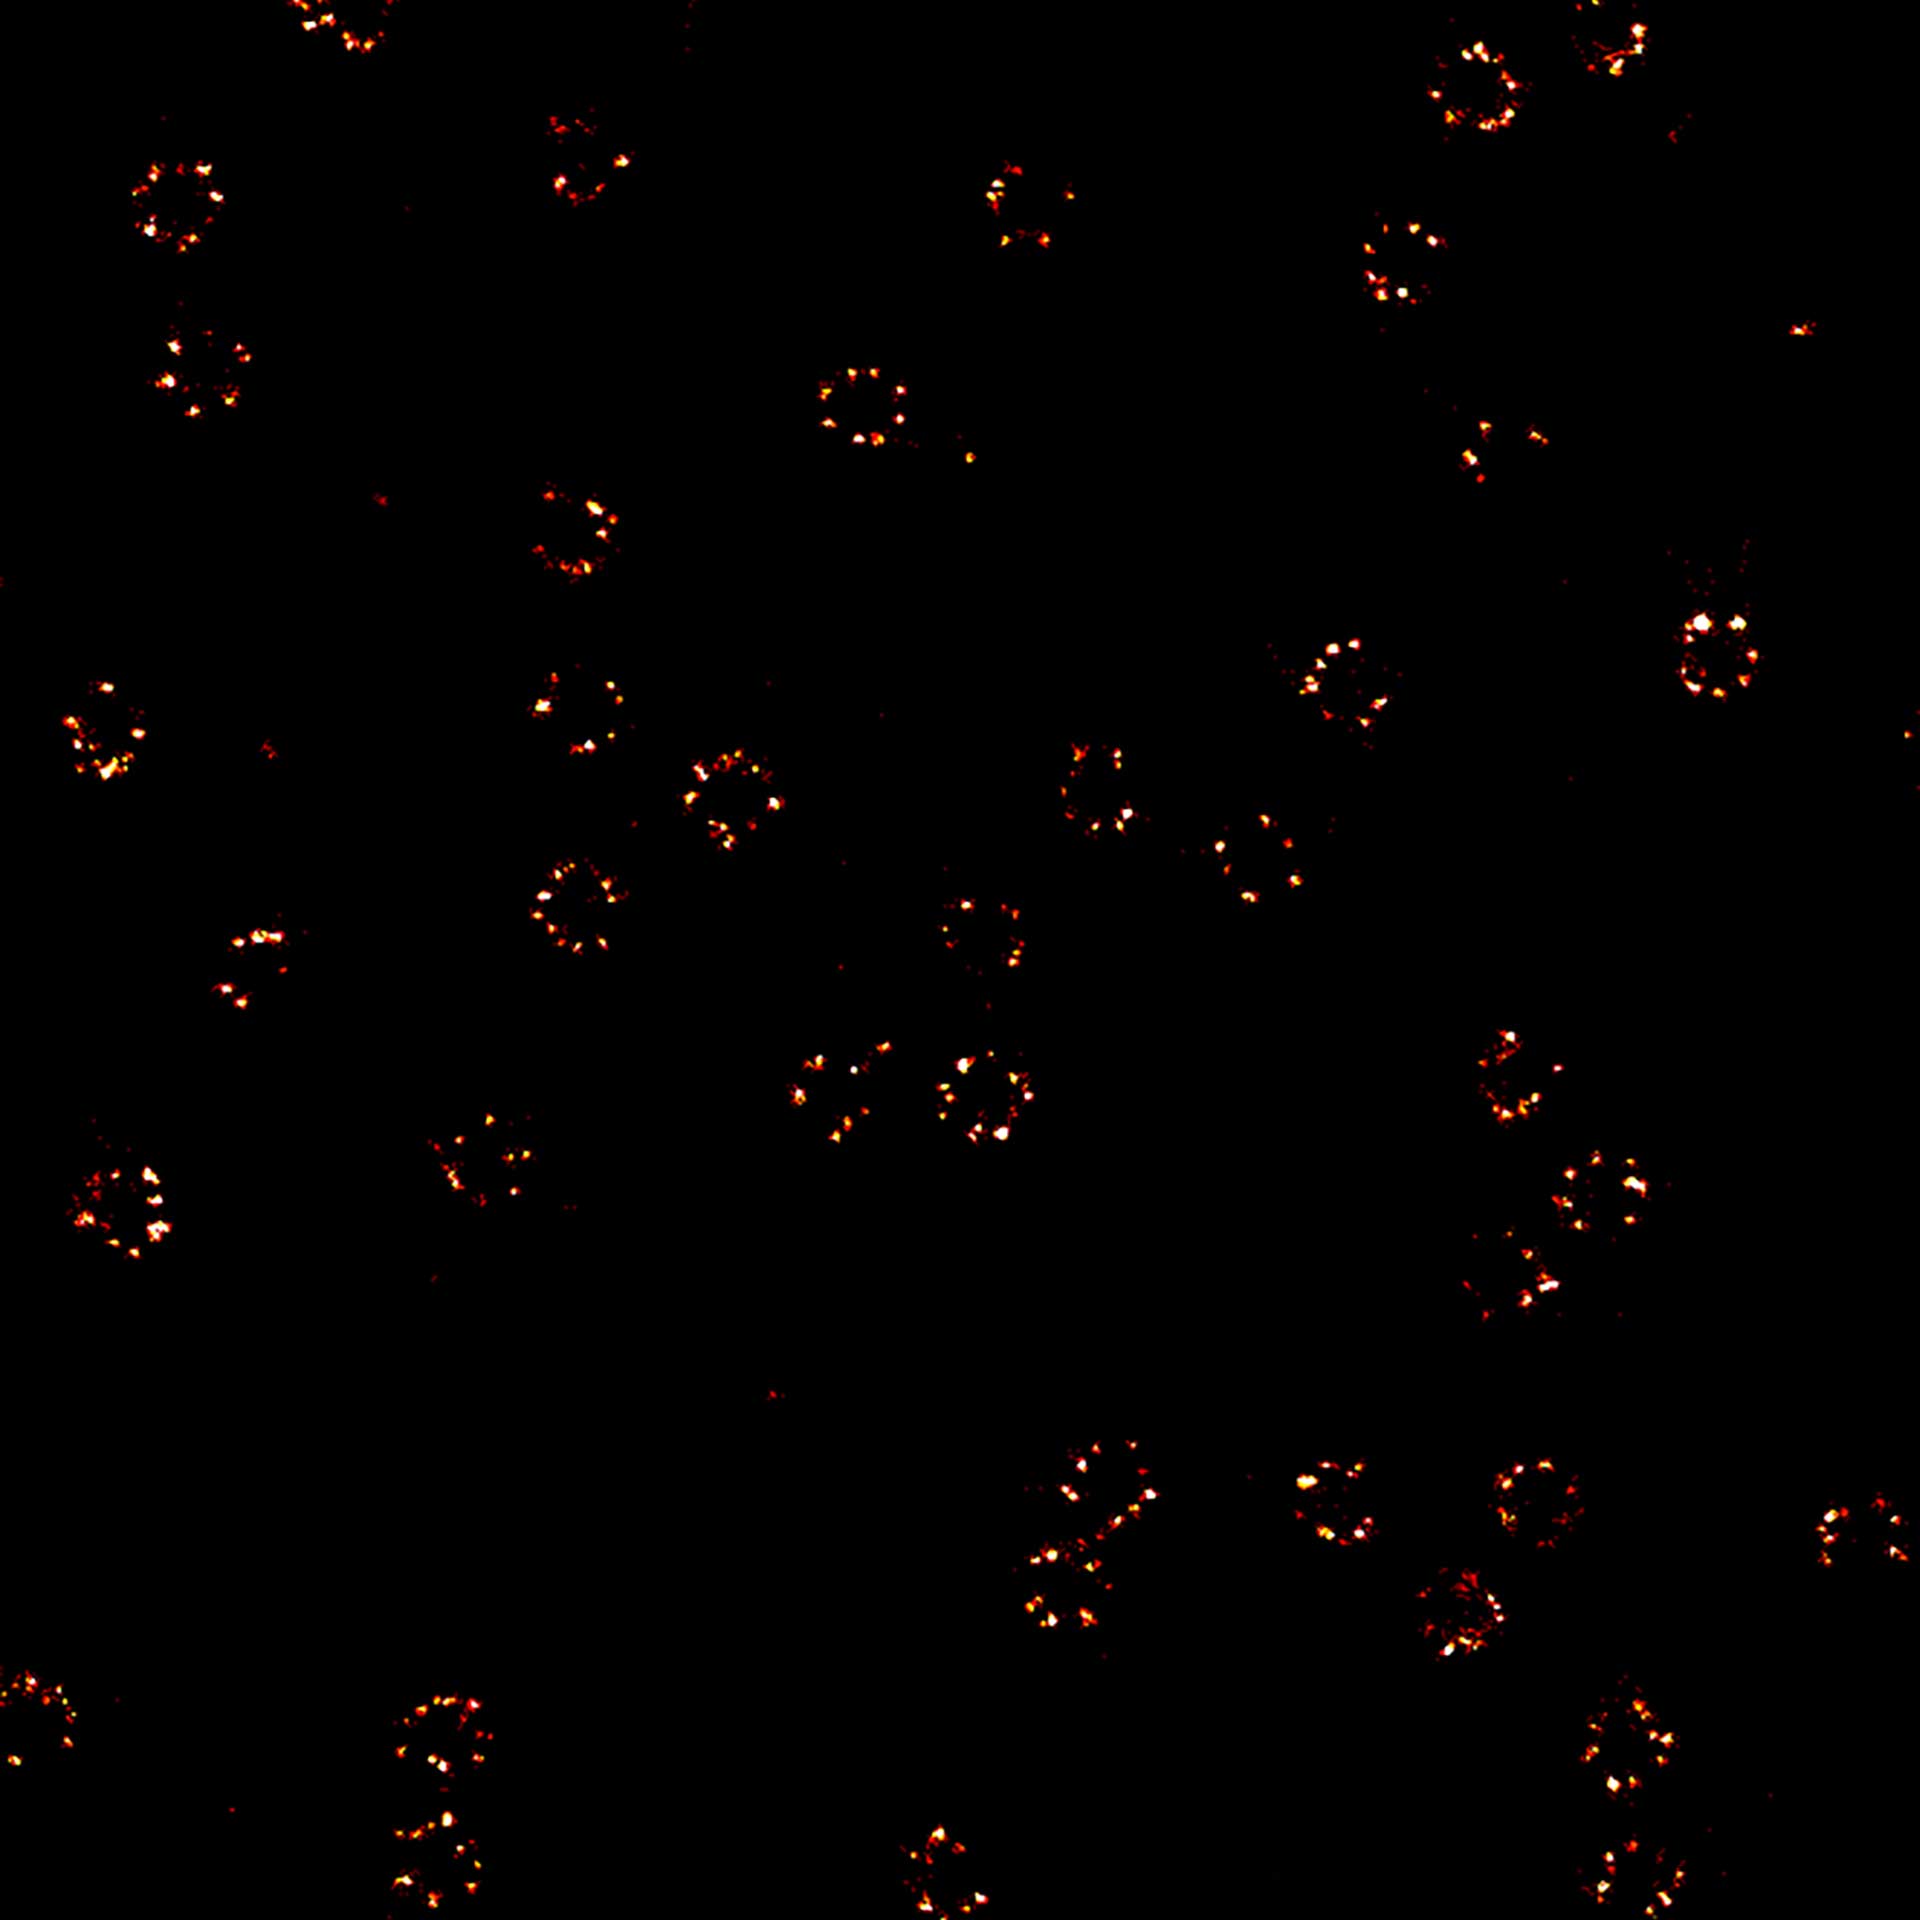
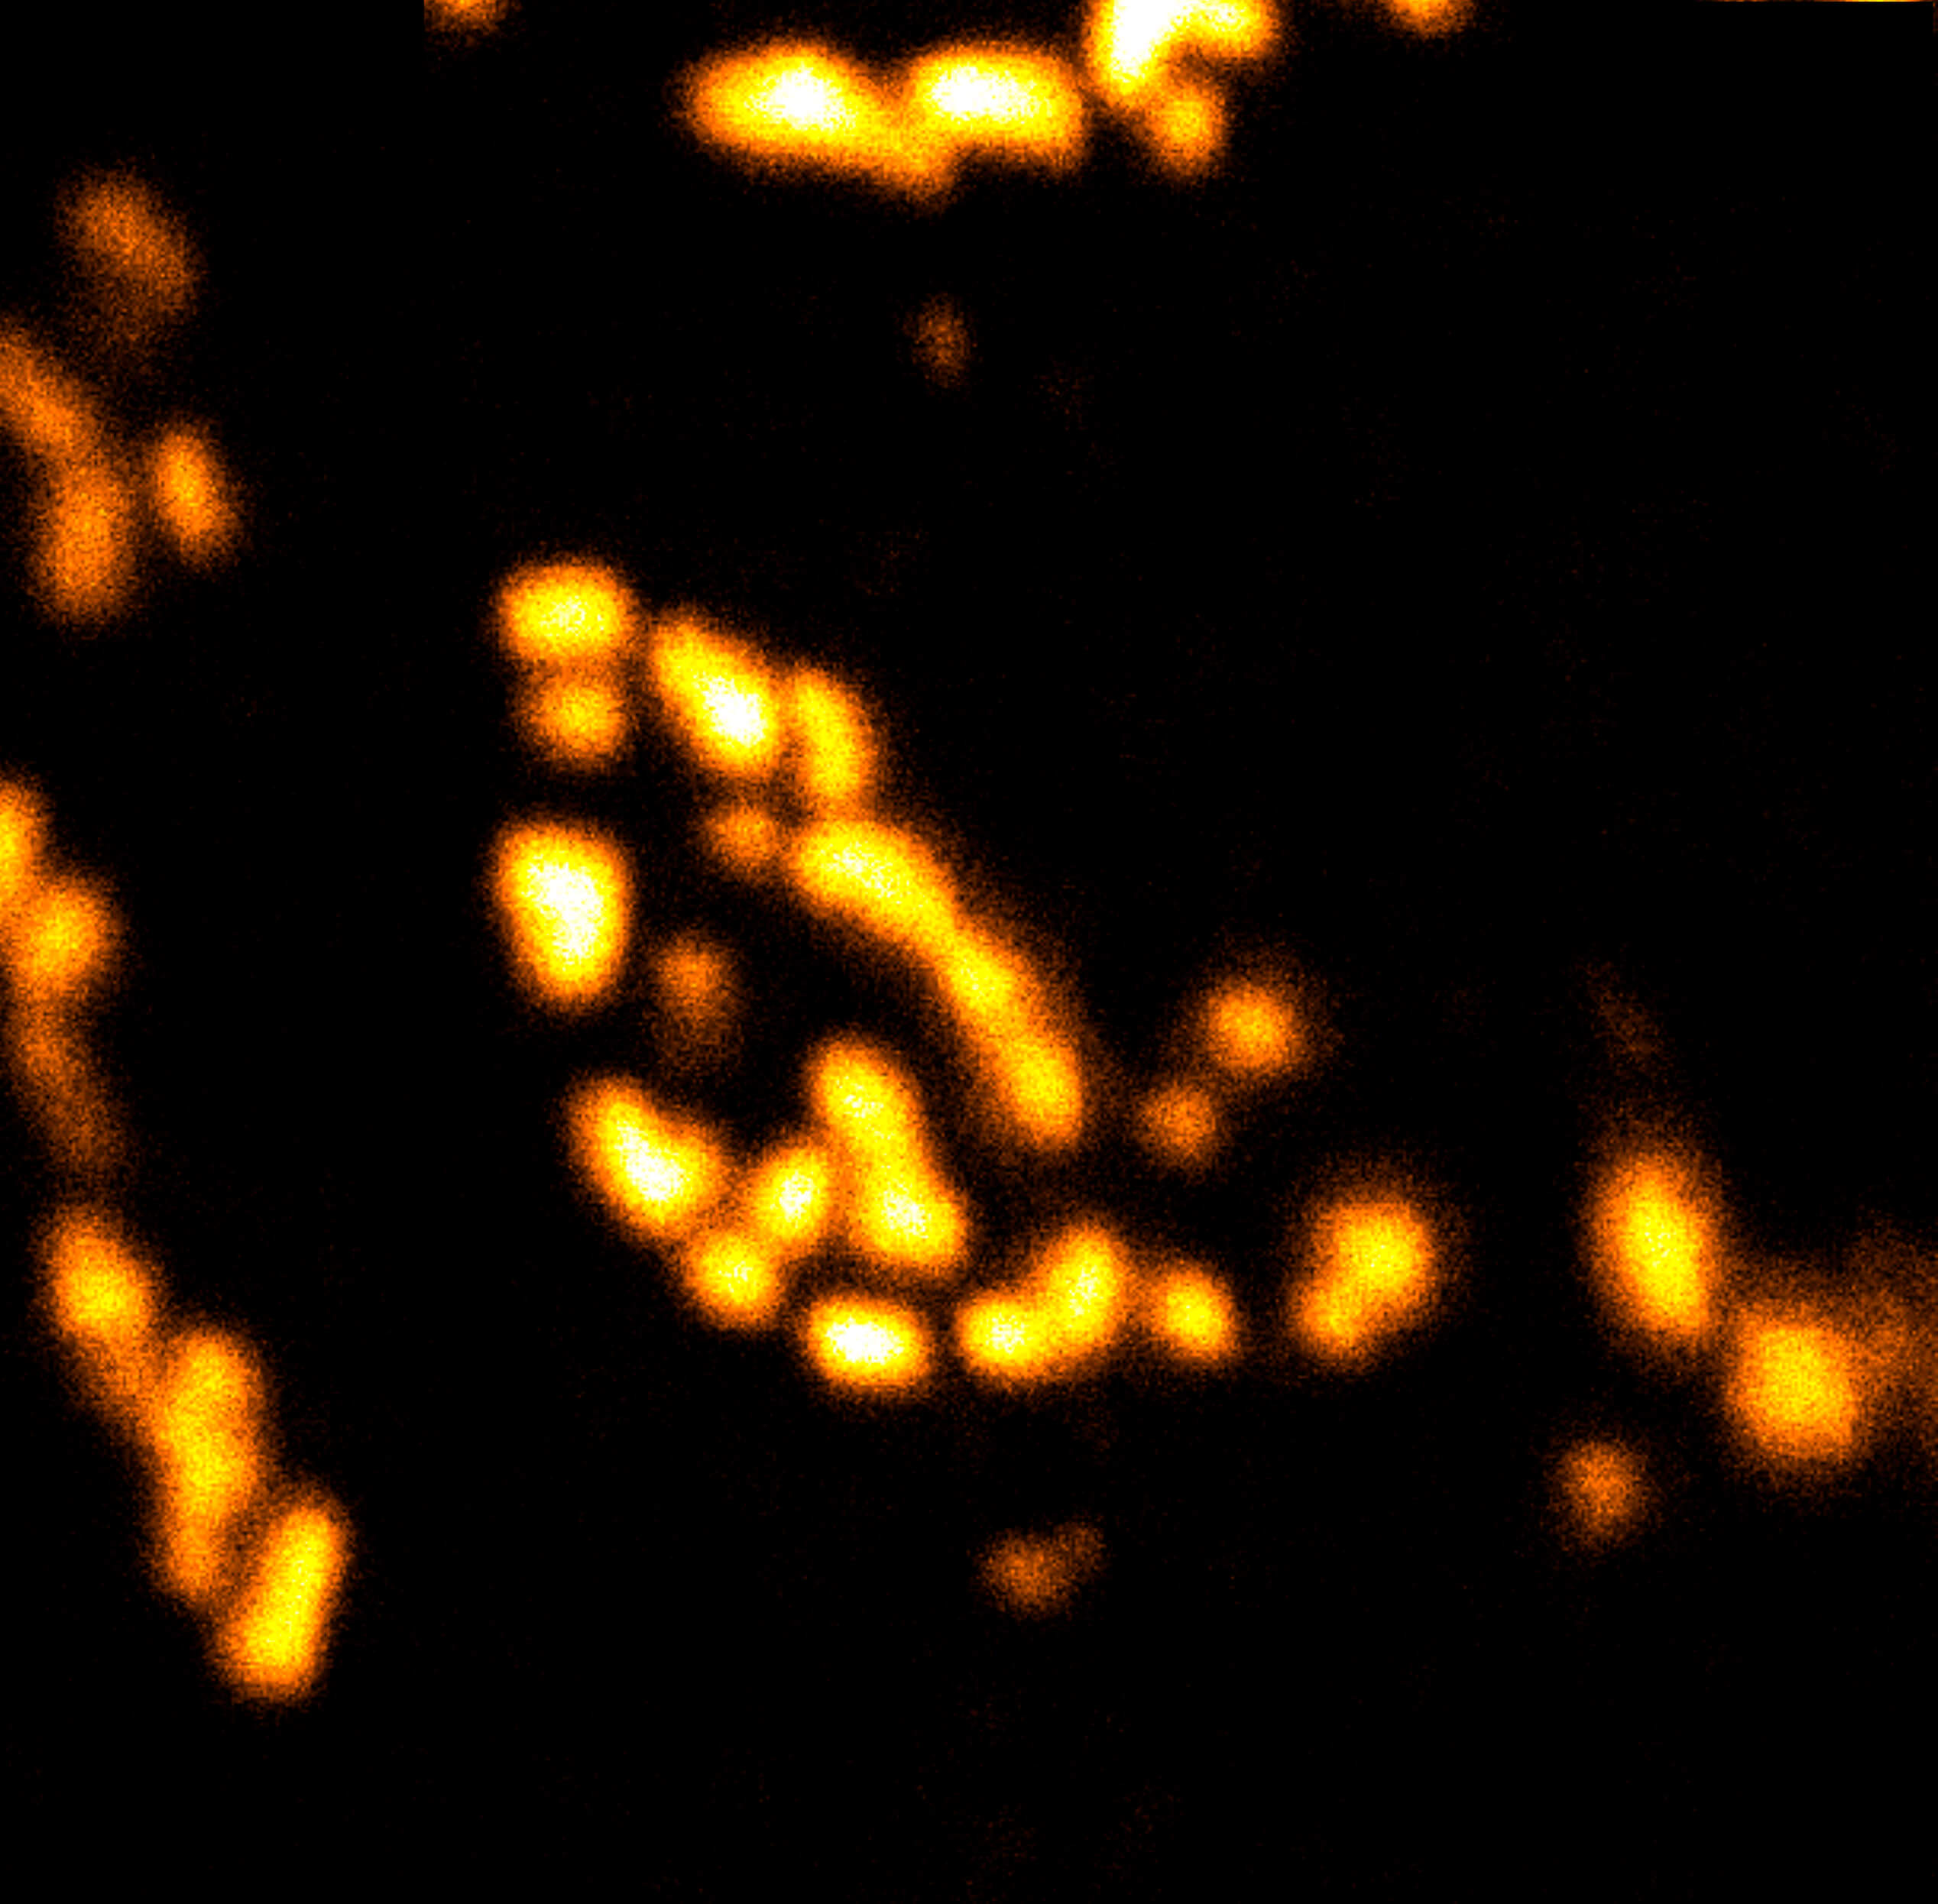
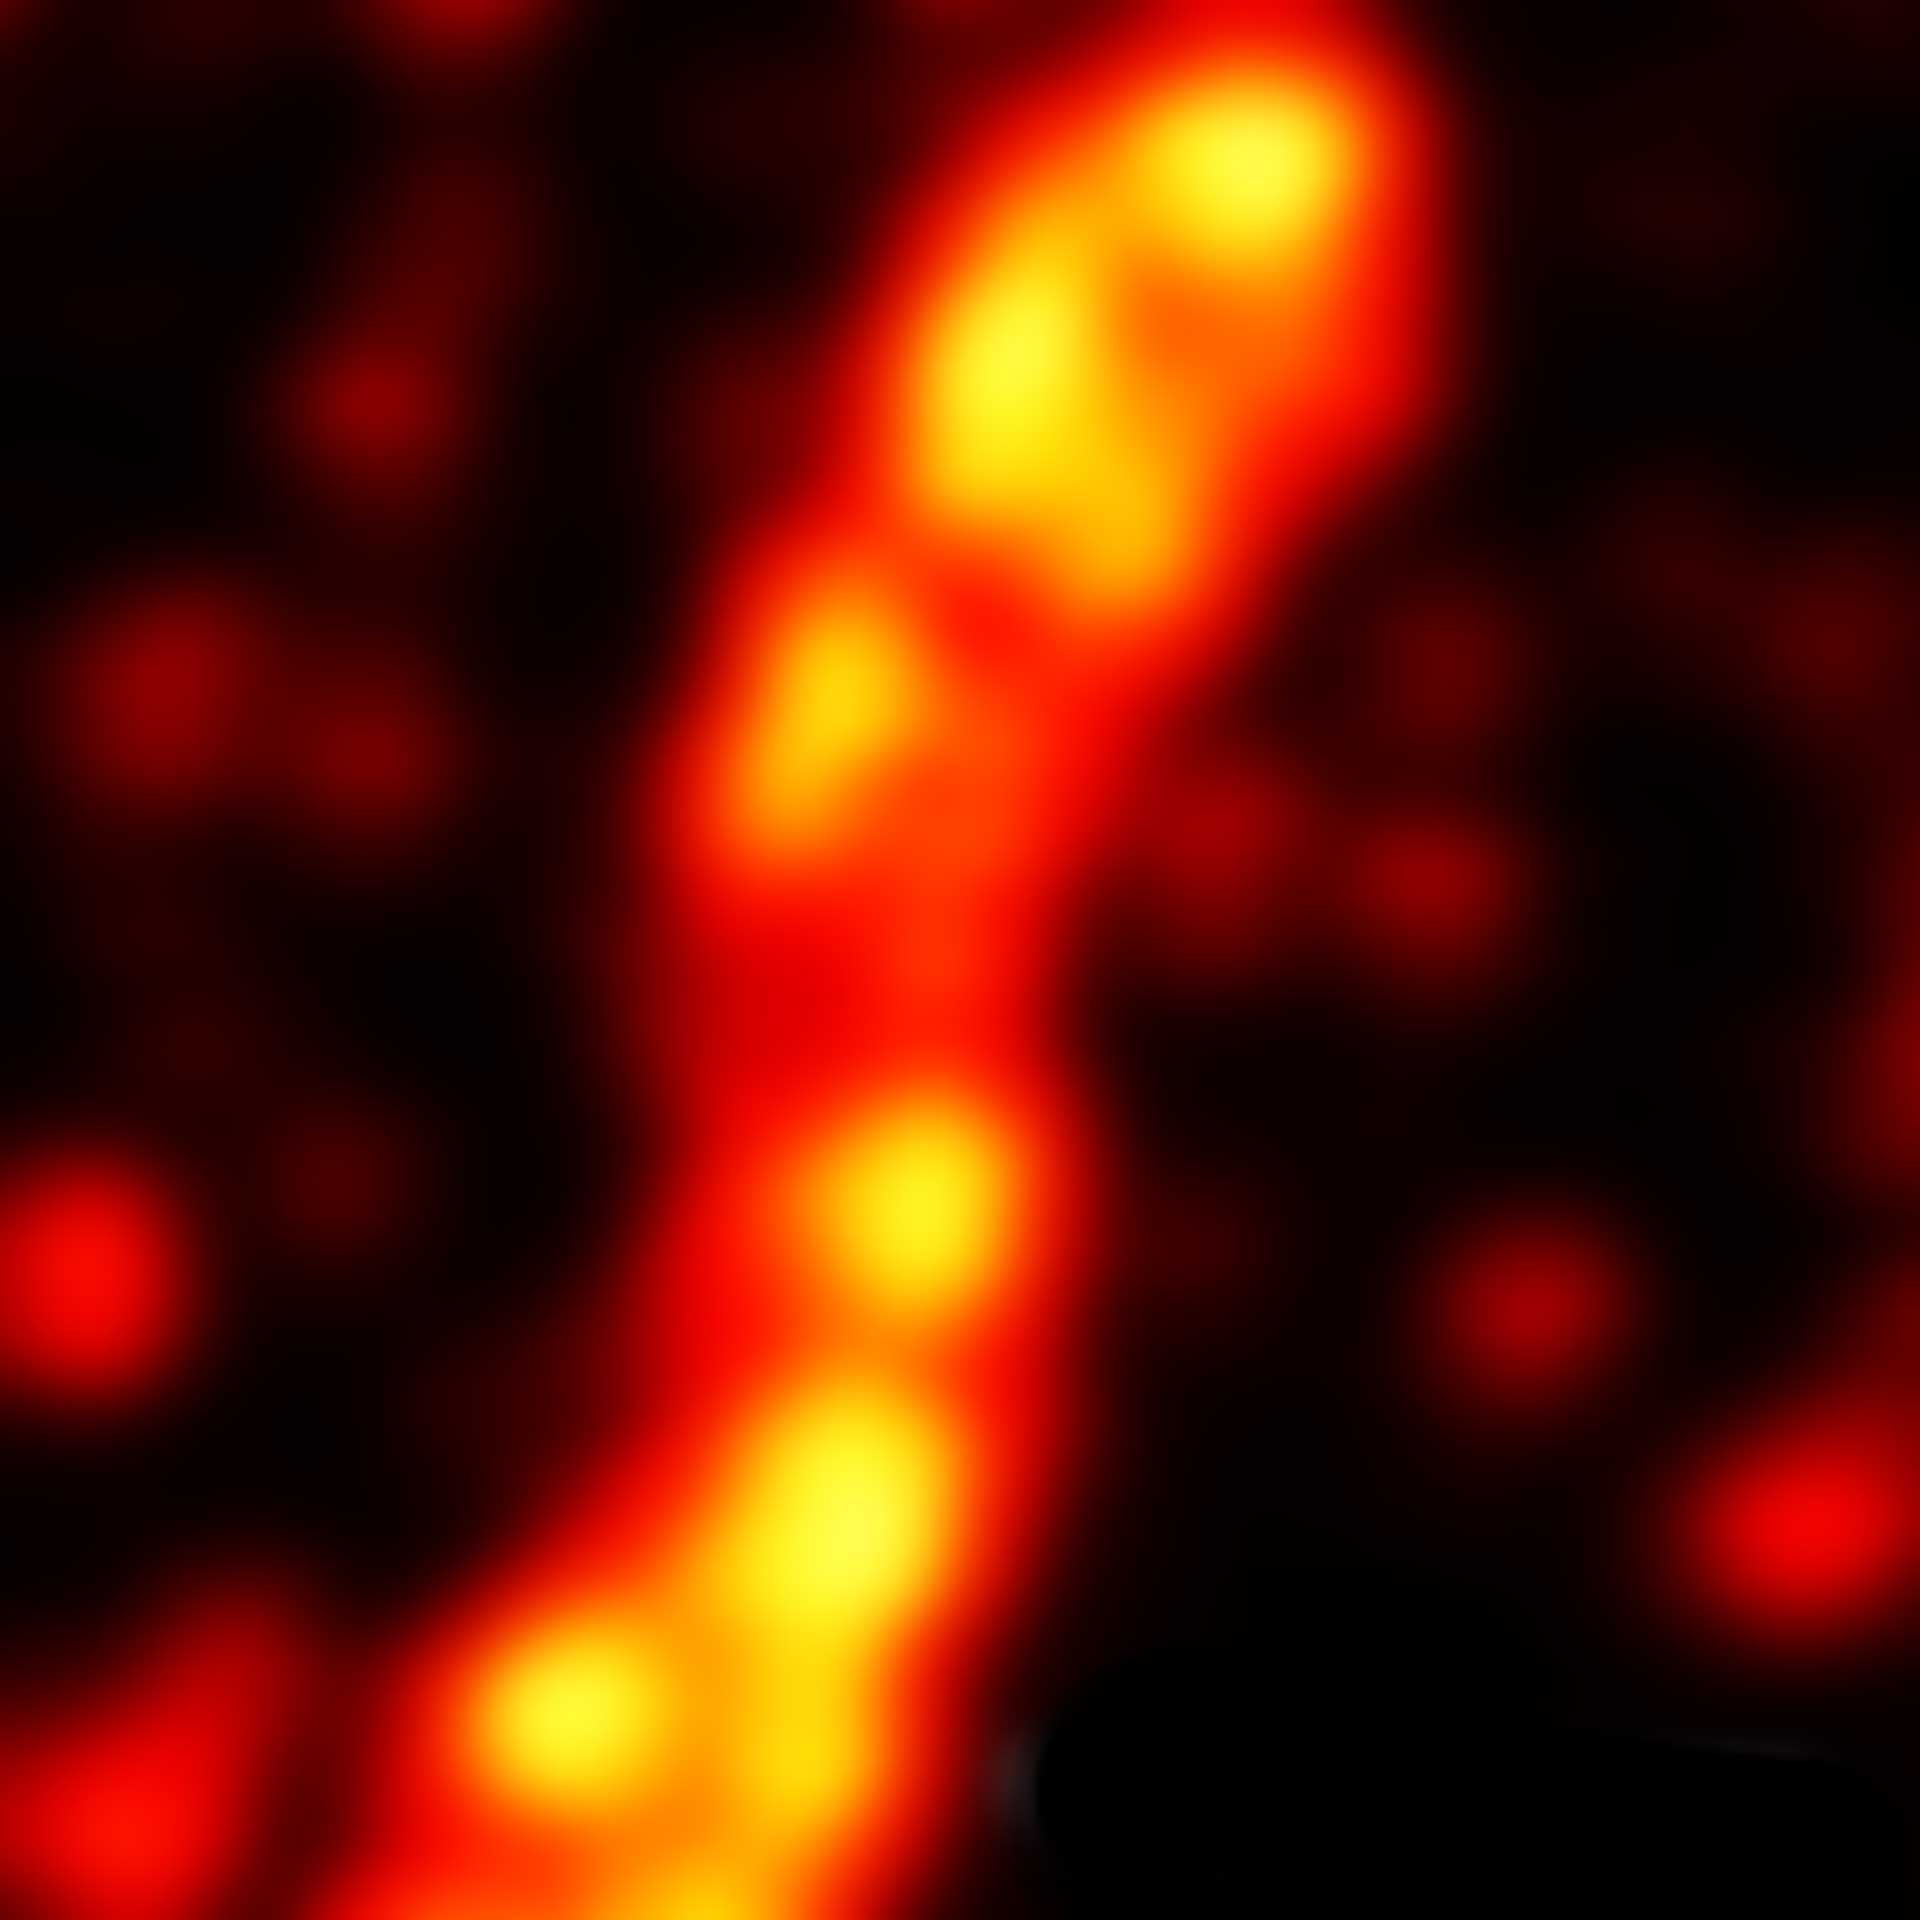
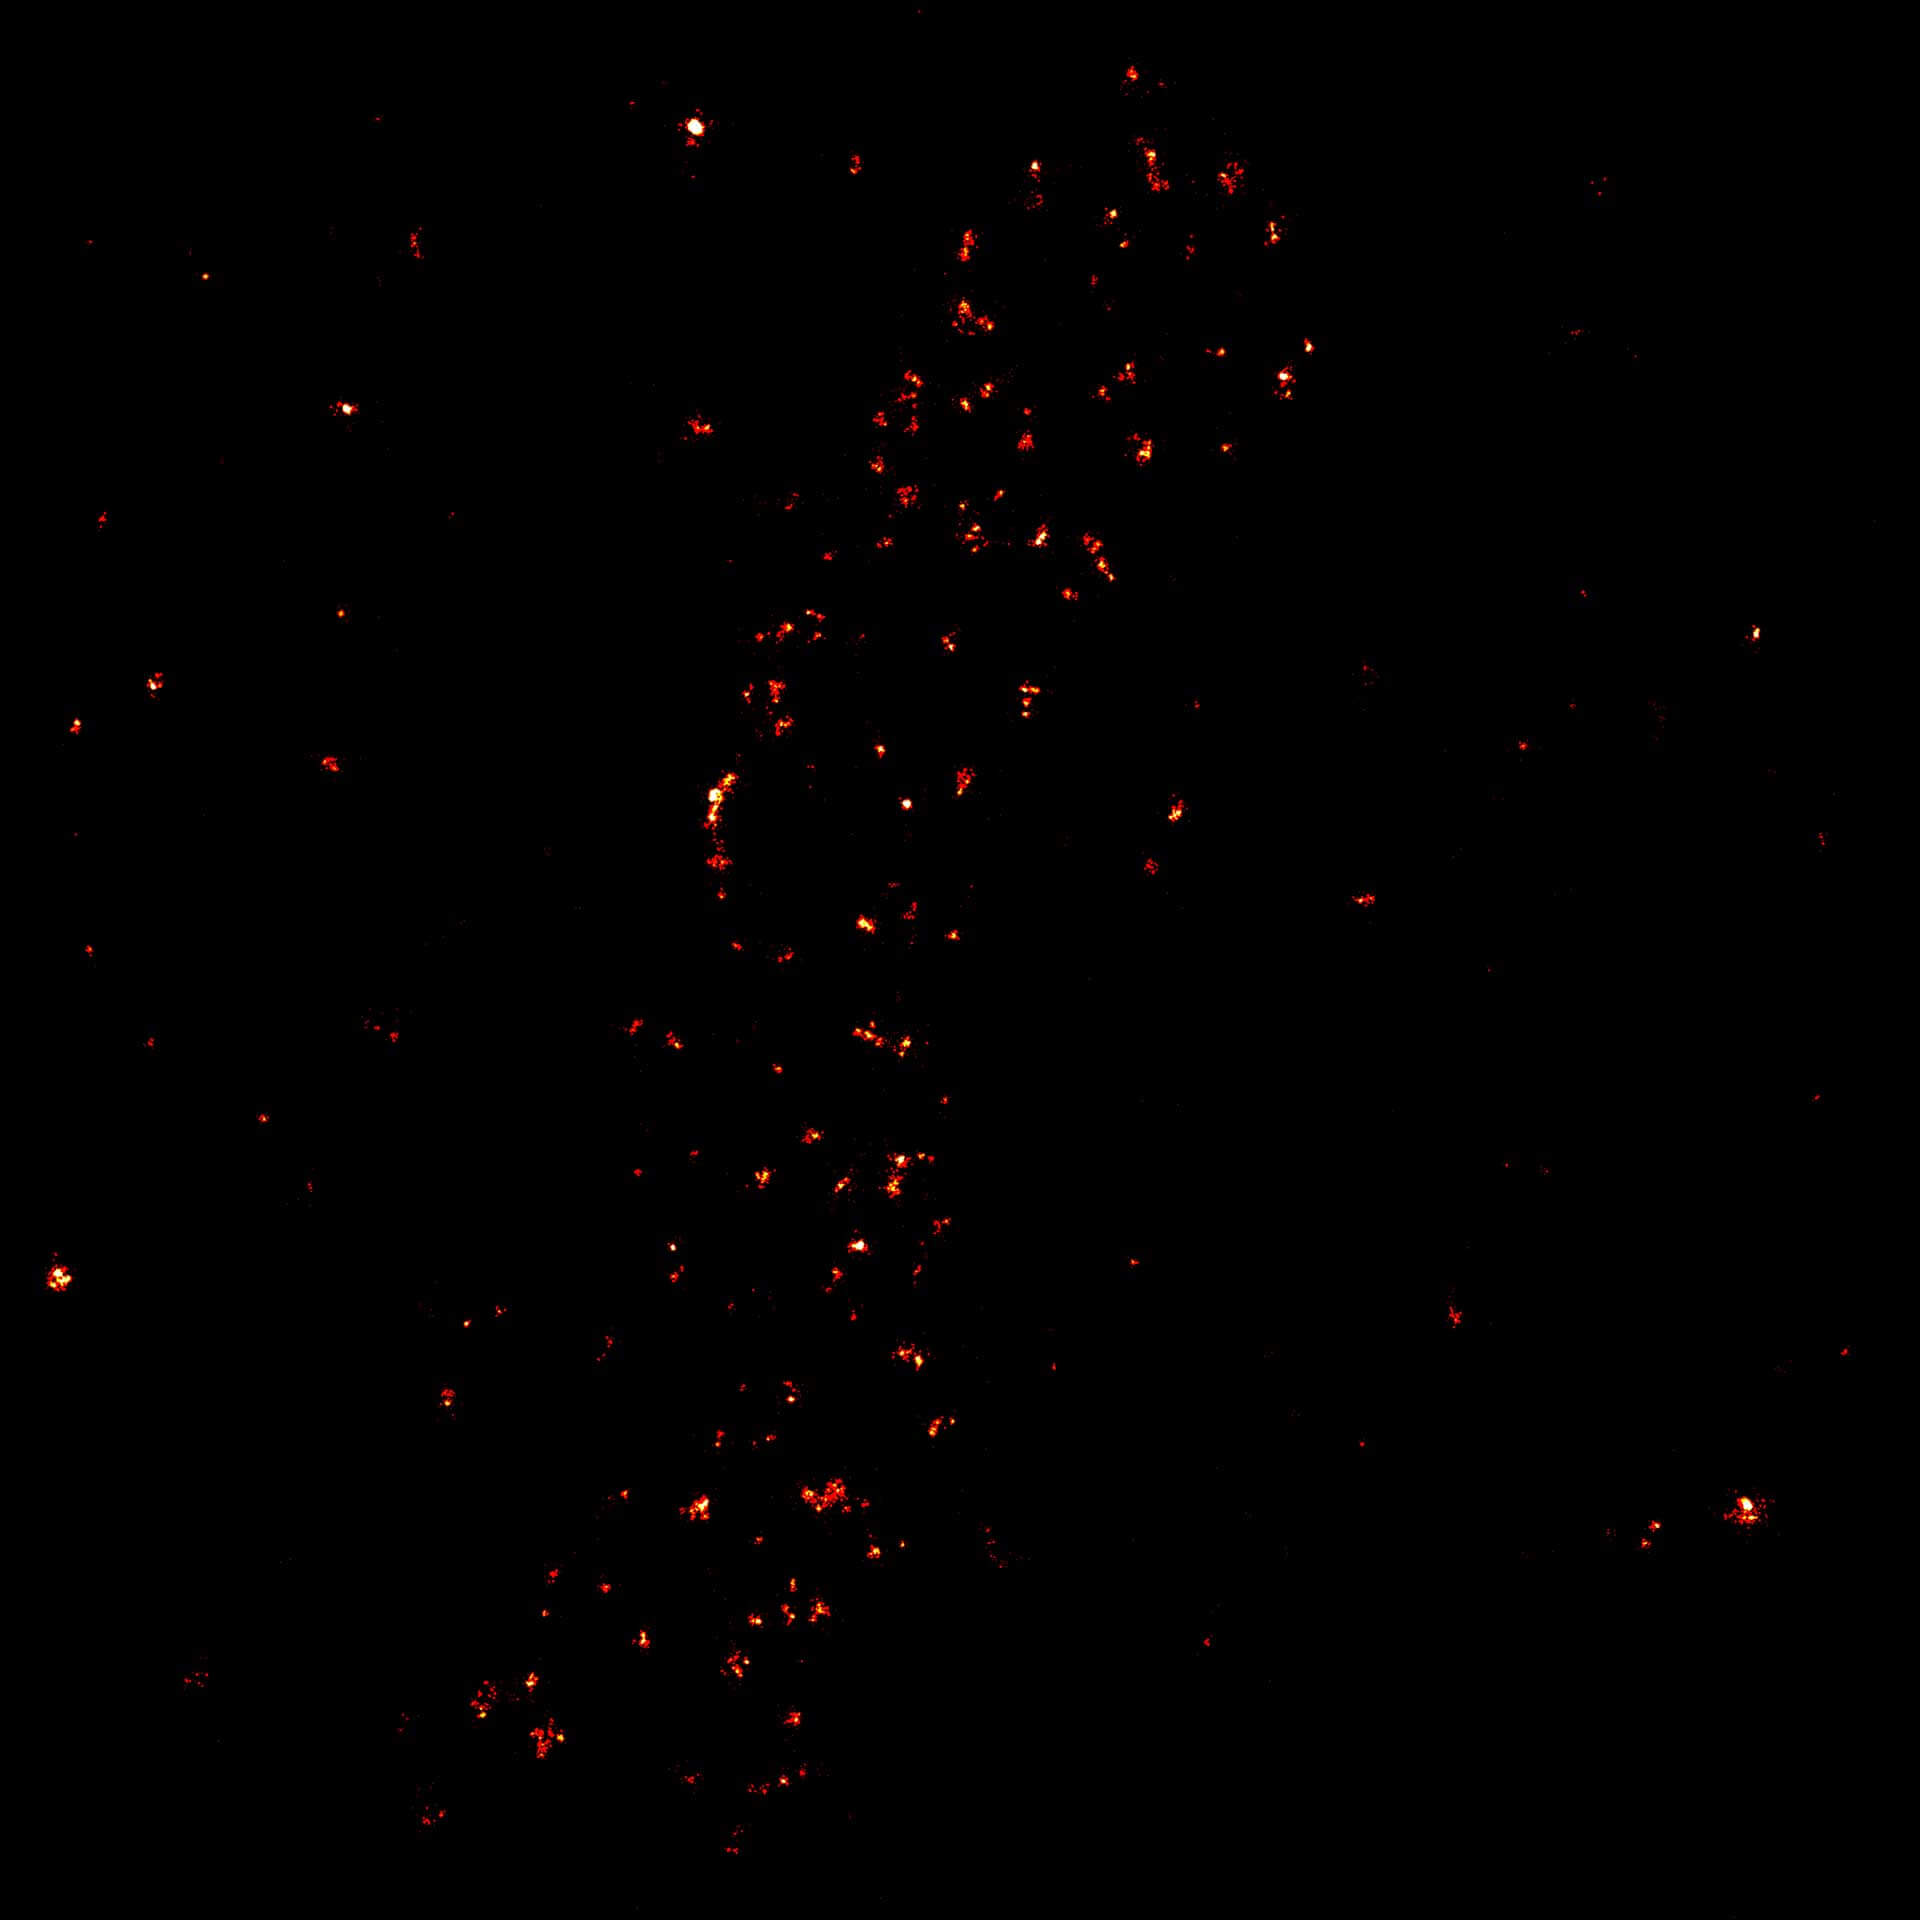
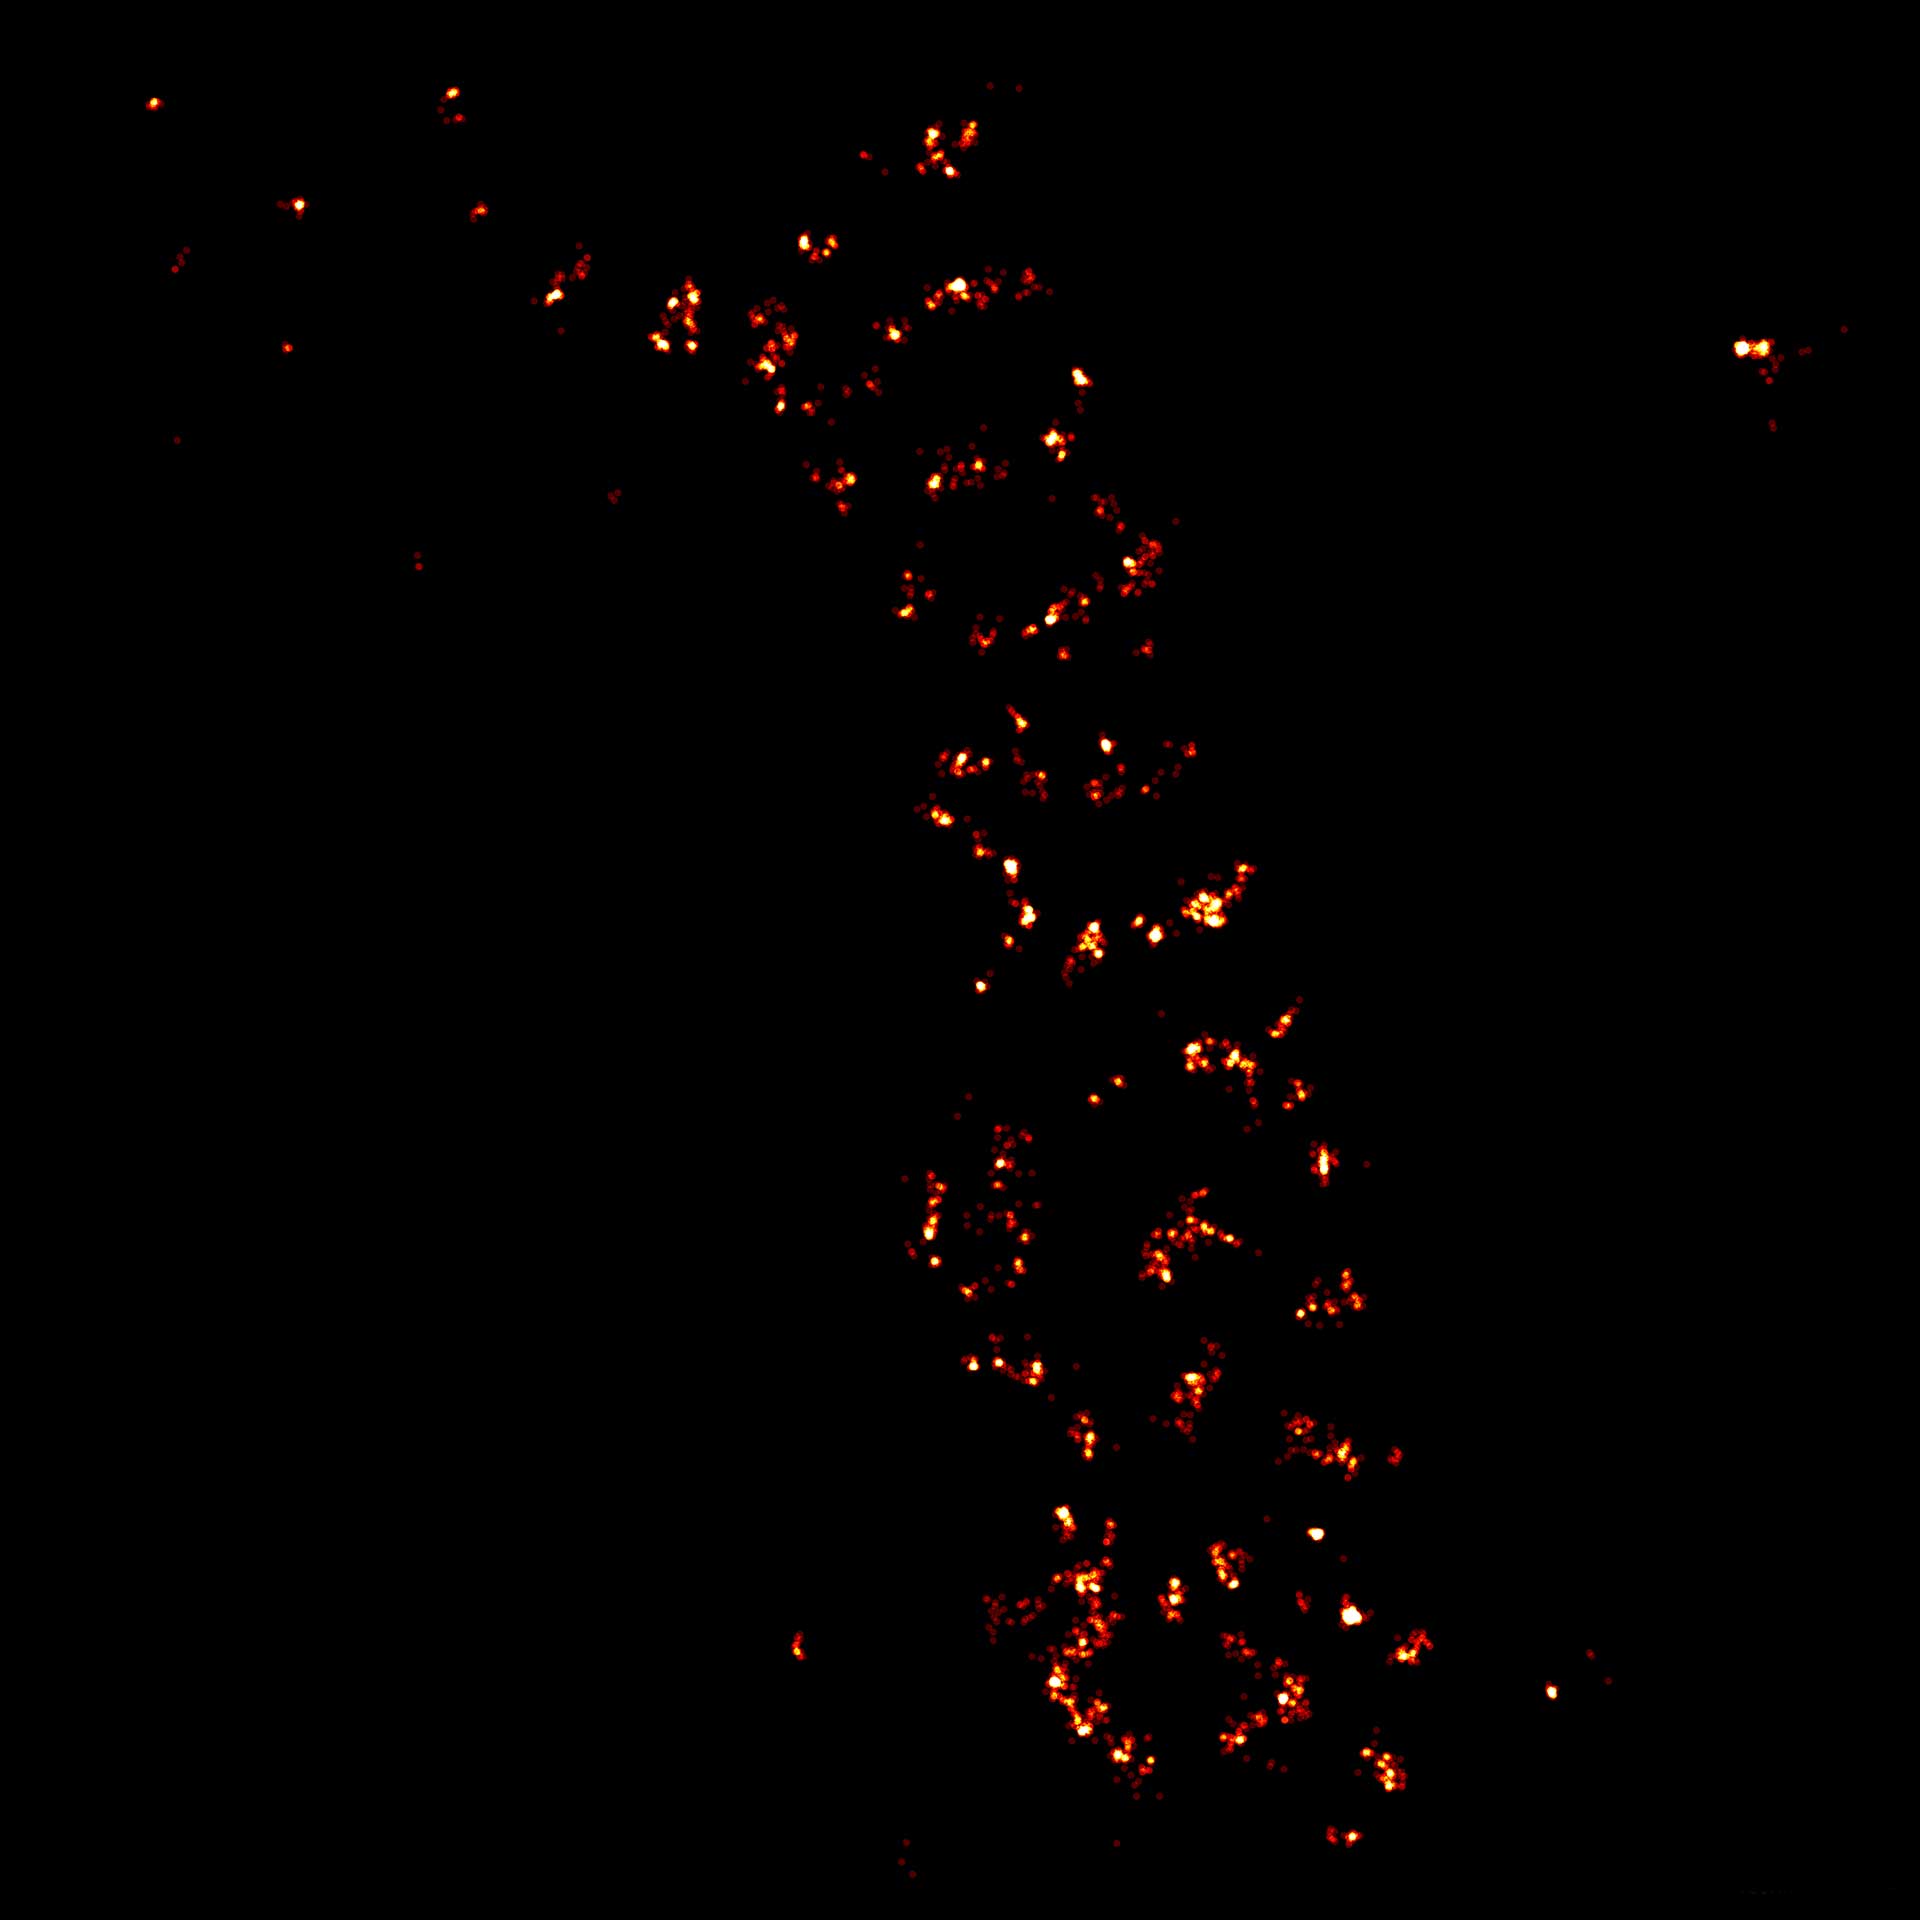
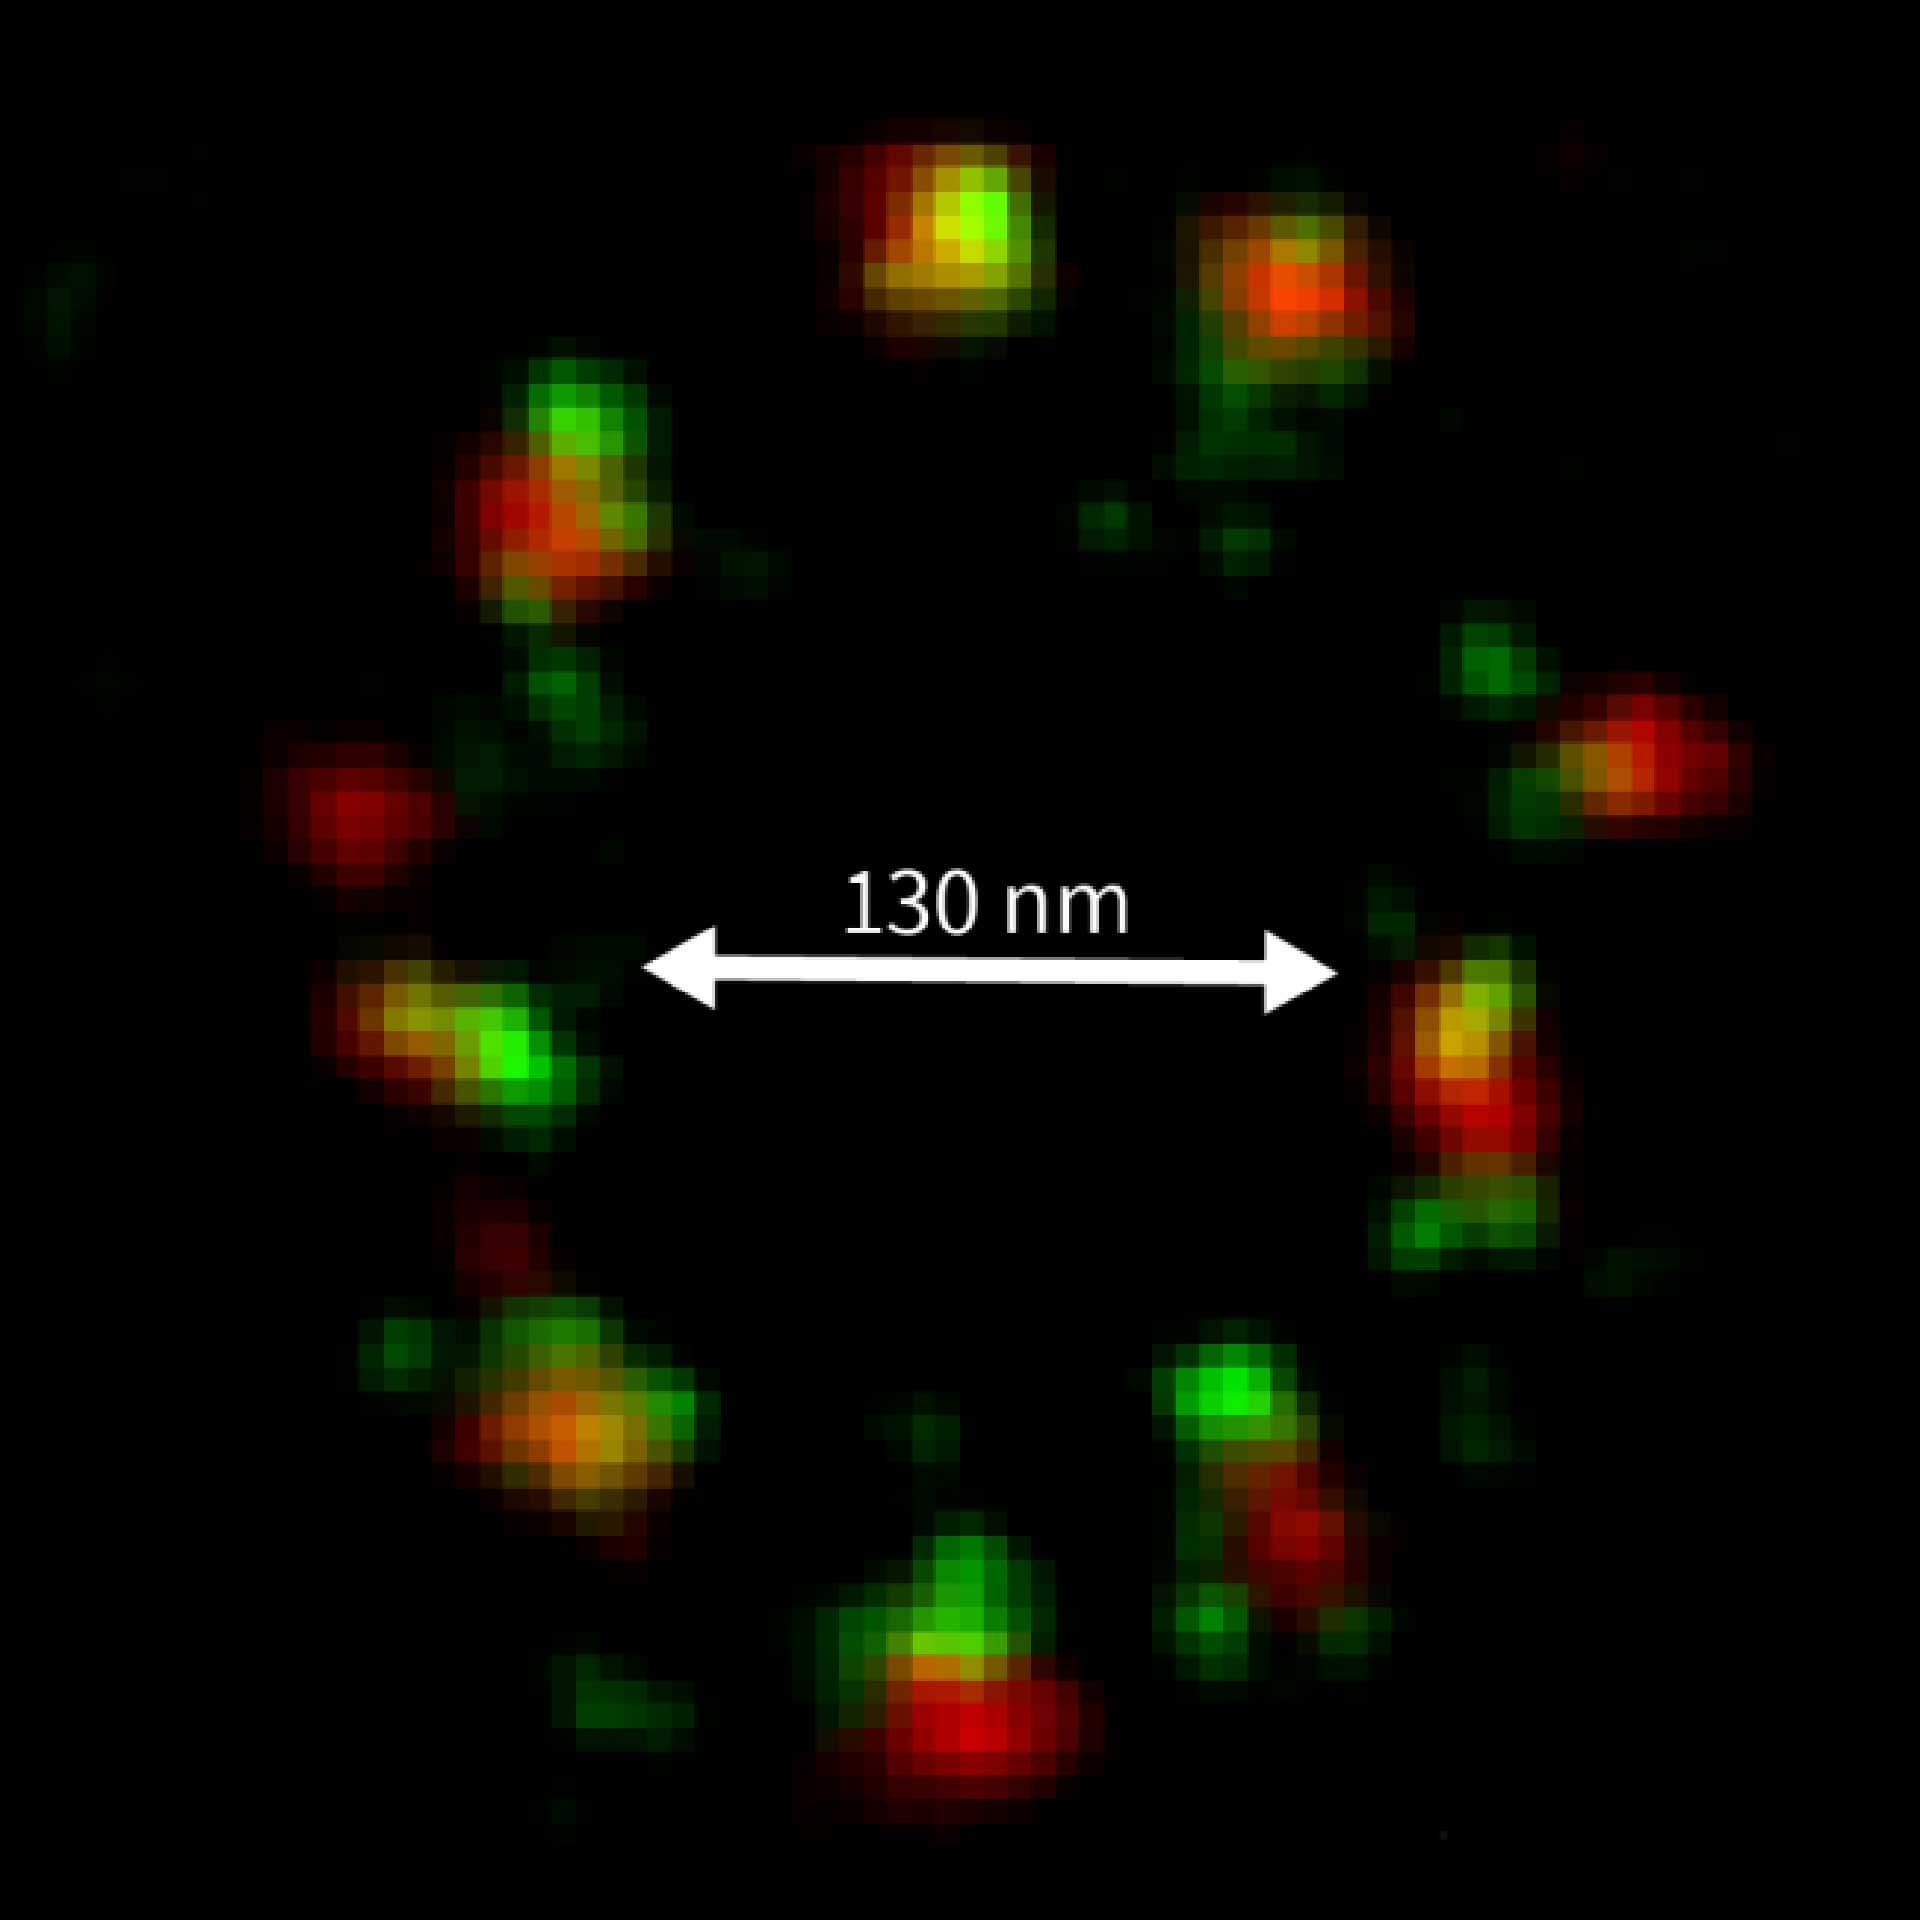
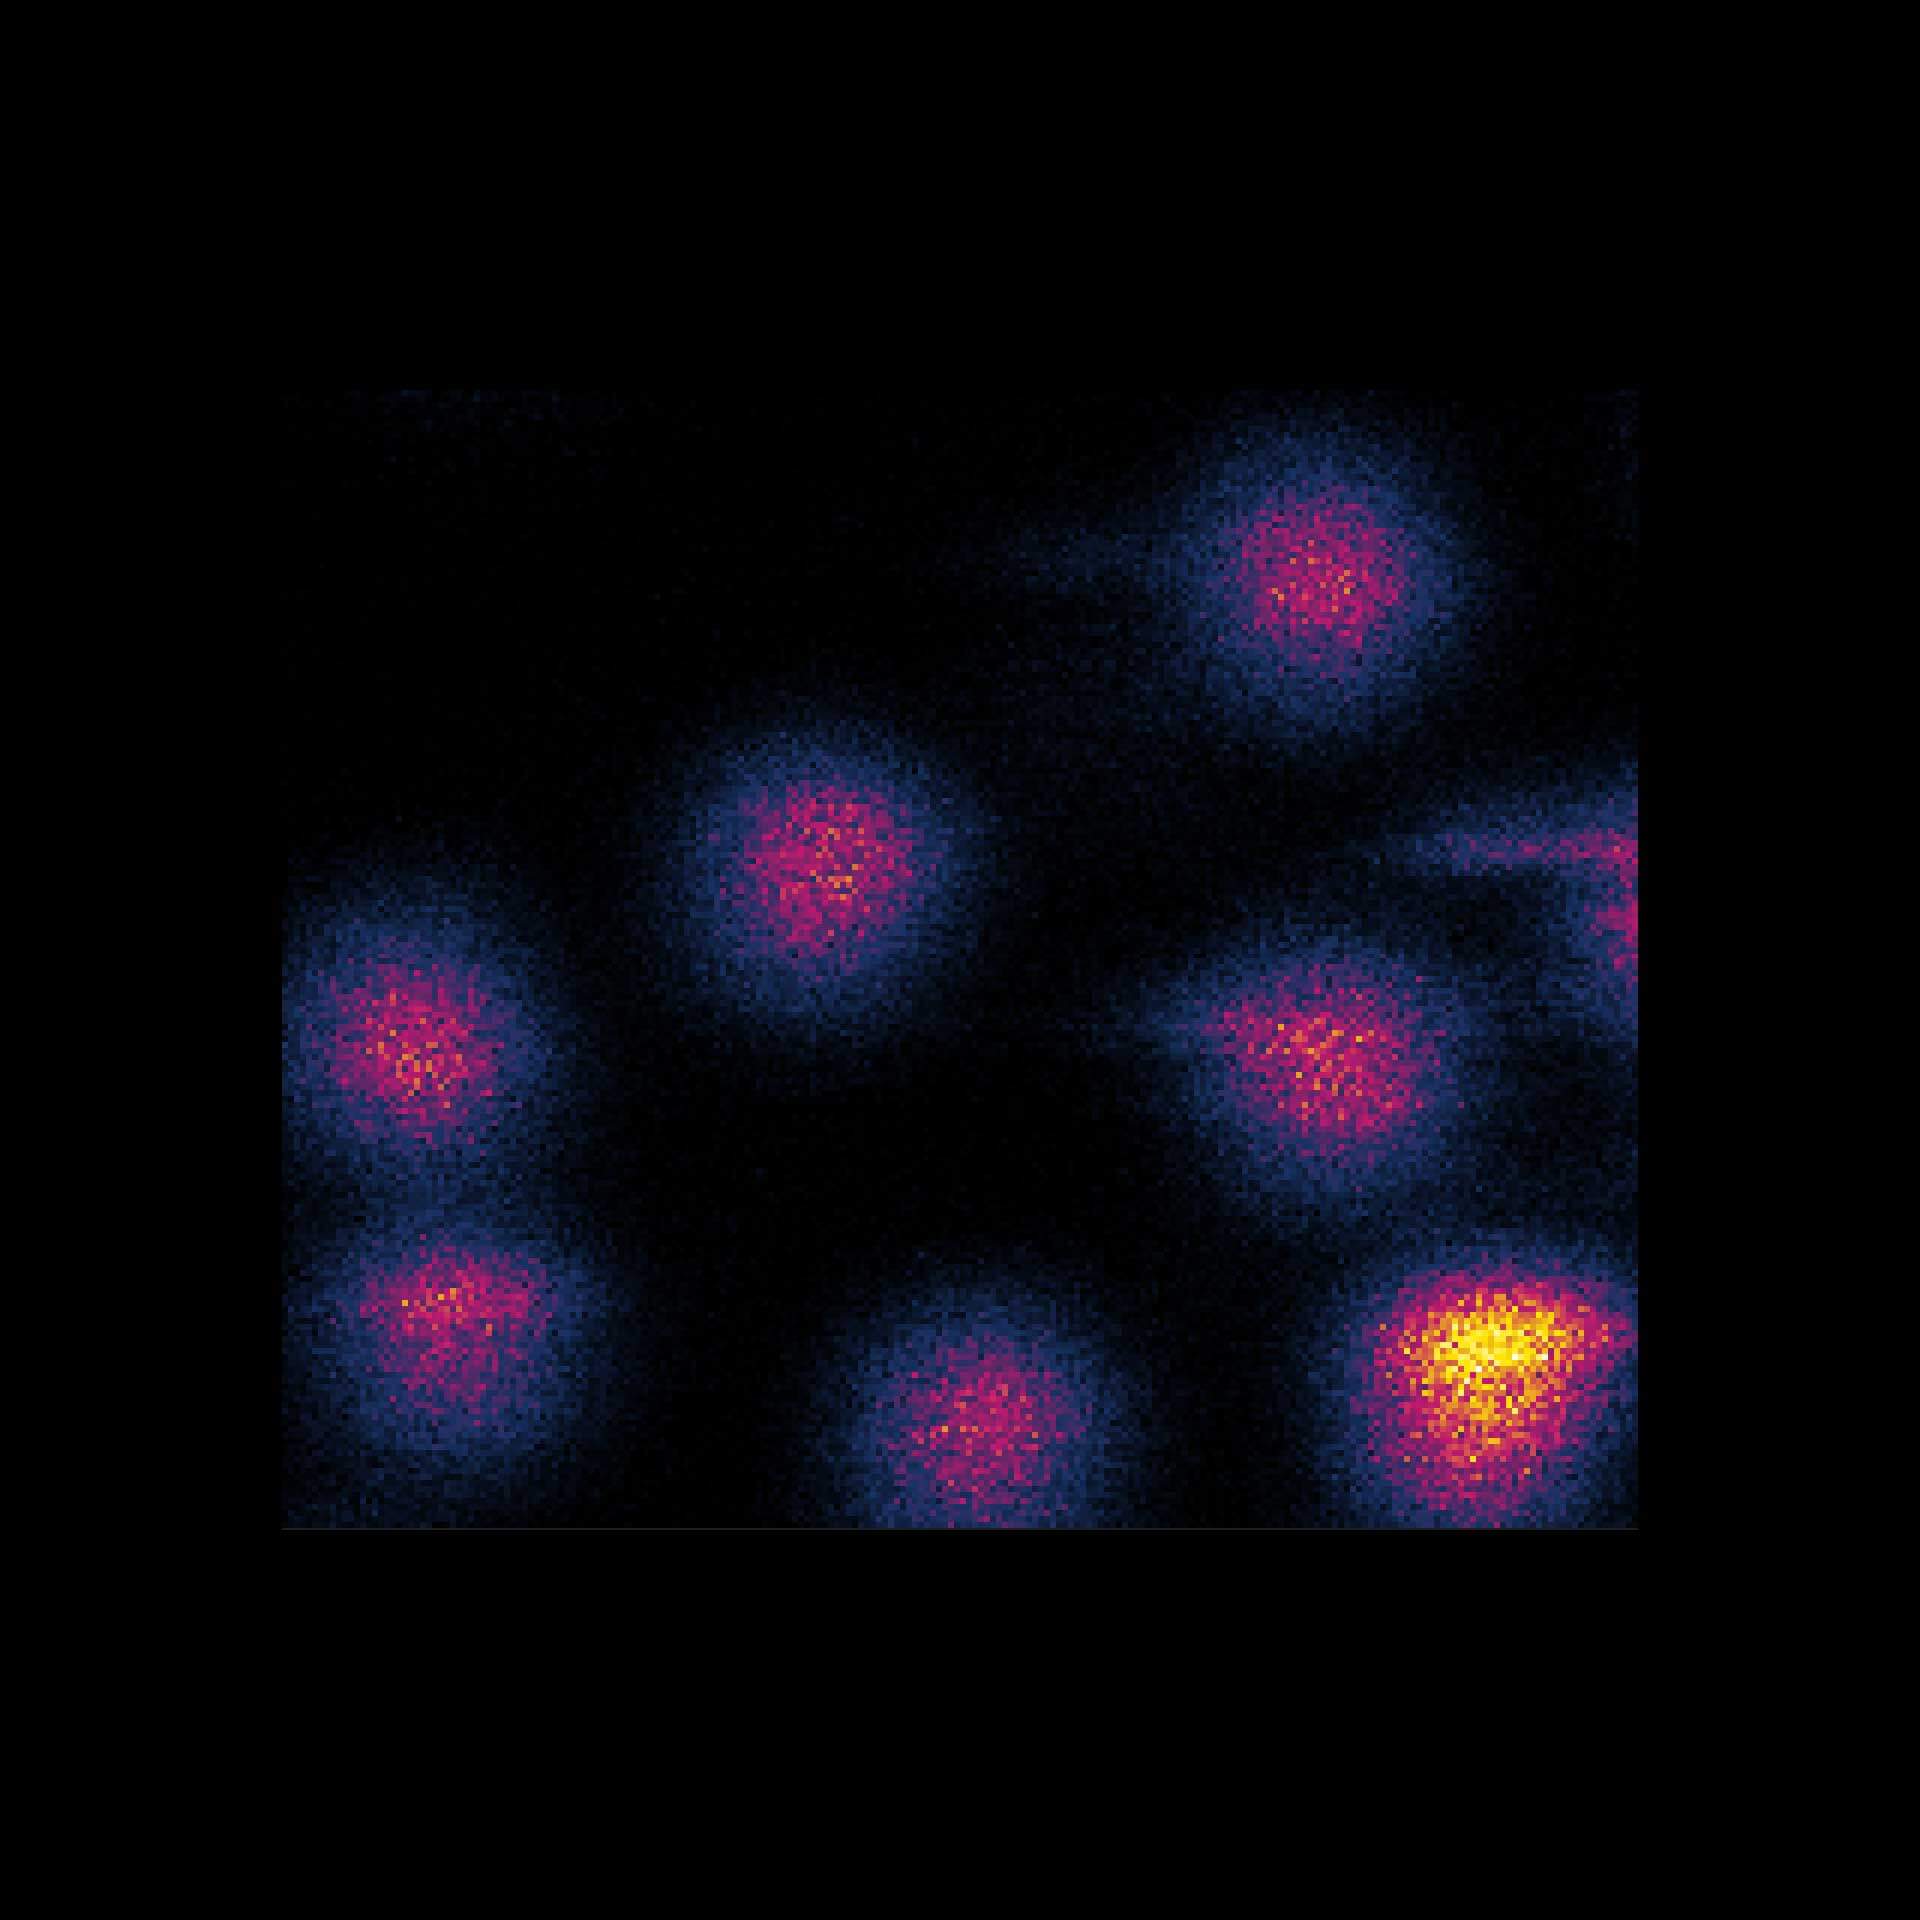
2D MINFLUX nanoscopy of the nuclear pore complex subunits. NUP96-SNAP/SNAP-Alexa Fluor 647 lend themselves as benchmark structures to test superresolution light microscopes. In contrast to confocal microscopy, 2D MINFLUX allows to visualize the shape and arrangement of individual subunits of the nuclear pore complex. Here, we reach localization precisions of ~2 nm in raw localization data.
Description
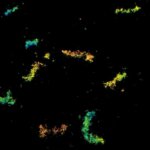
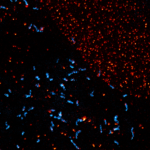
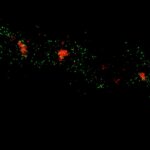
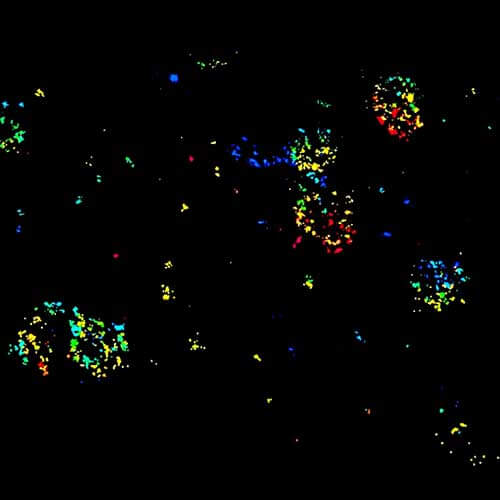
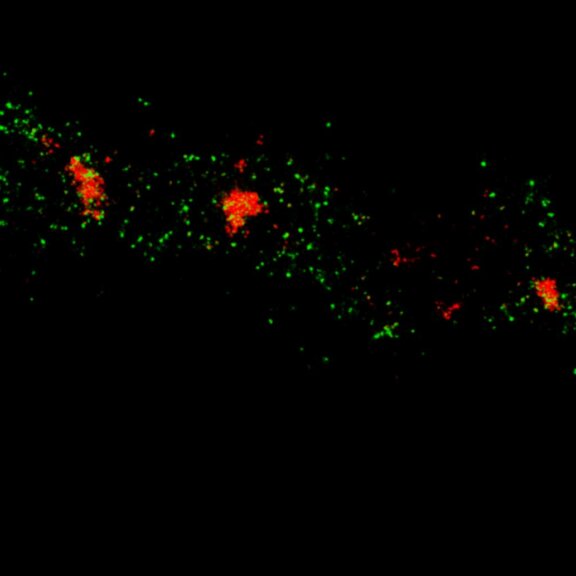
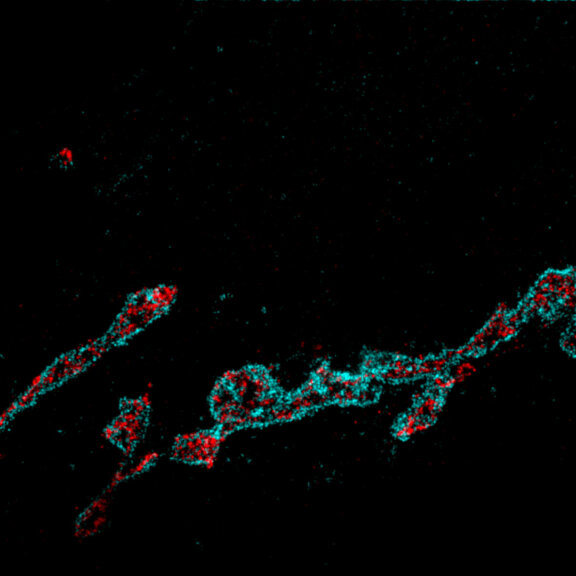
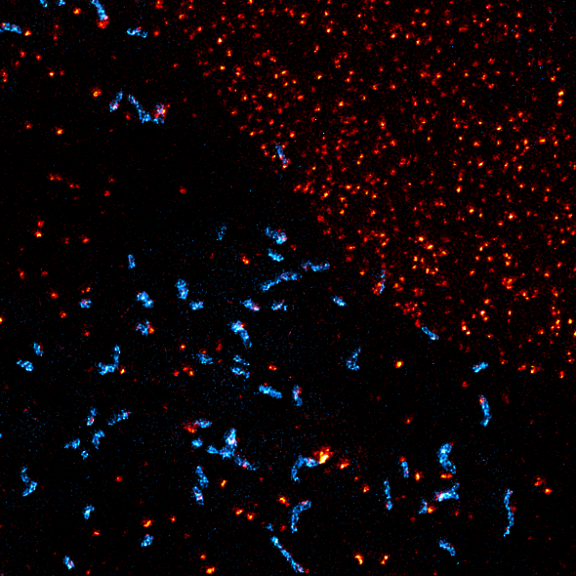
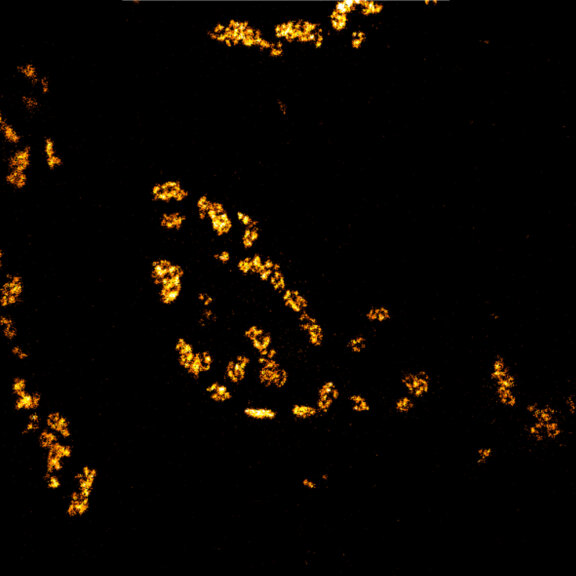
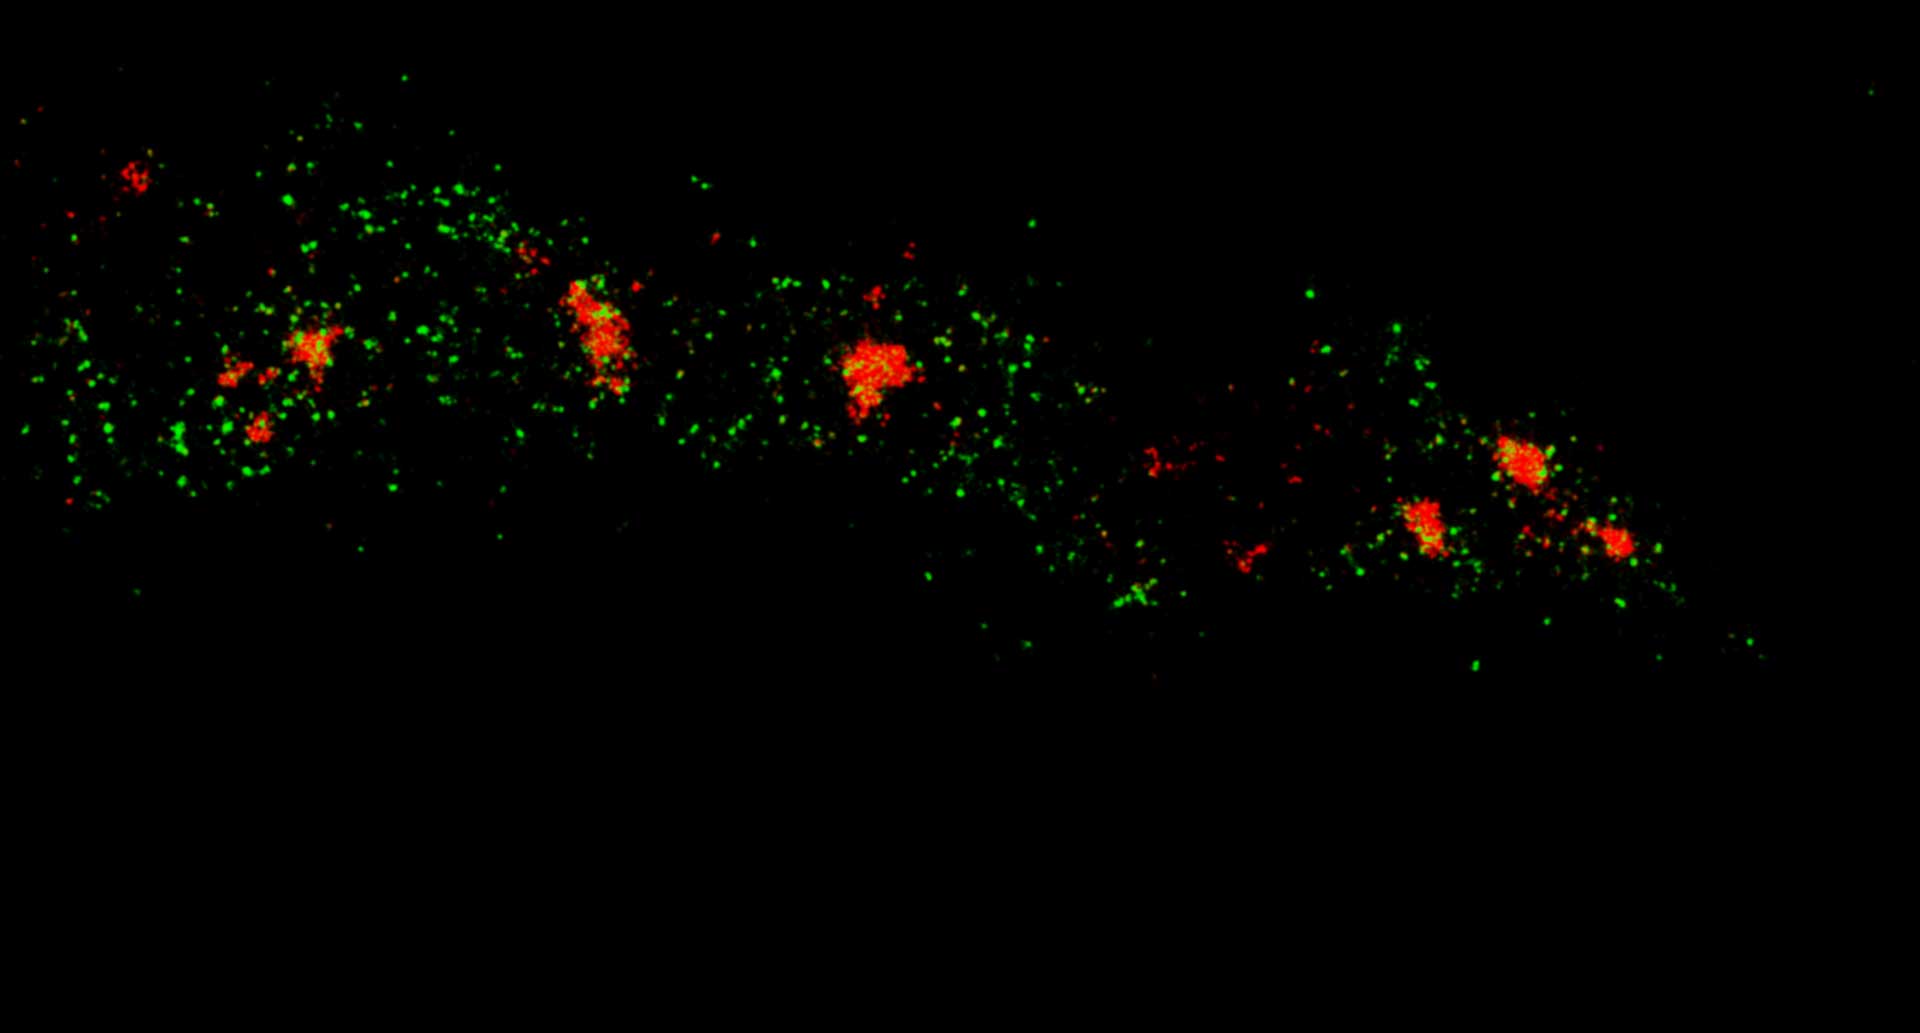
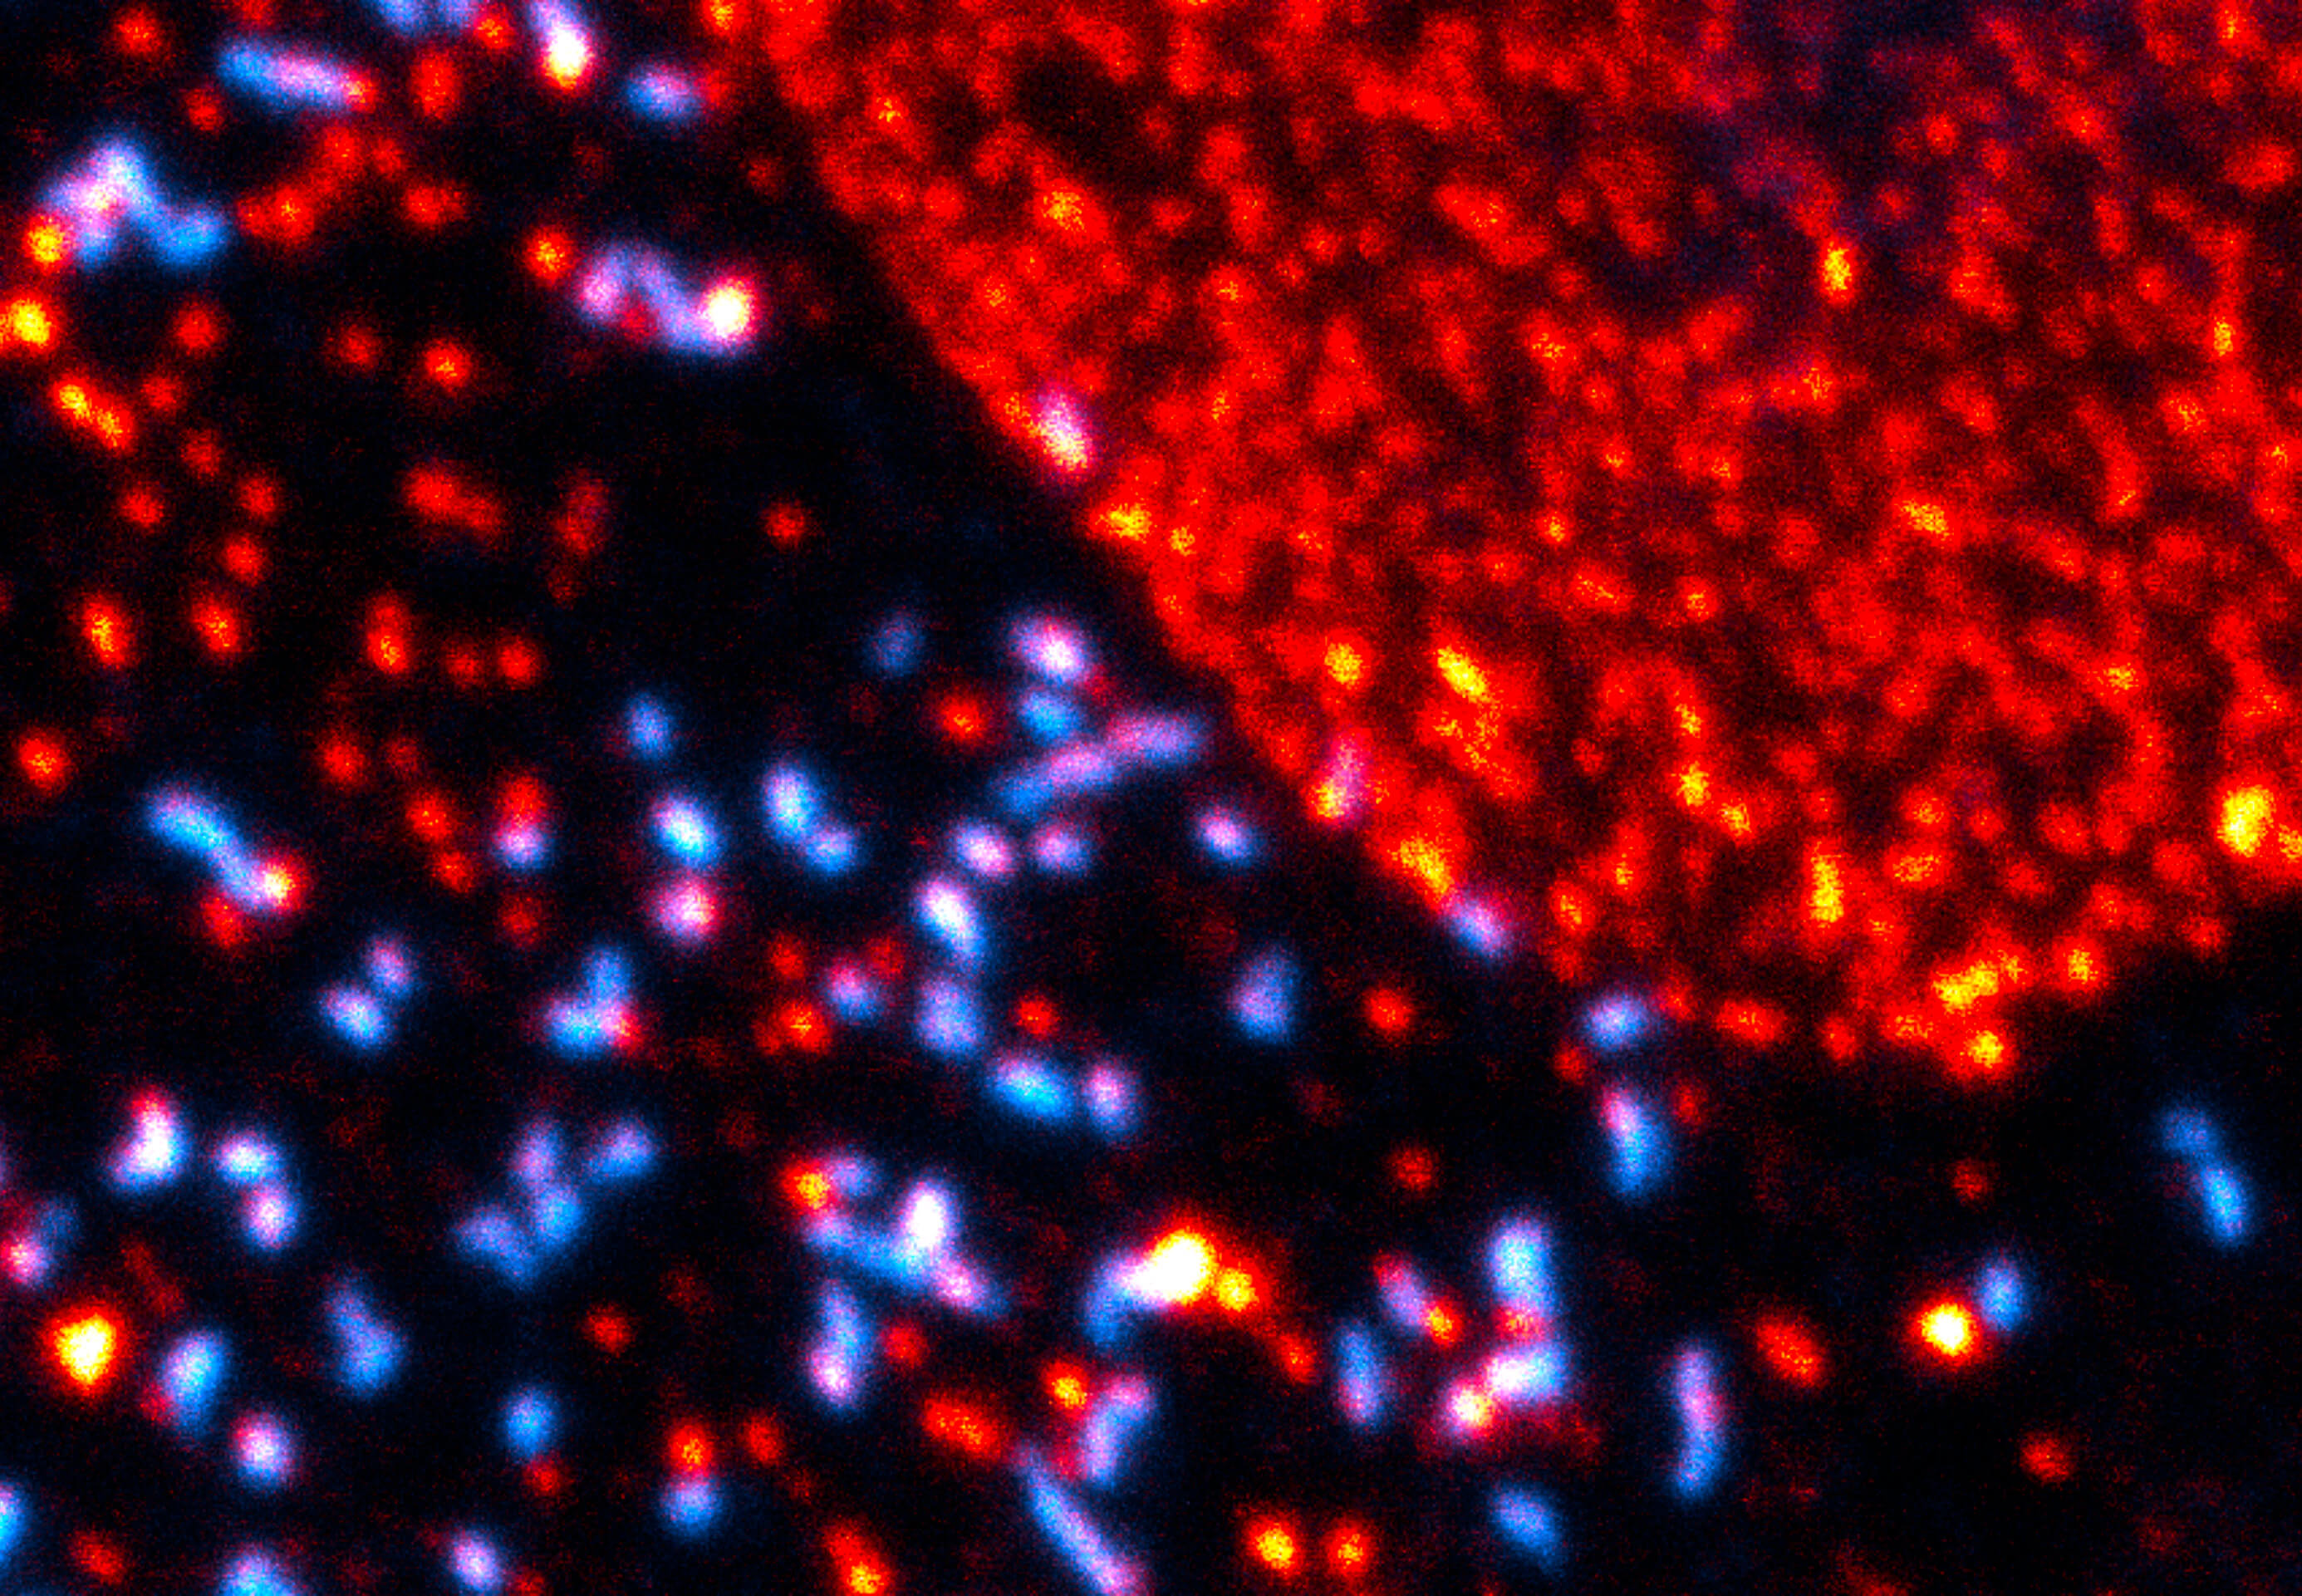
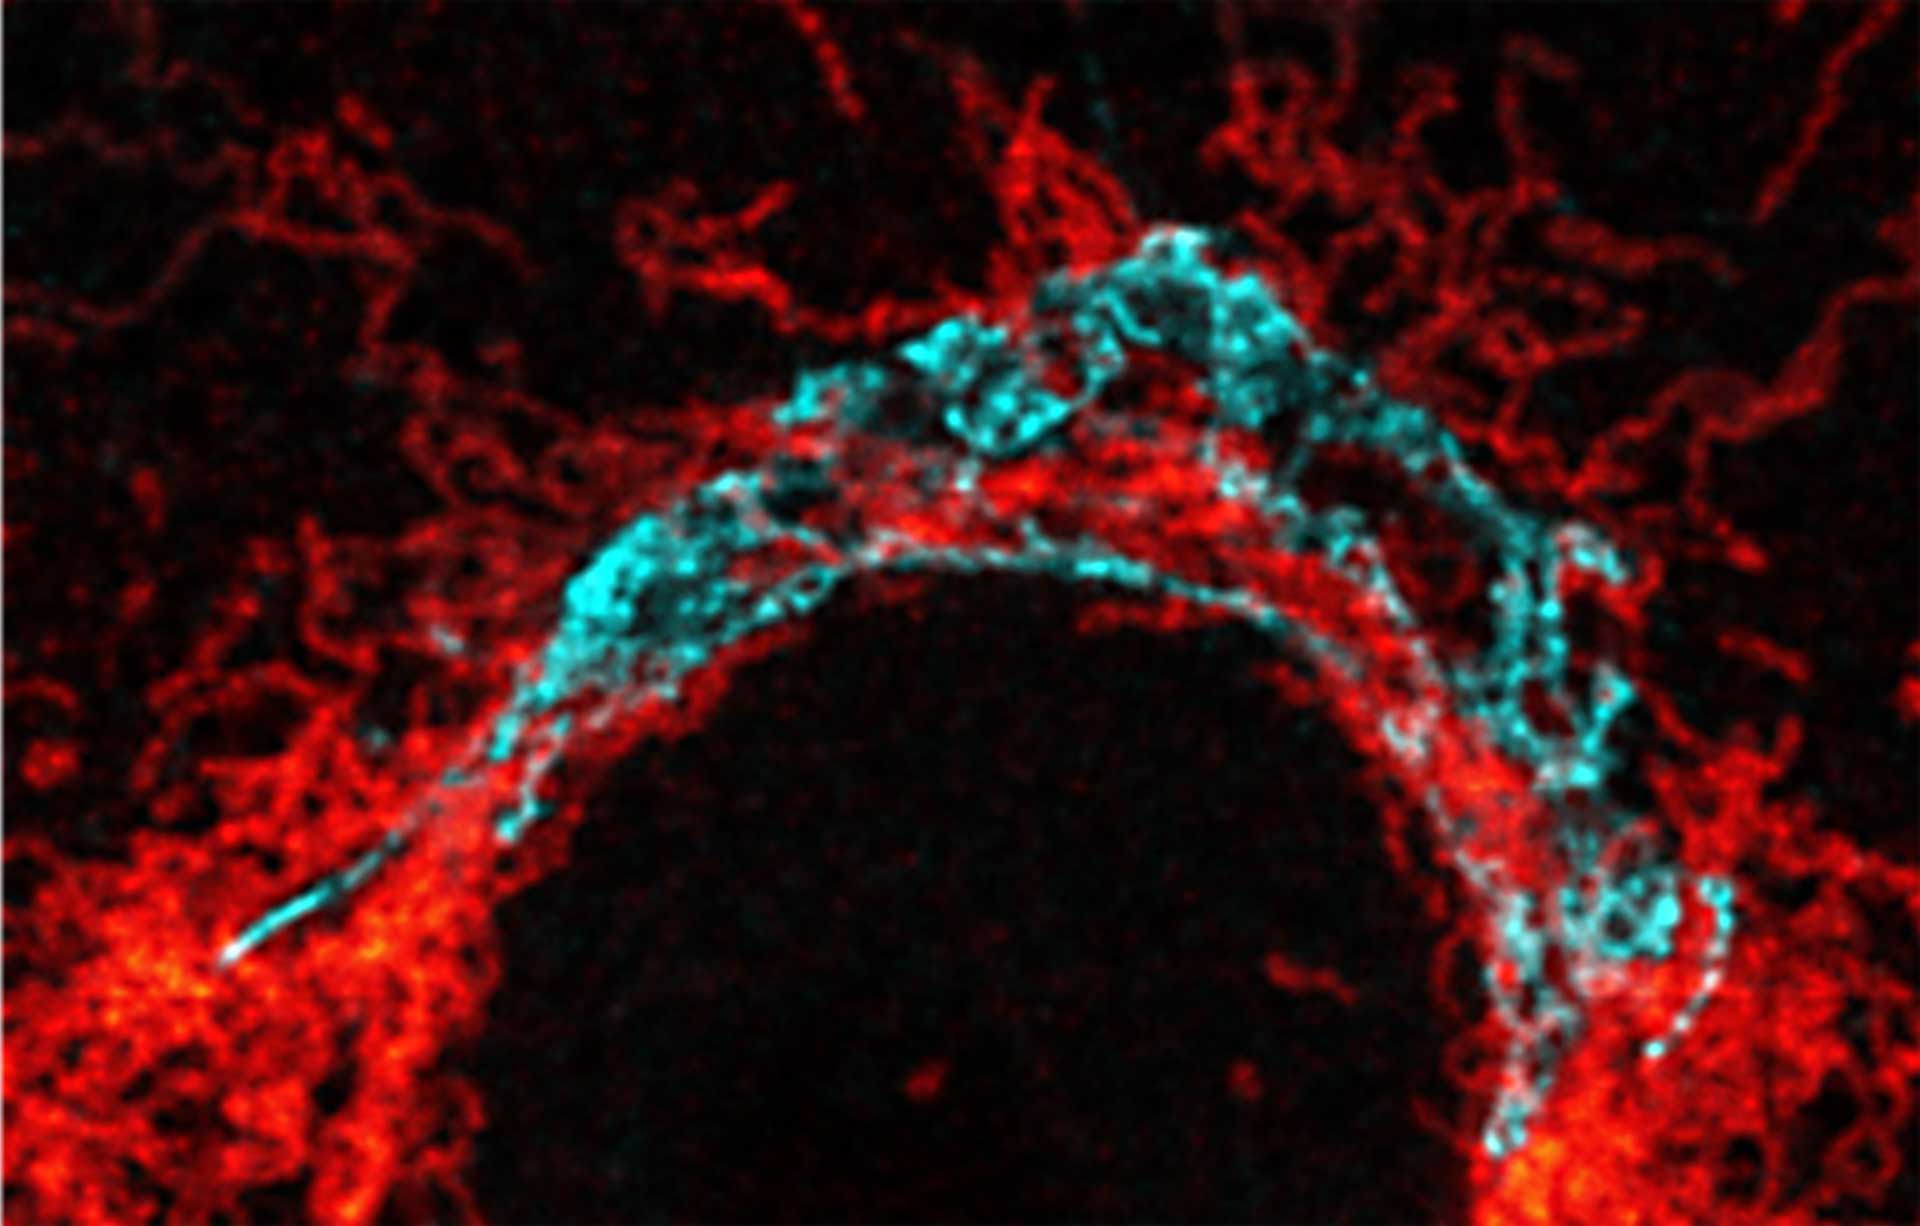
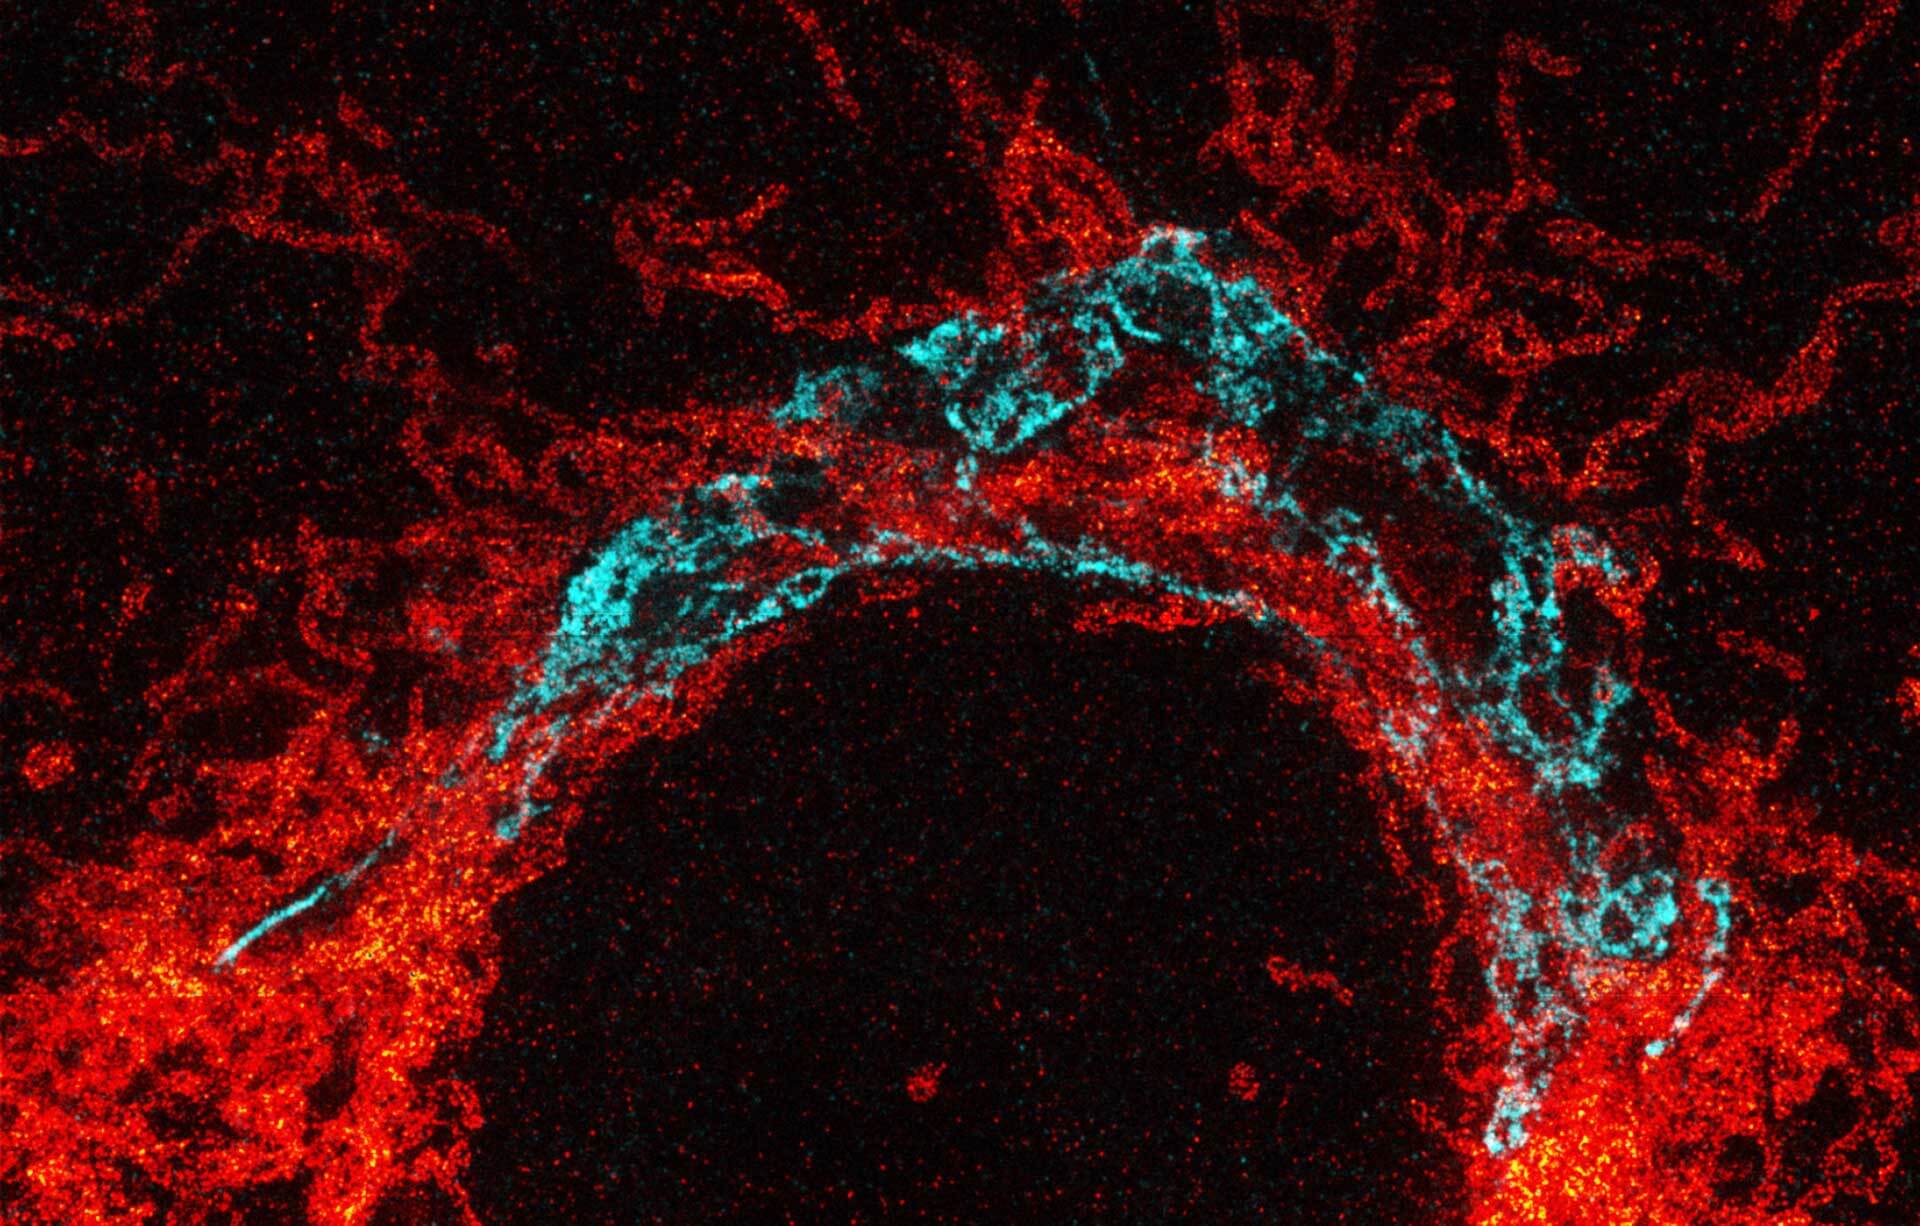
Two-color MINFLUX on mitochondria samples. The mitochondrial proteins TOM20 (green) and mtDNA (red) were labeled in mammalian cells with indirect immunofluorescence using secondary antibodies coupled to sCy5 and CF680. Two-color confocal (A) and MINFLUX (B) was performed using a ratiometric detection strategy. Please note that the labeling density of both structures is highly dissimilar. For TOM20 single proteins are labeled in the mitochondrial membrane, whereas numerous binding sites are decorated in the mtDNA. MINFLUX enables the visualization and separation of both structures.
Description
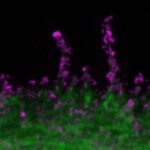
Confocal and 2D STED imaging of dendrites in brain slices. GFP-tagged proteins were expressed and immunolabelled using primary antibodies against GFP and secondary antibodies coupled to abberior STAR 635P.
Sample was prepared by O. Kaplan and H. Kawabe @ MPI of Experimental Medicine, Göttingen, Germany.

Description
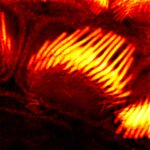
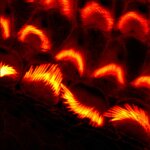
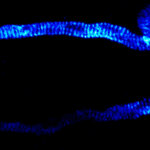
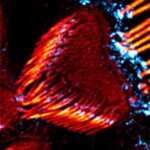
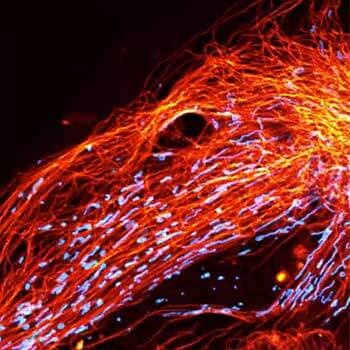
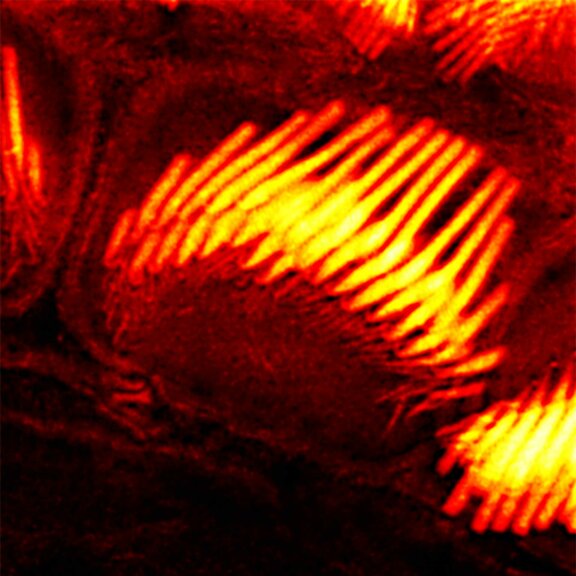
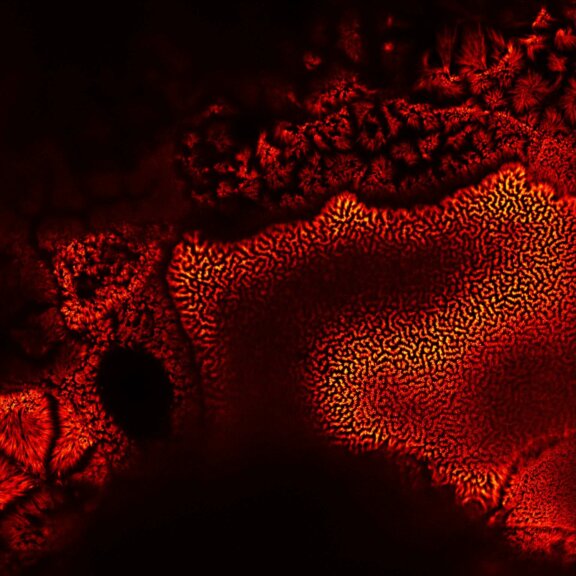
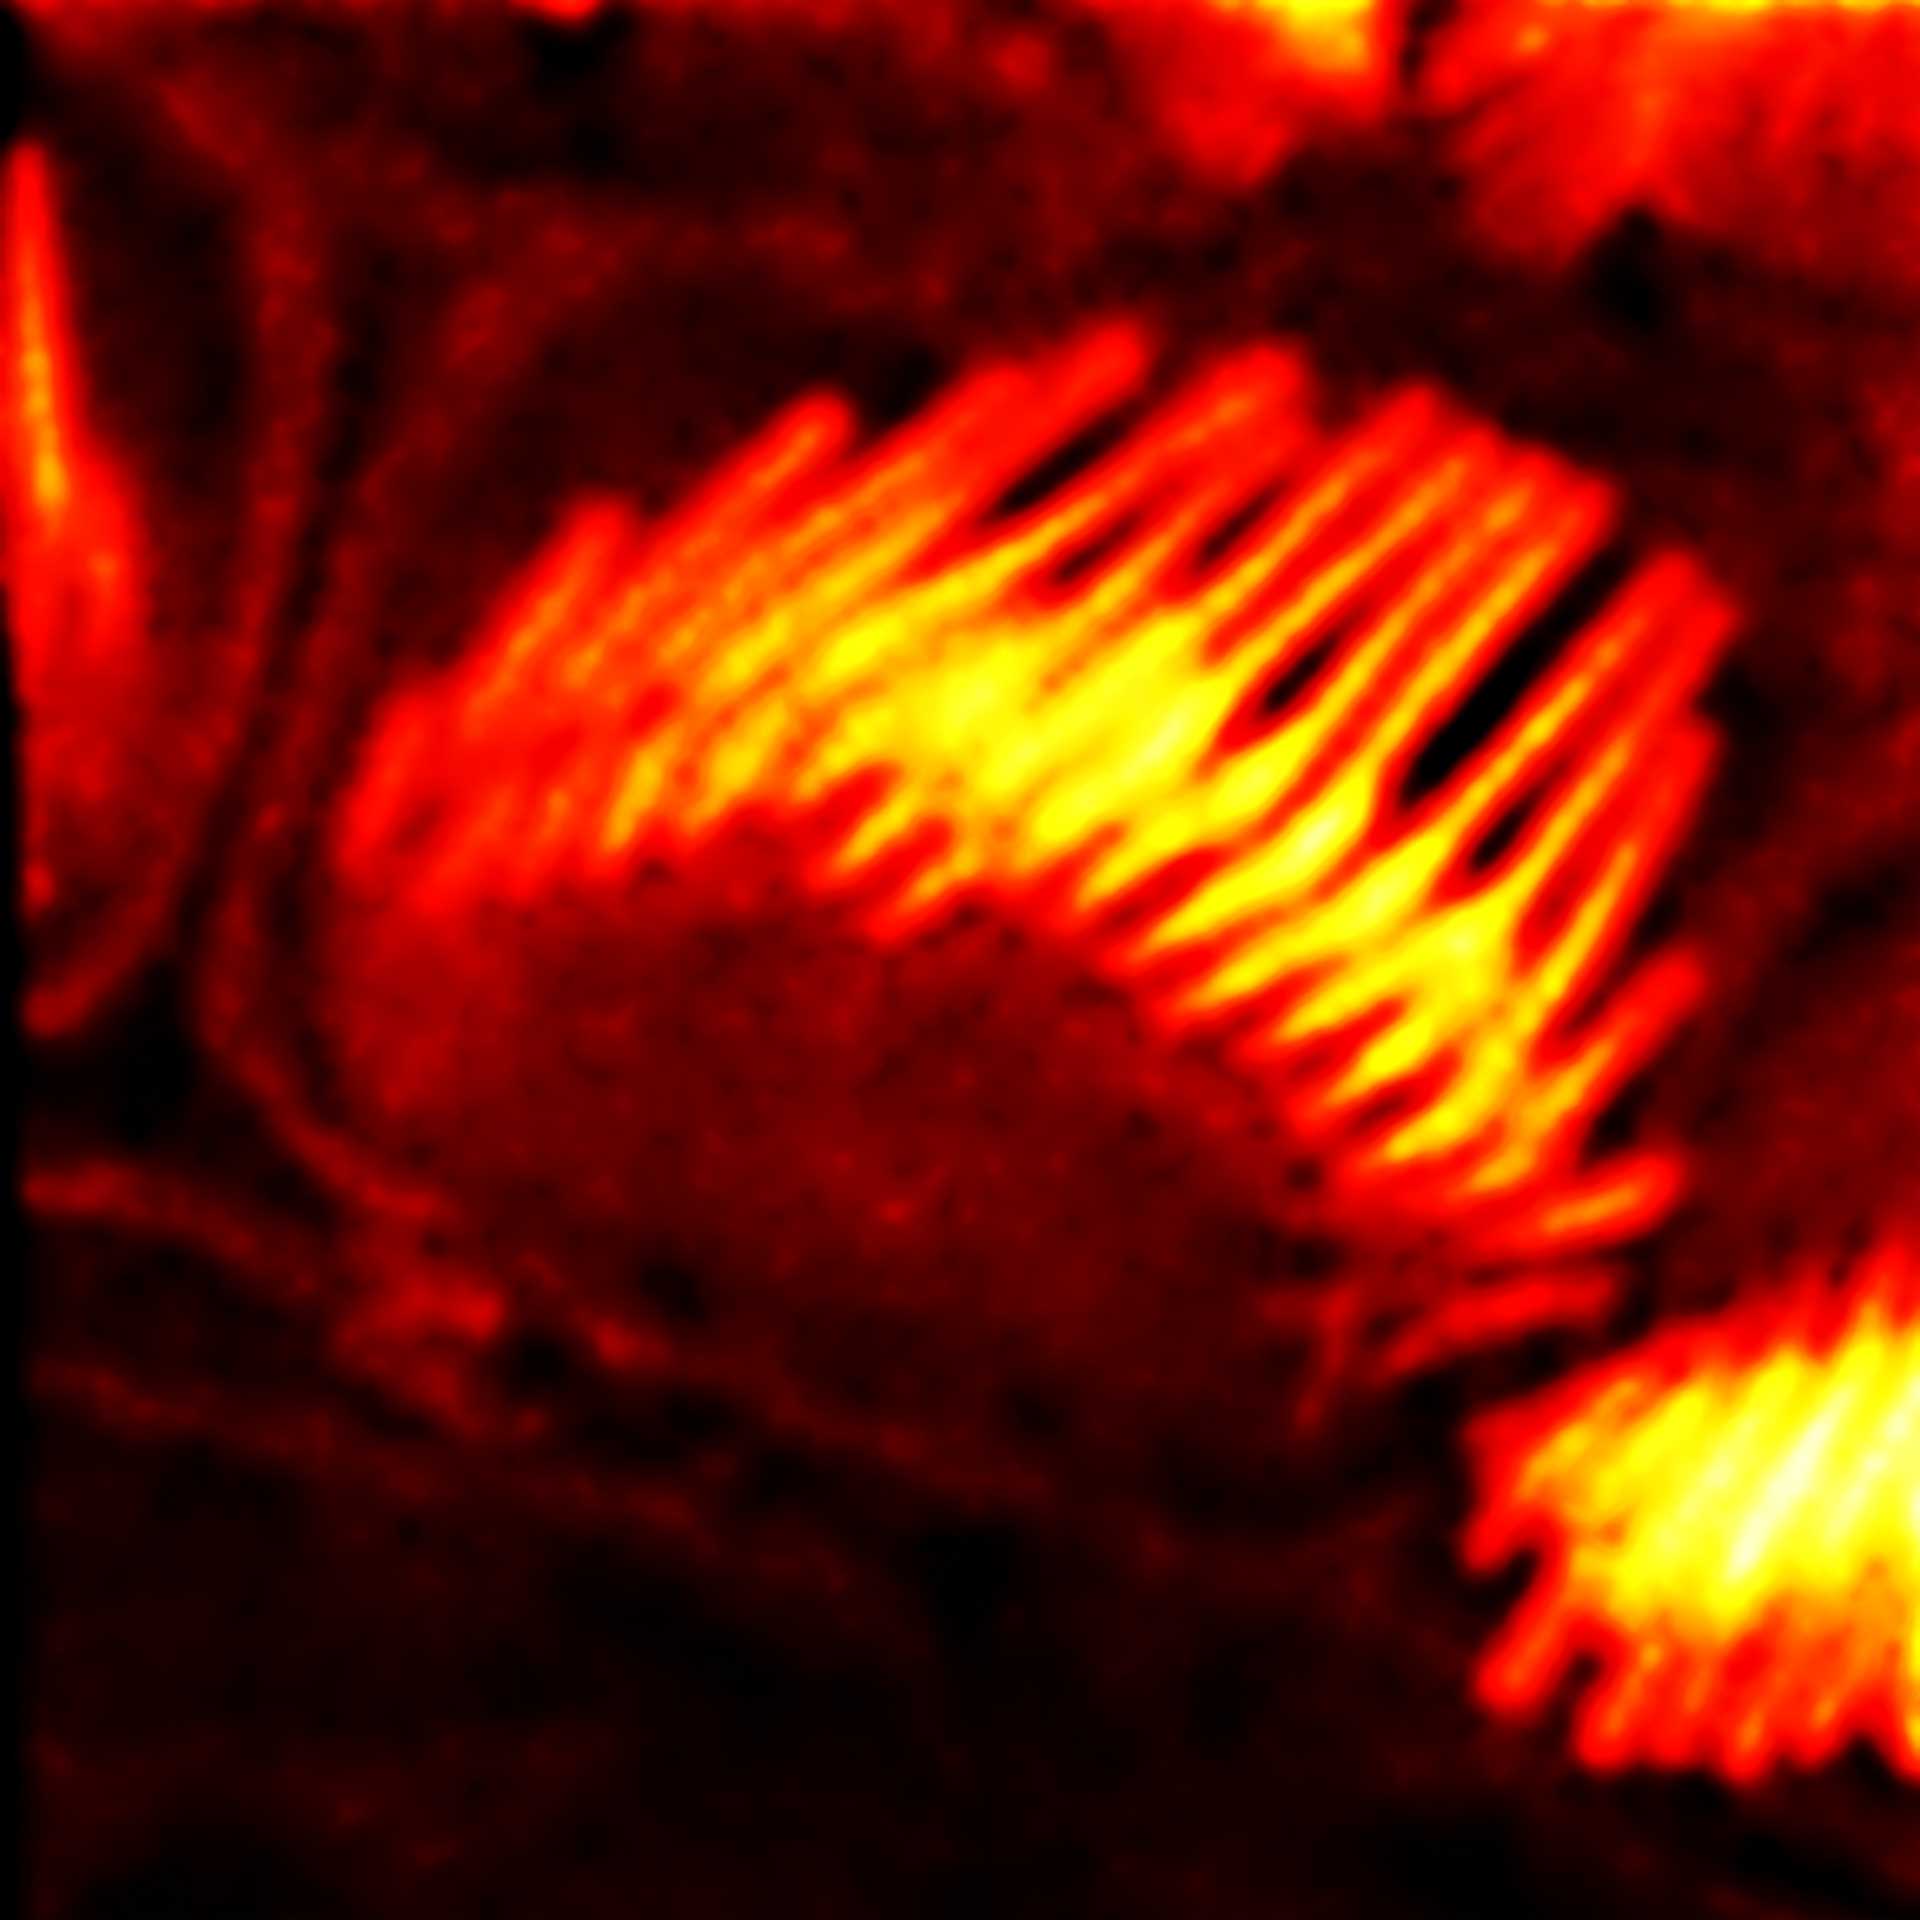
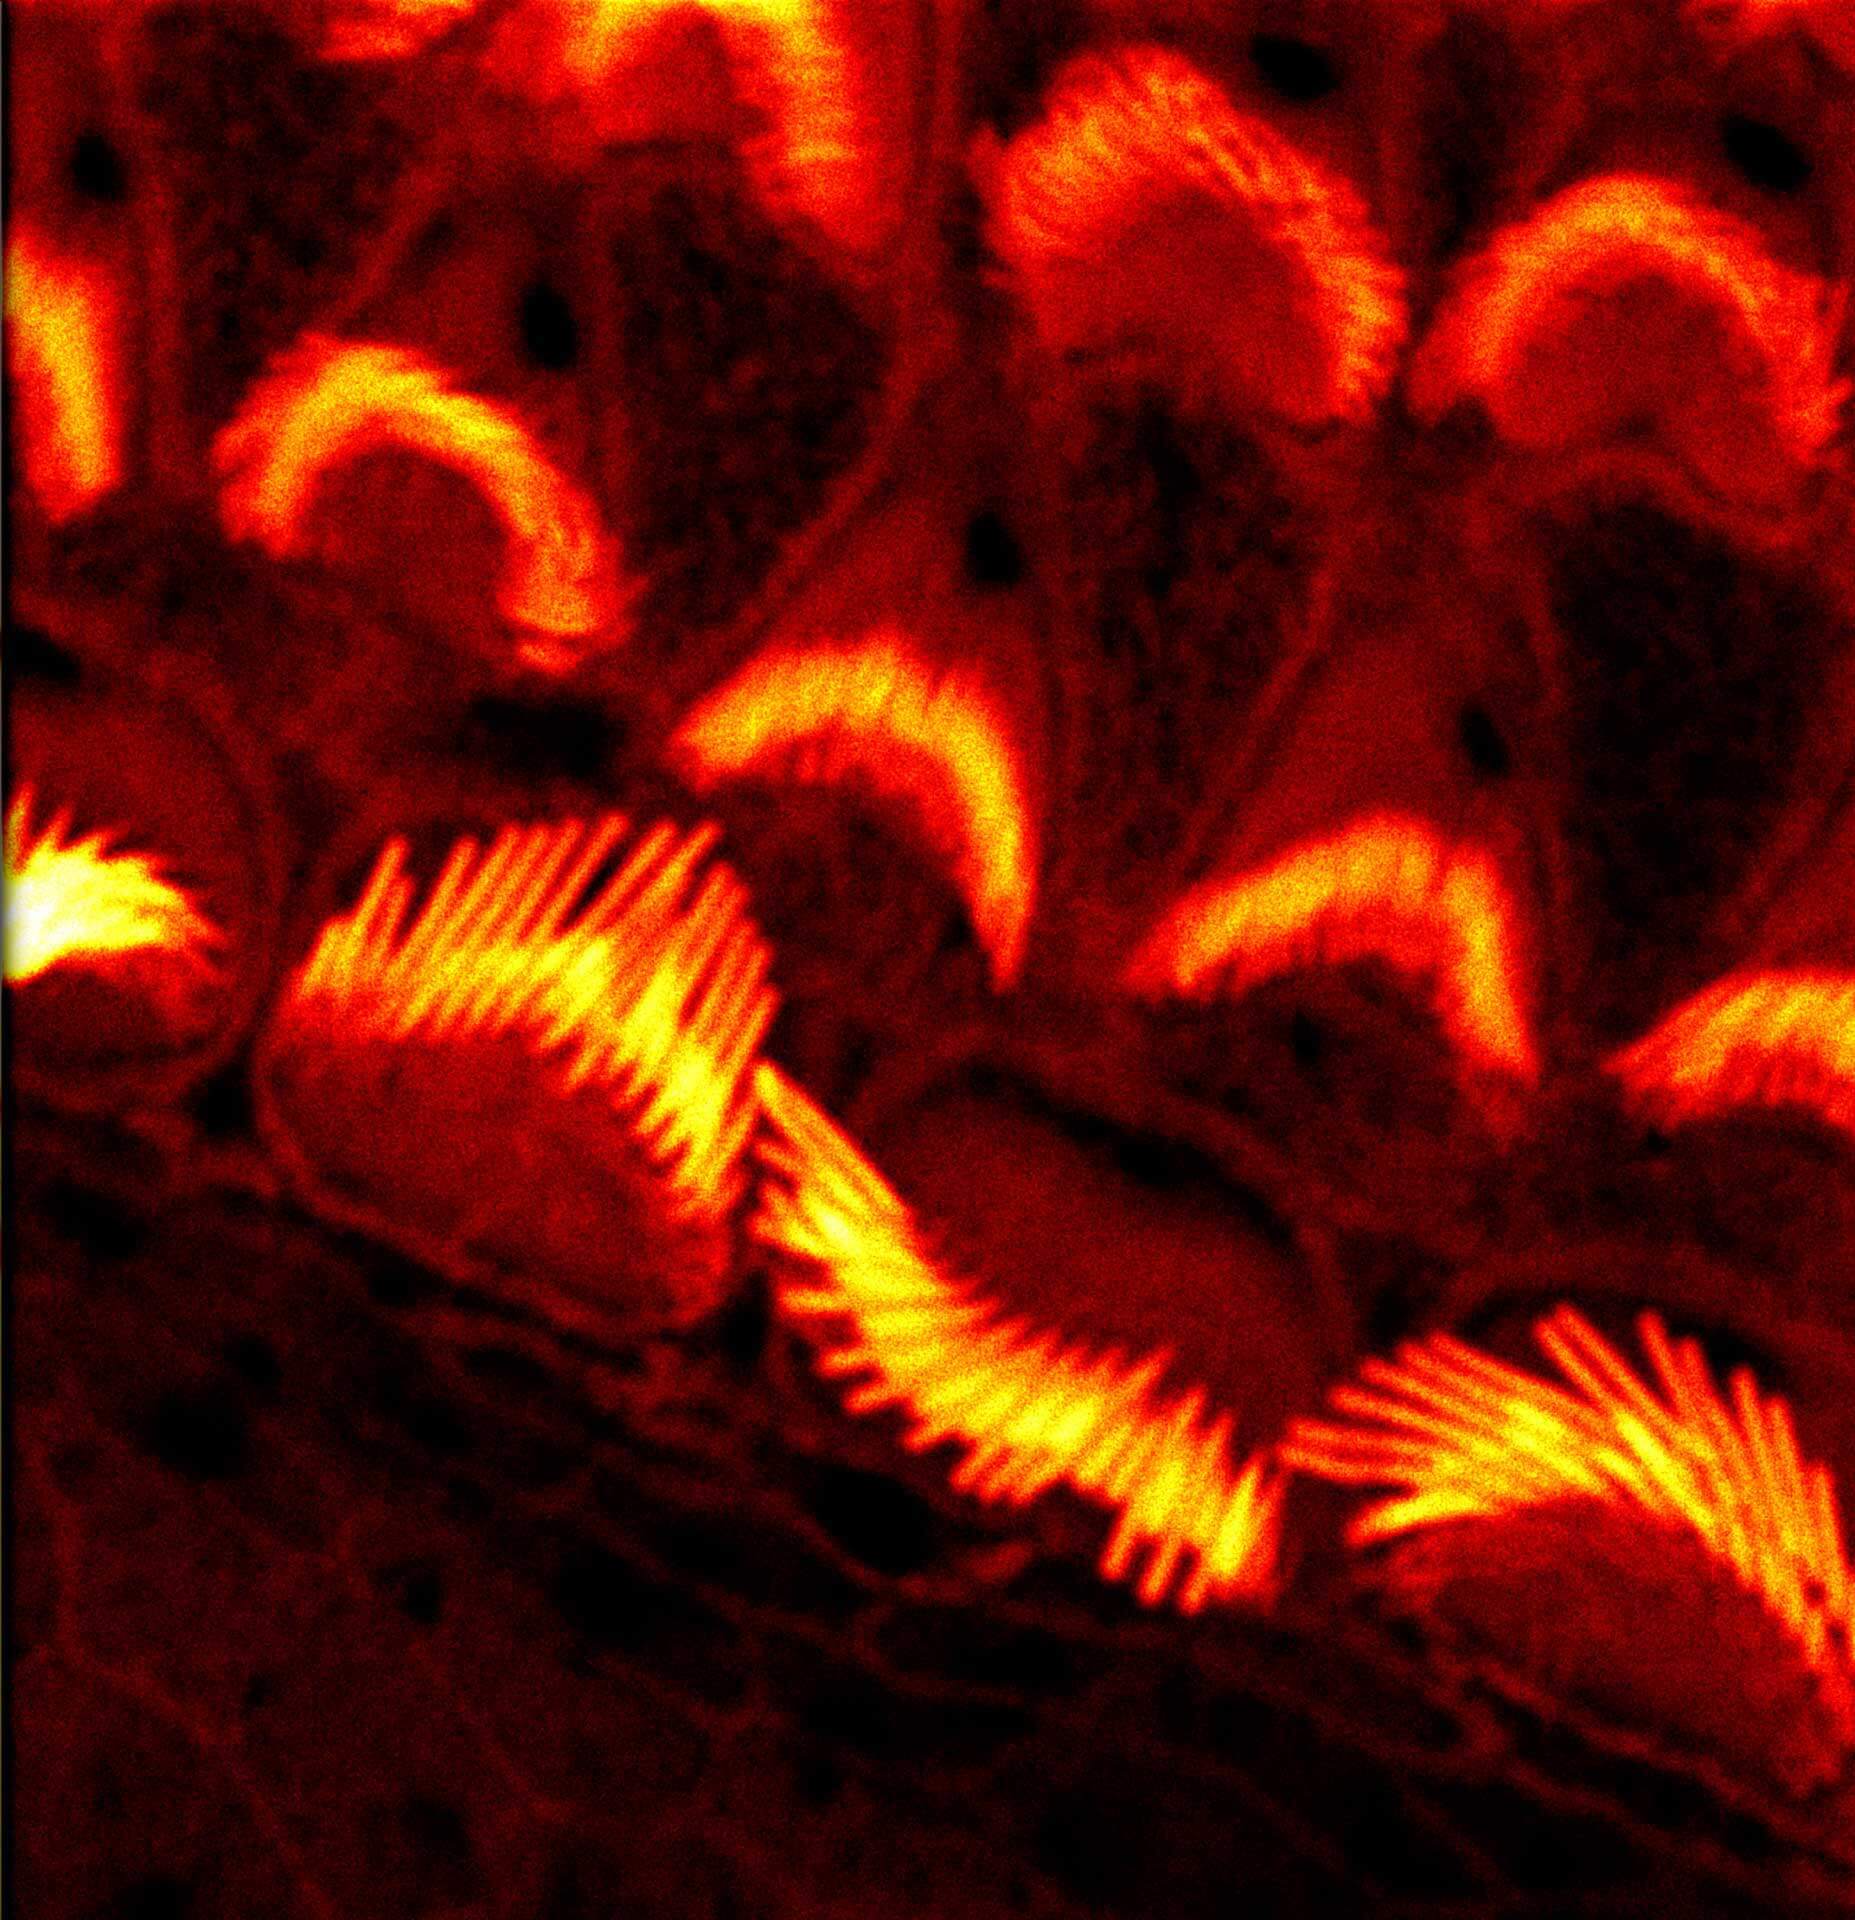
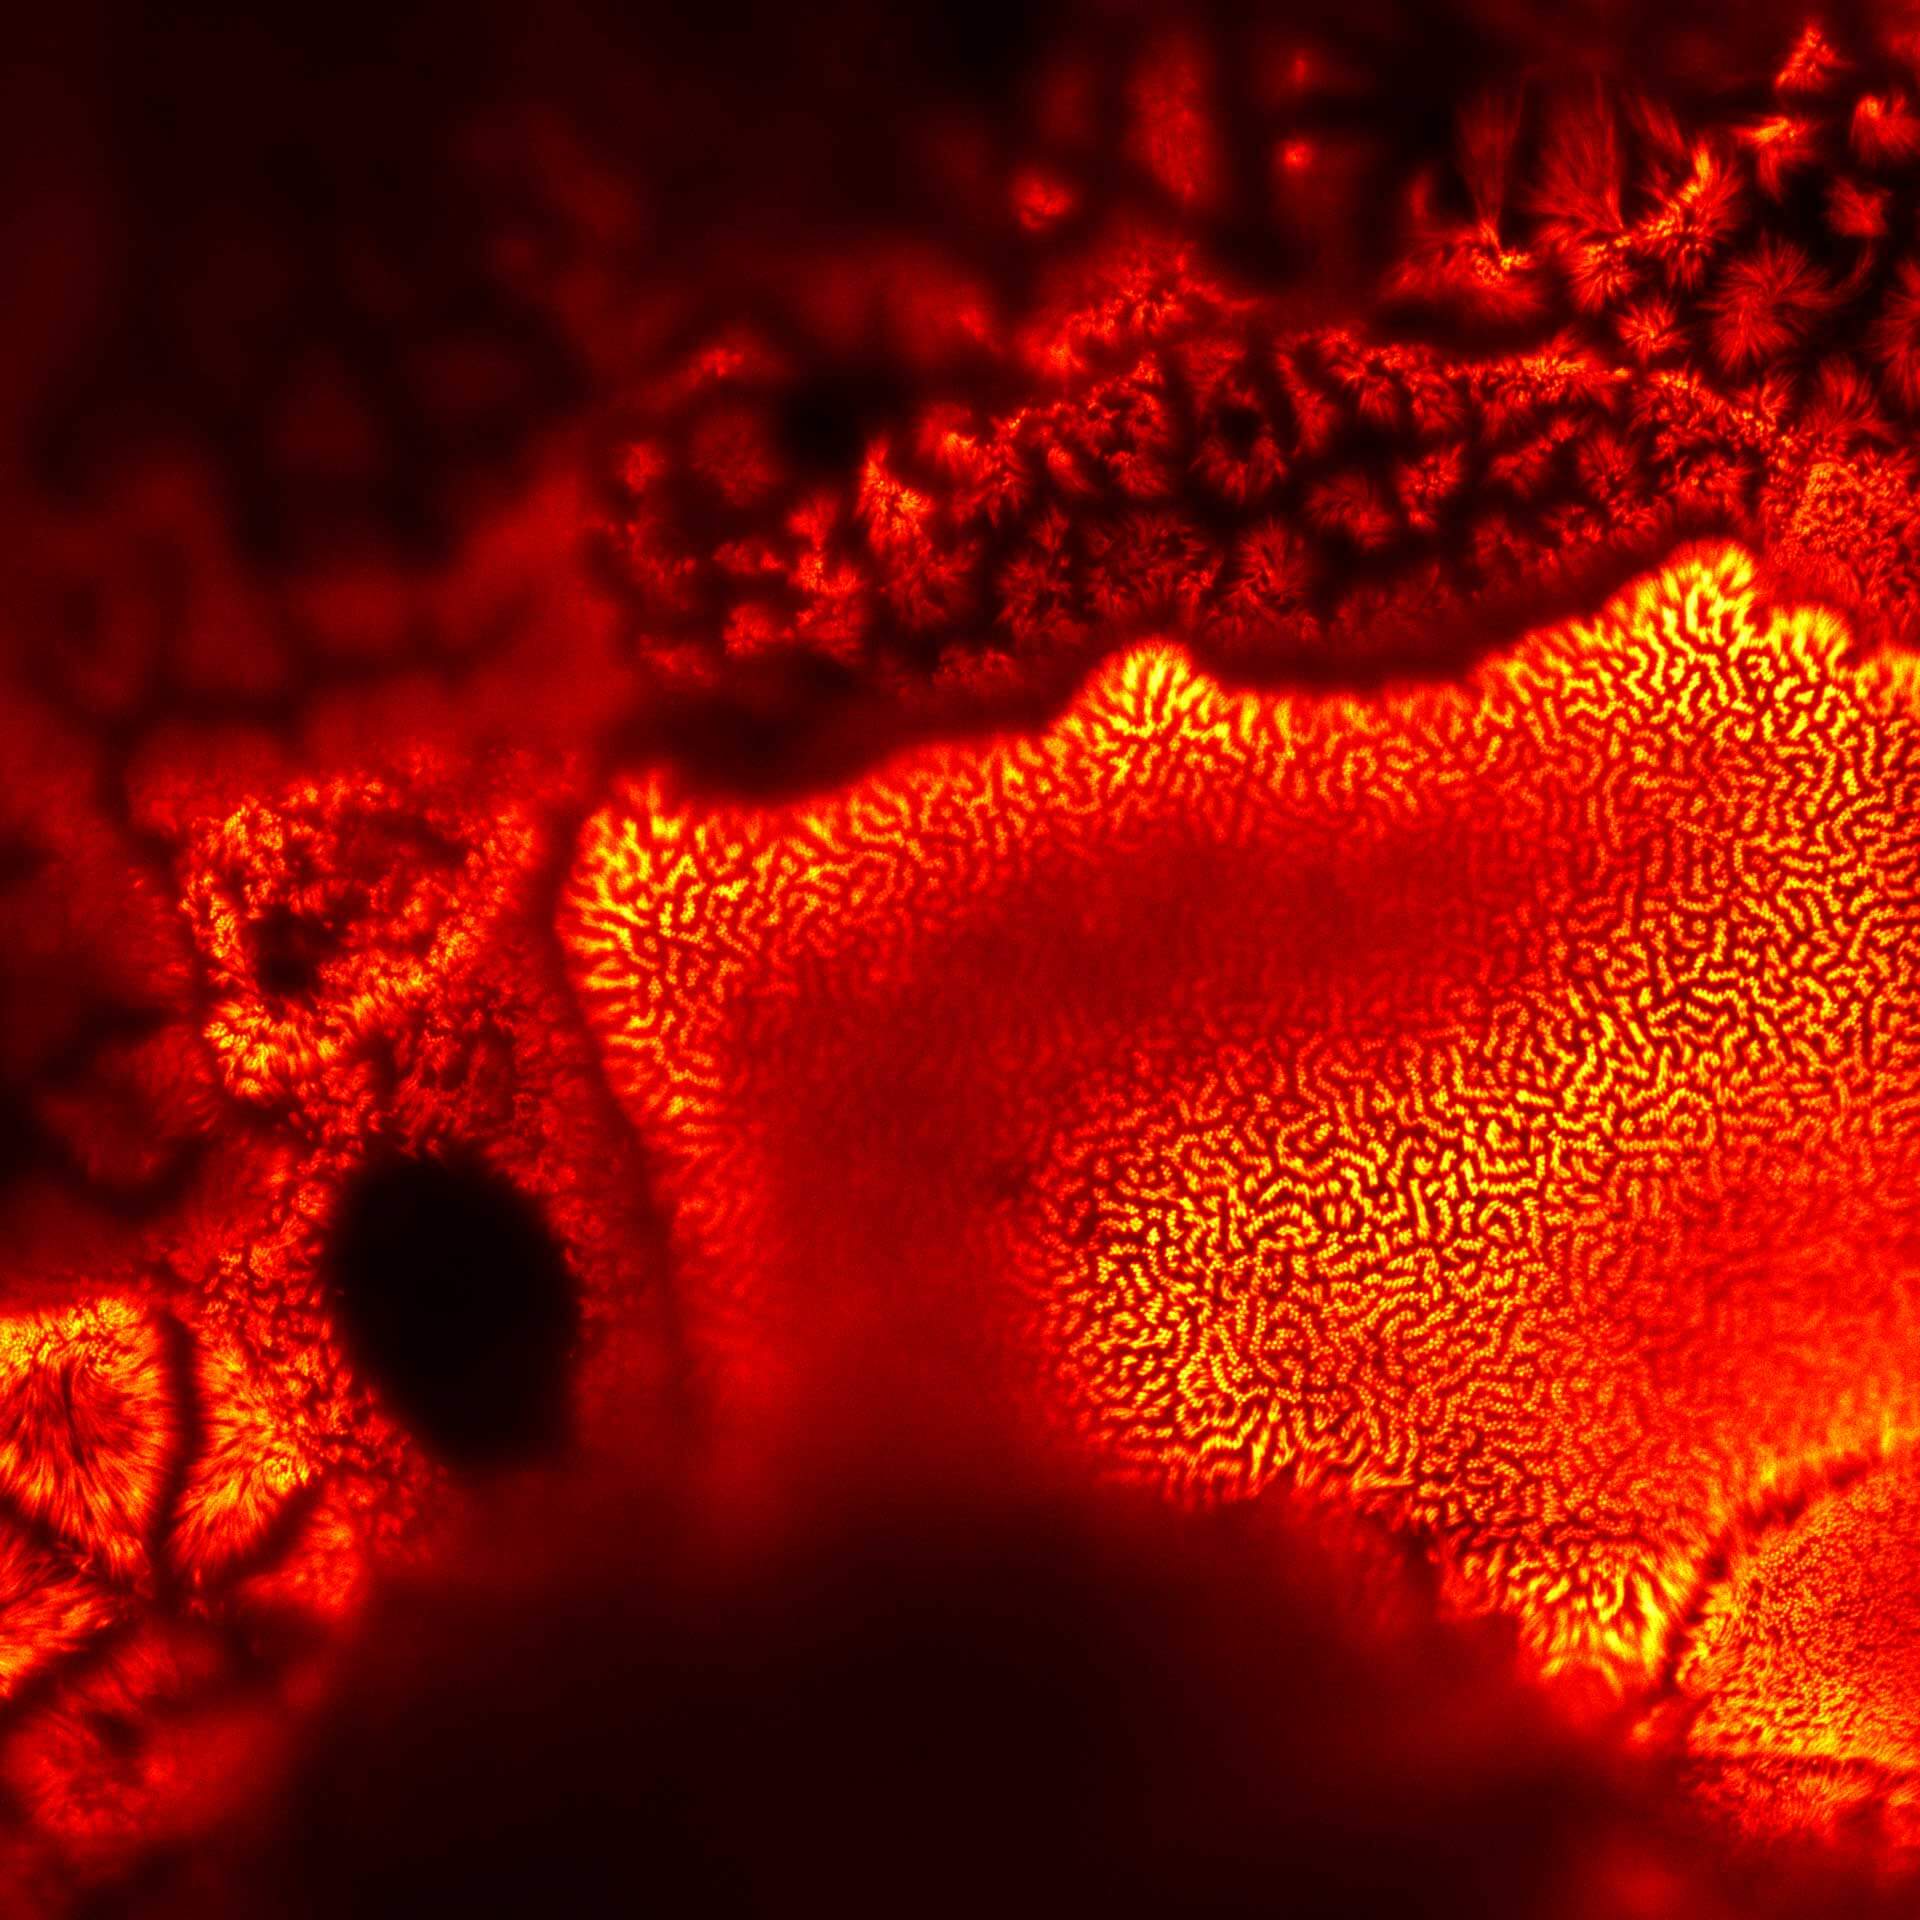
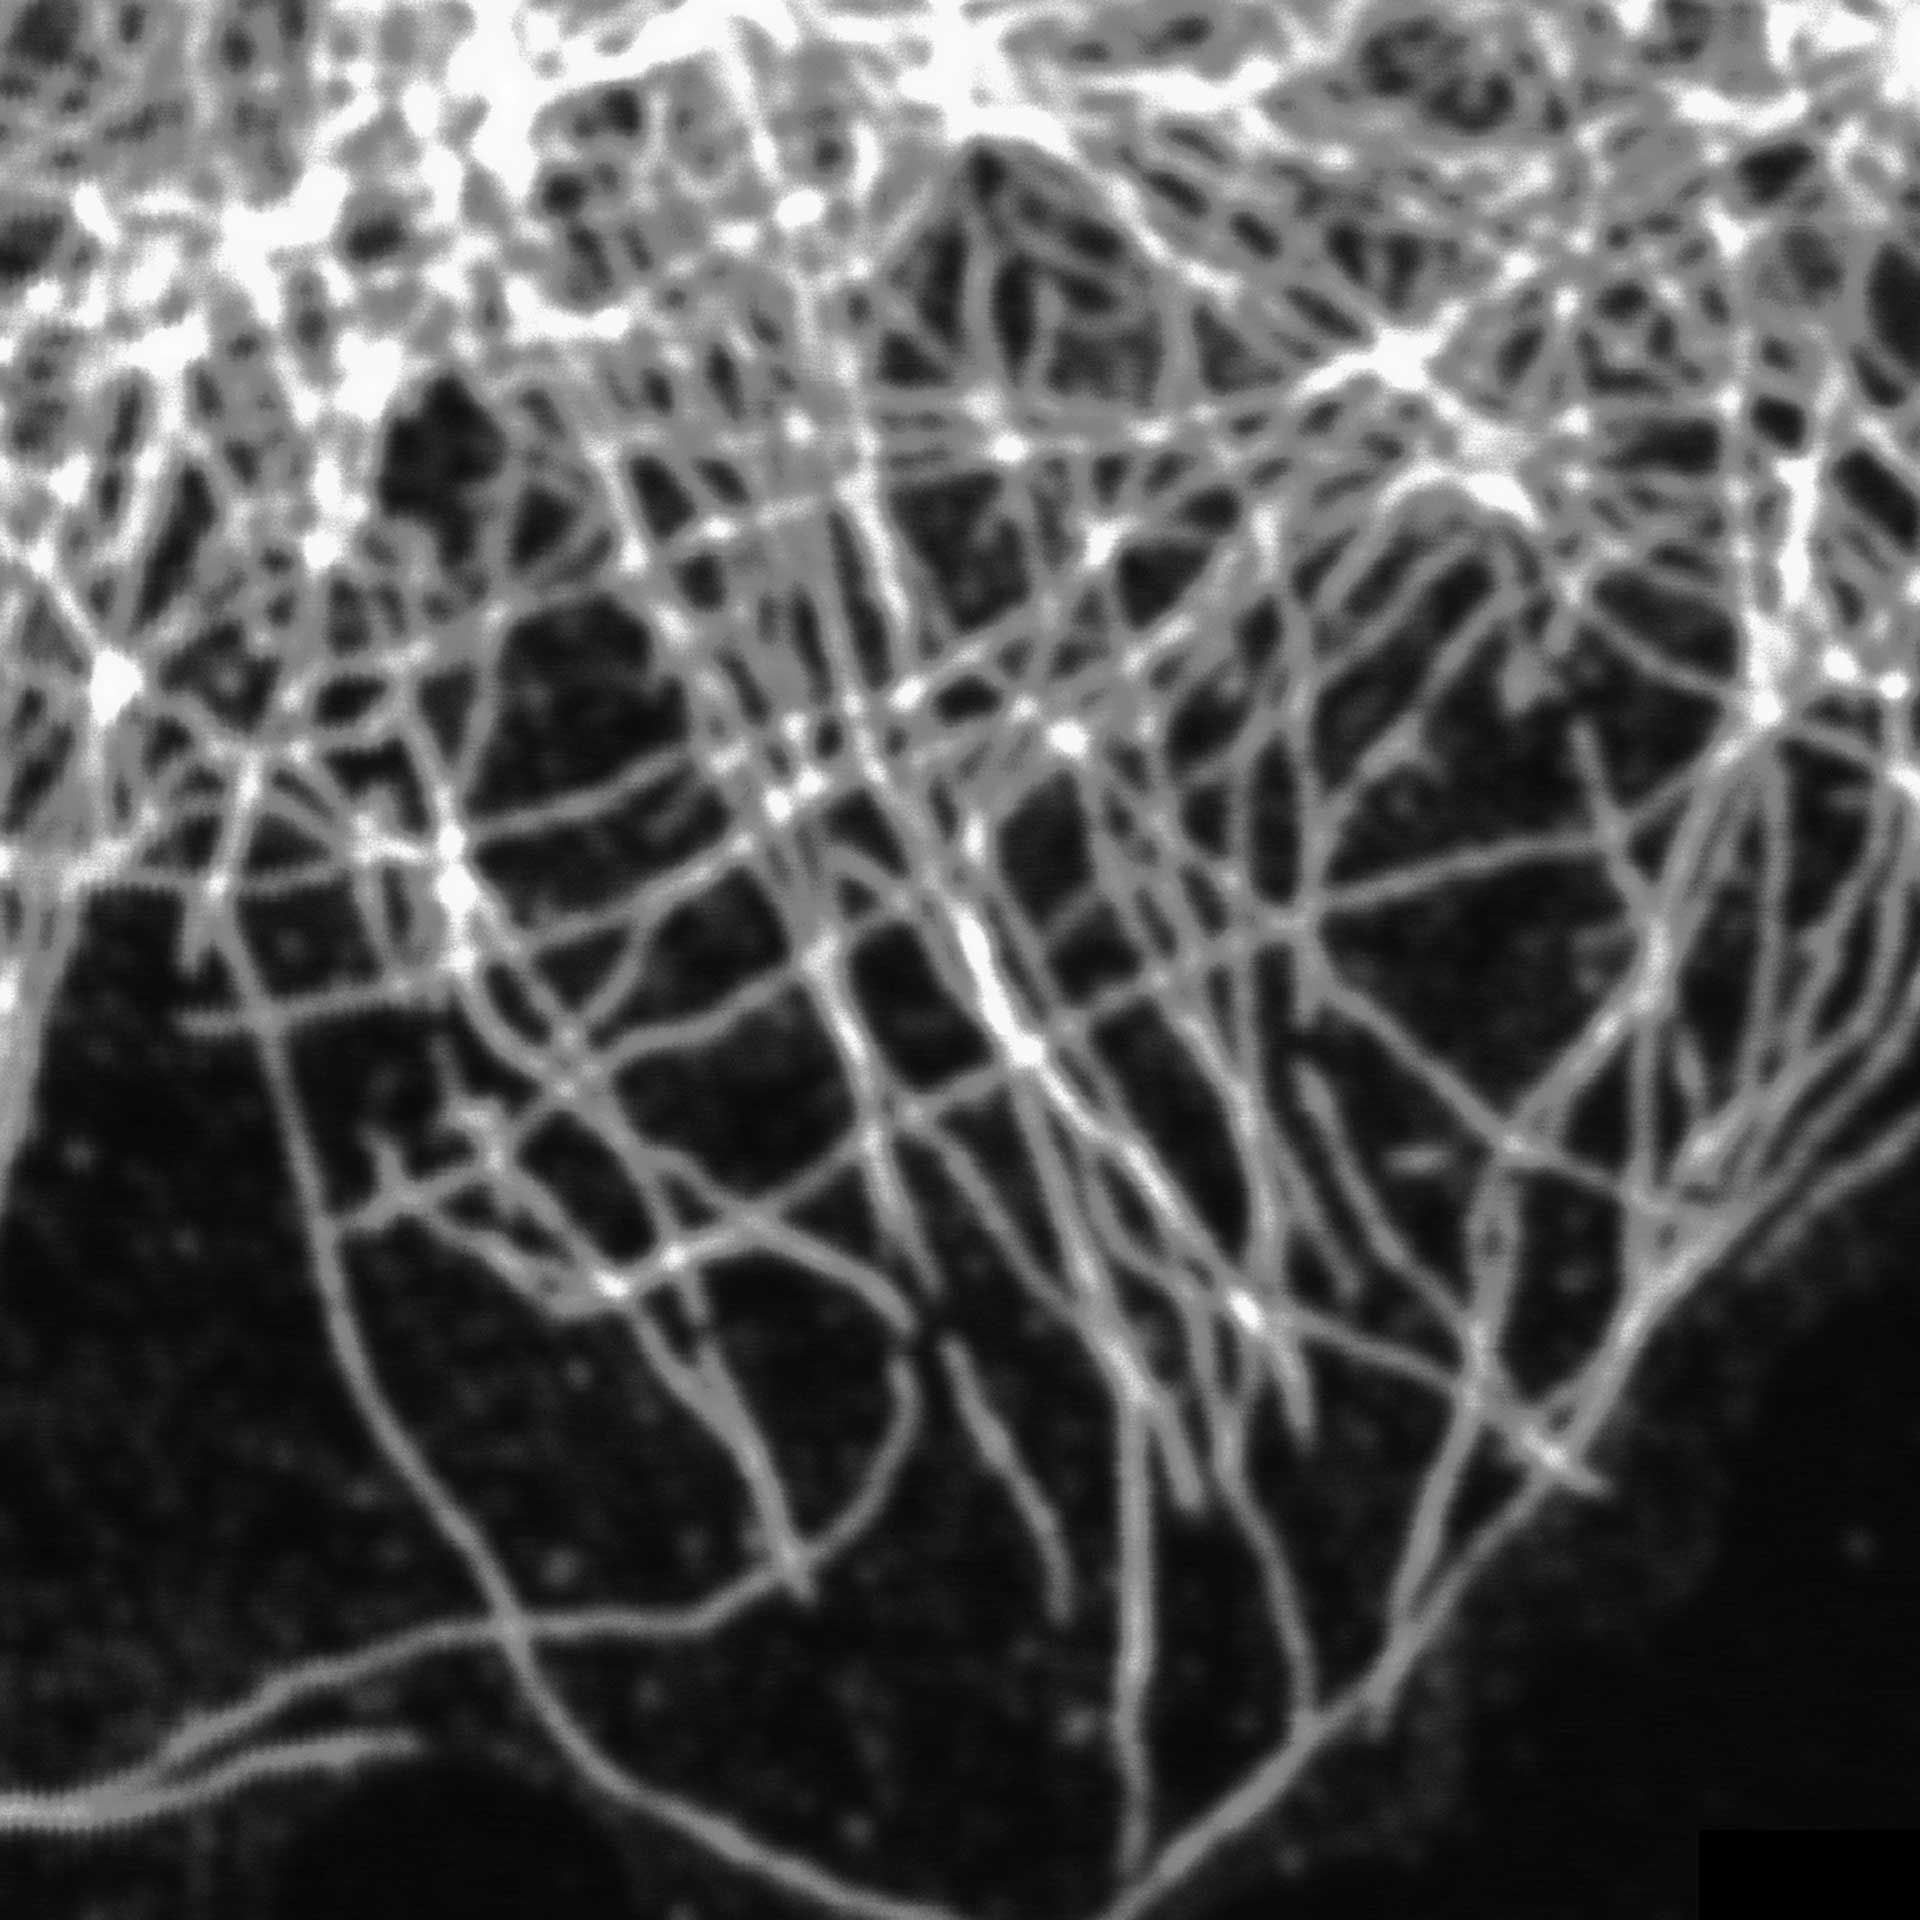
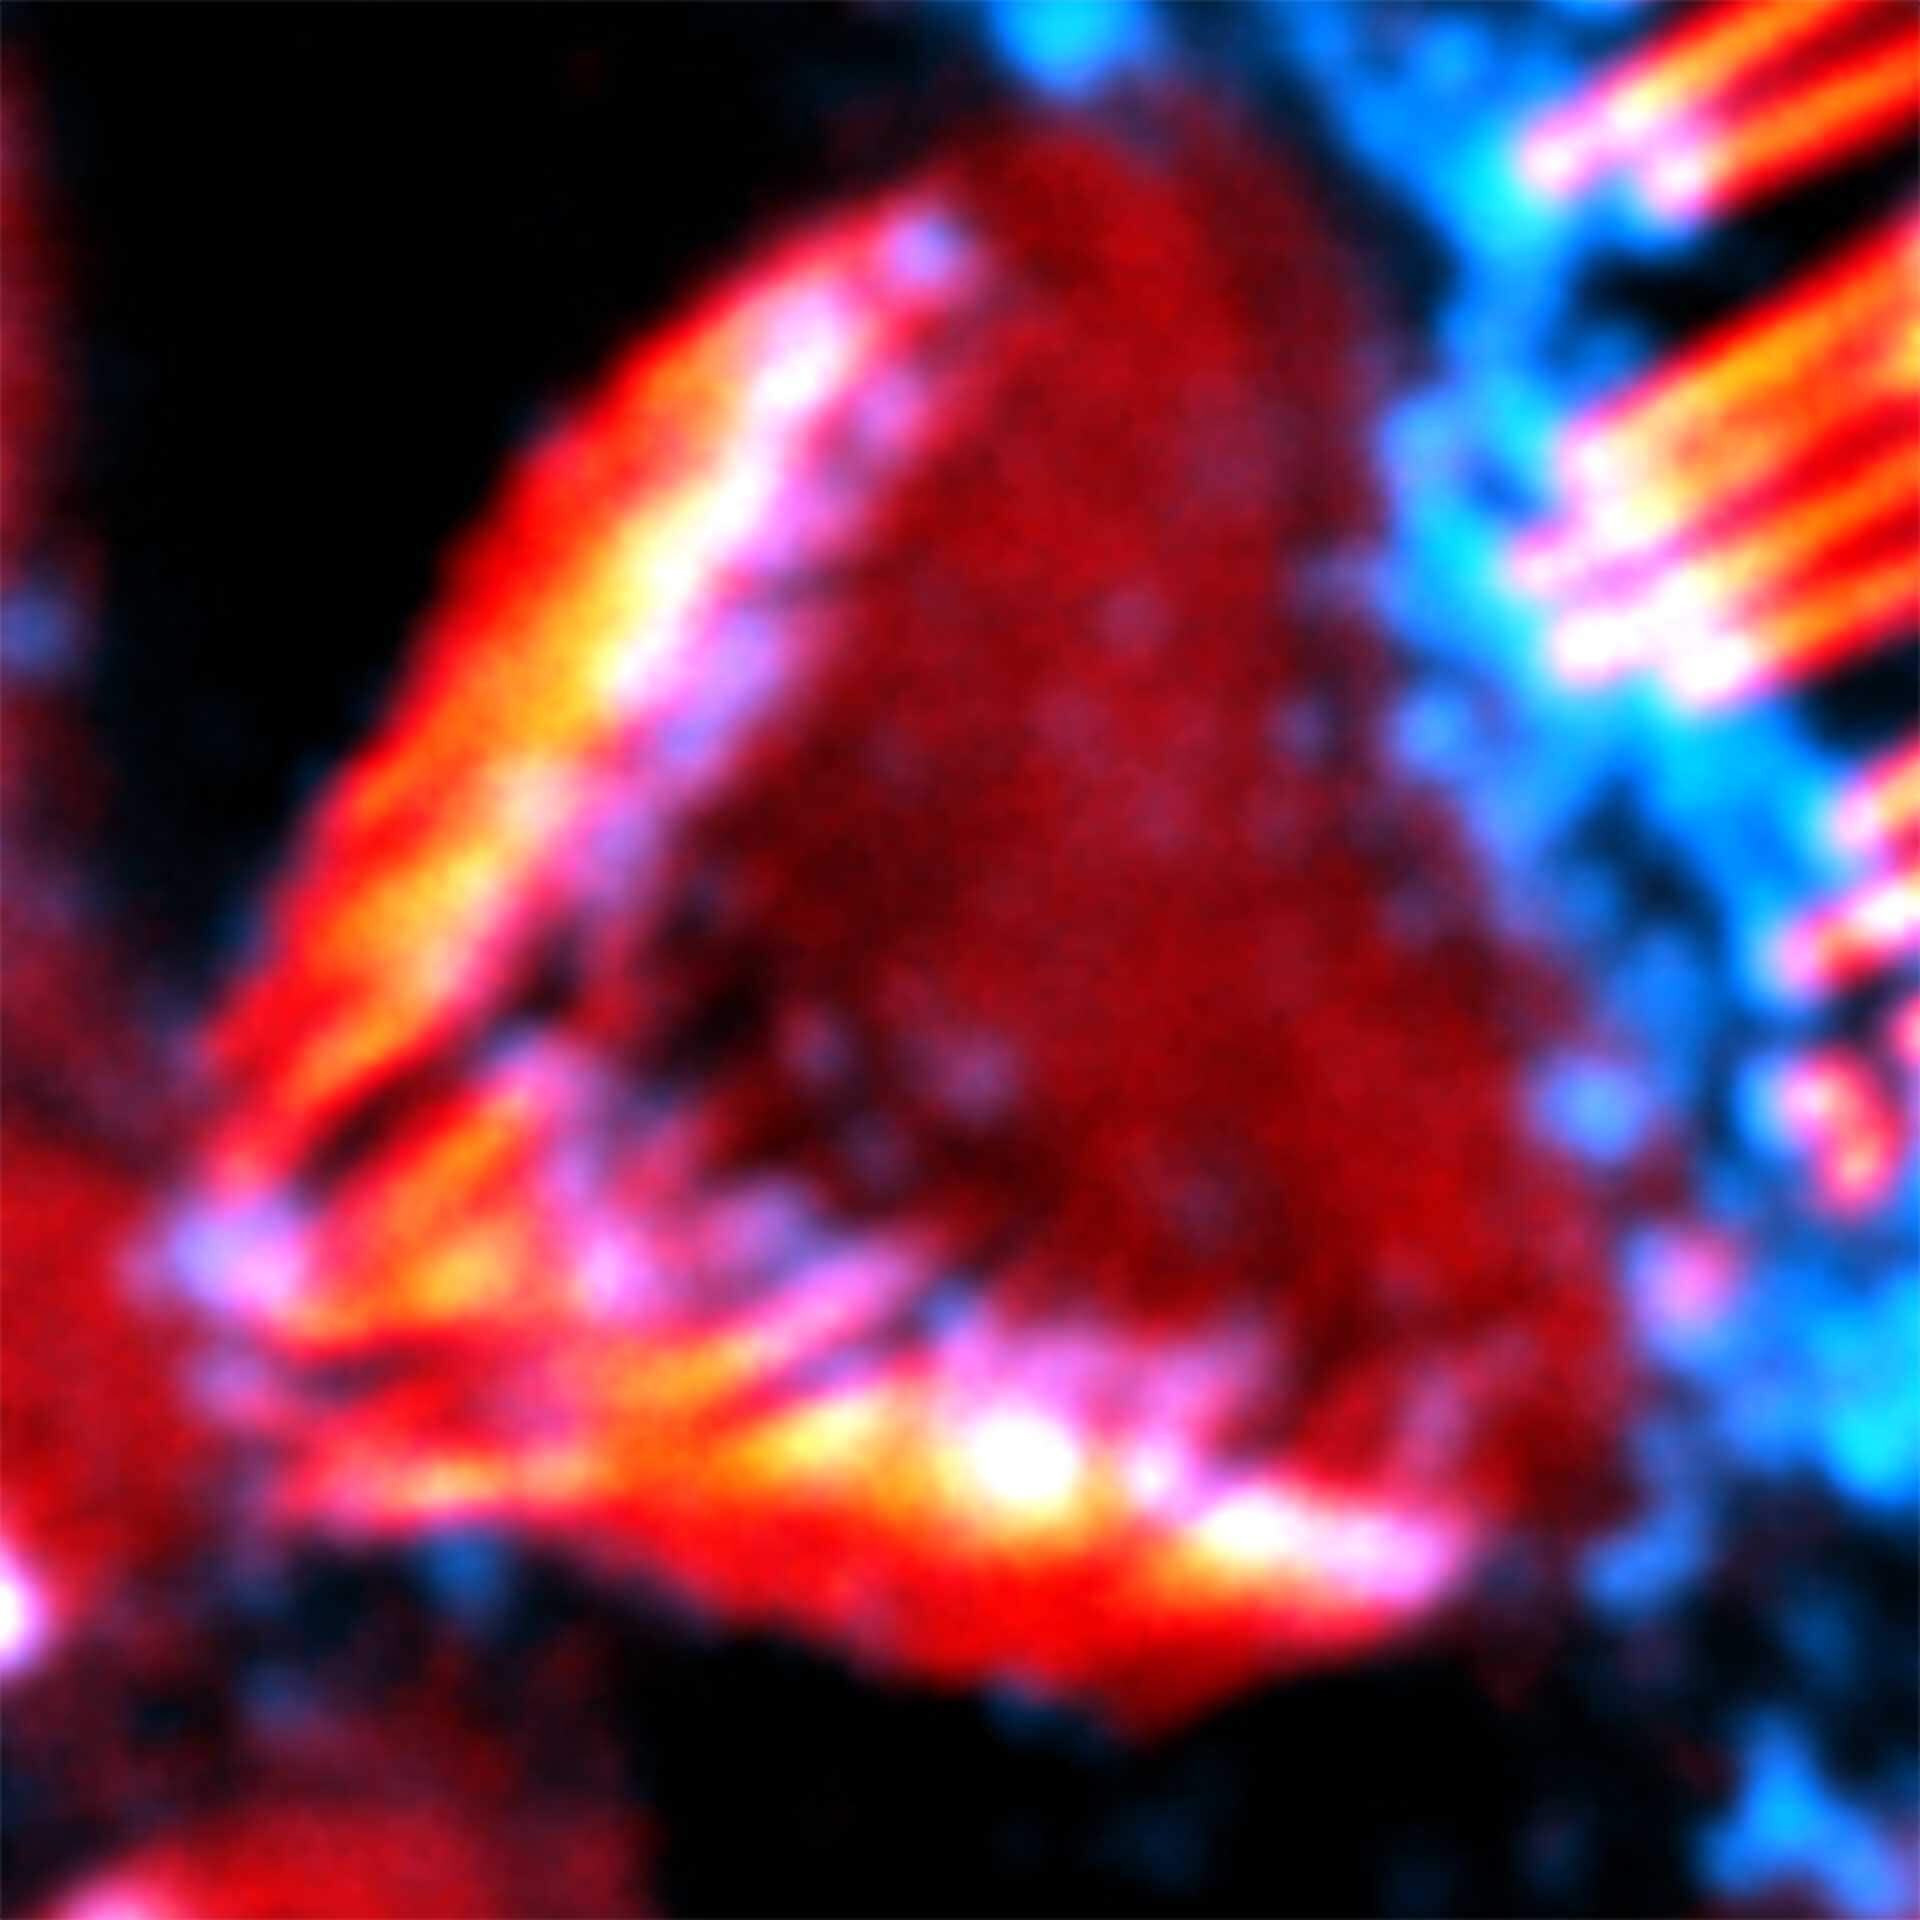
Actin stain of mouse inner ear hair cells using abberior STAR RED phalloidin.
Samples were prepared by Dr. Christian Vogl, InnerEarLab, UMG Göttingen, Germany.
Description
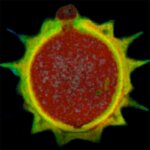
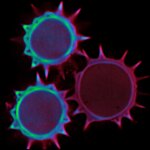
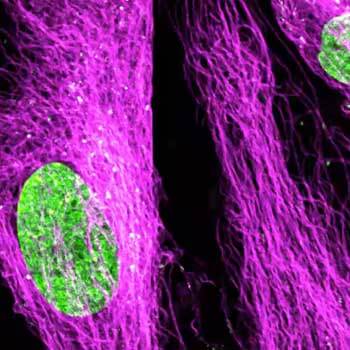
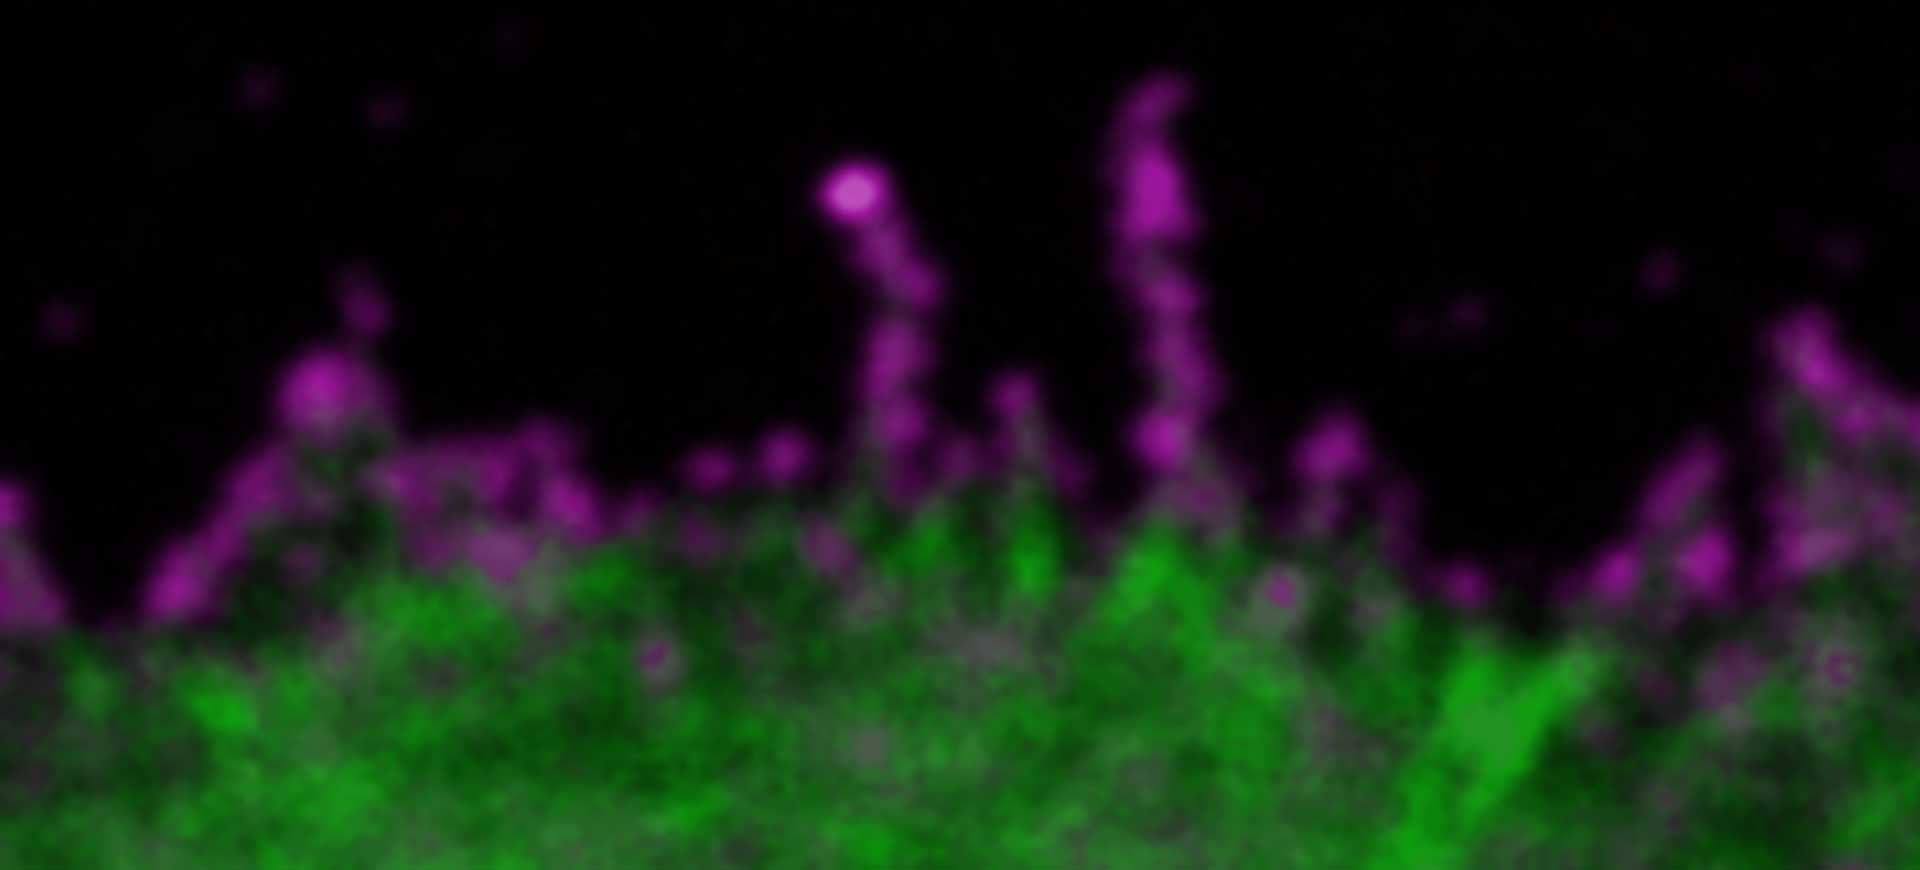
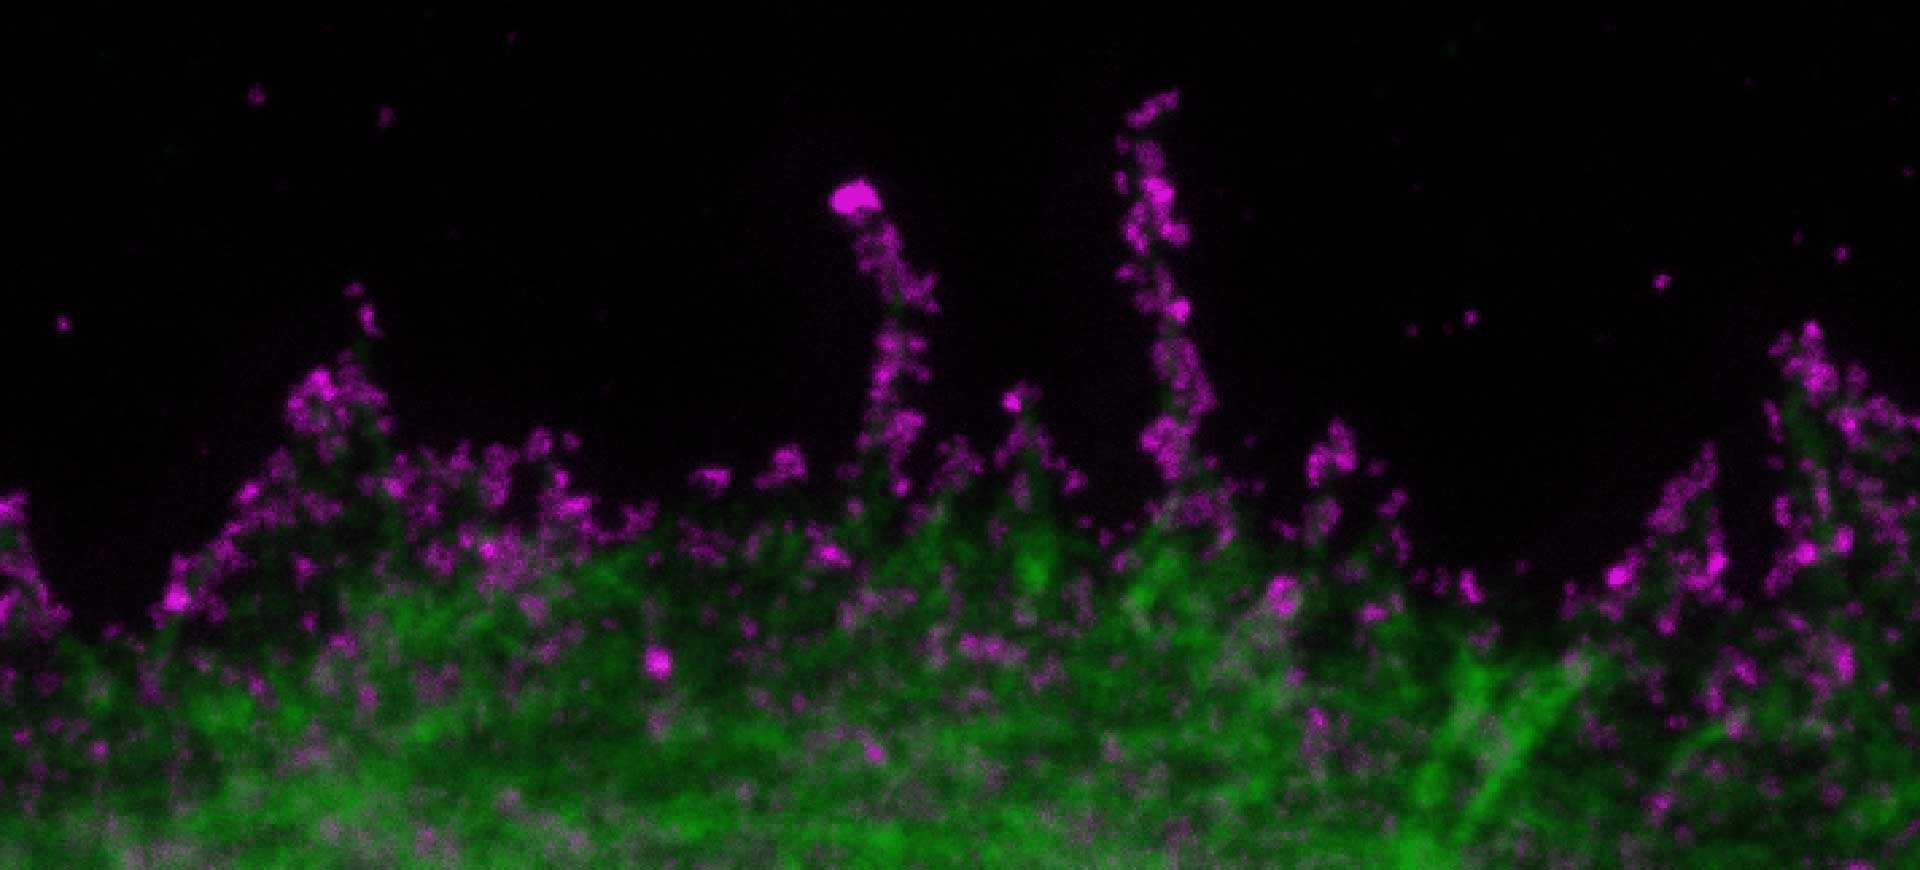
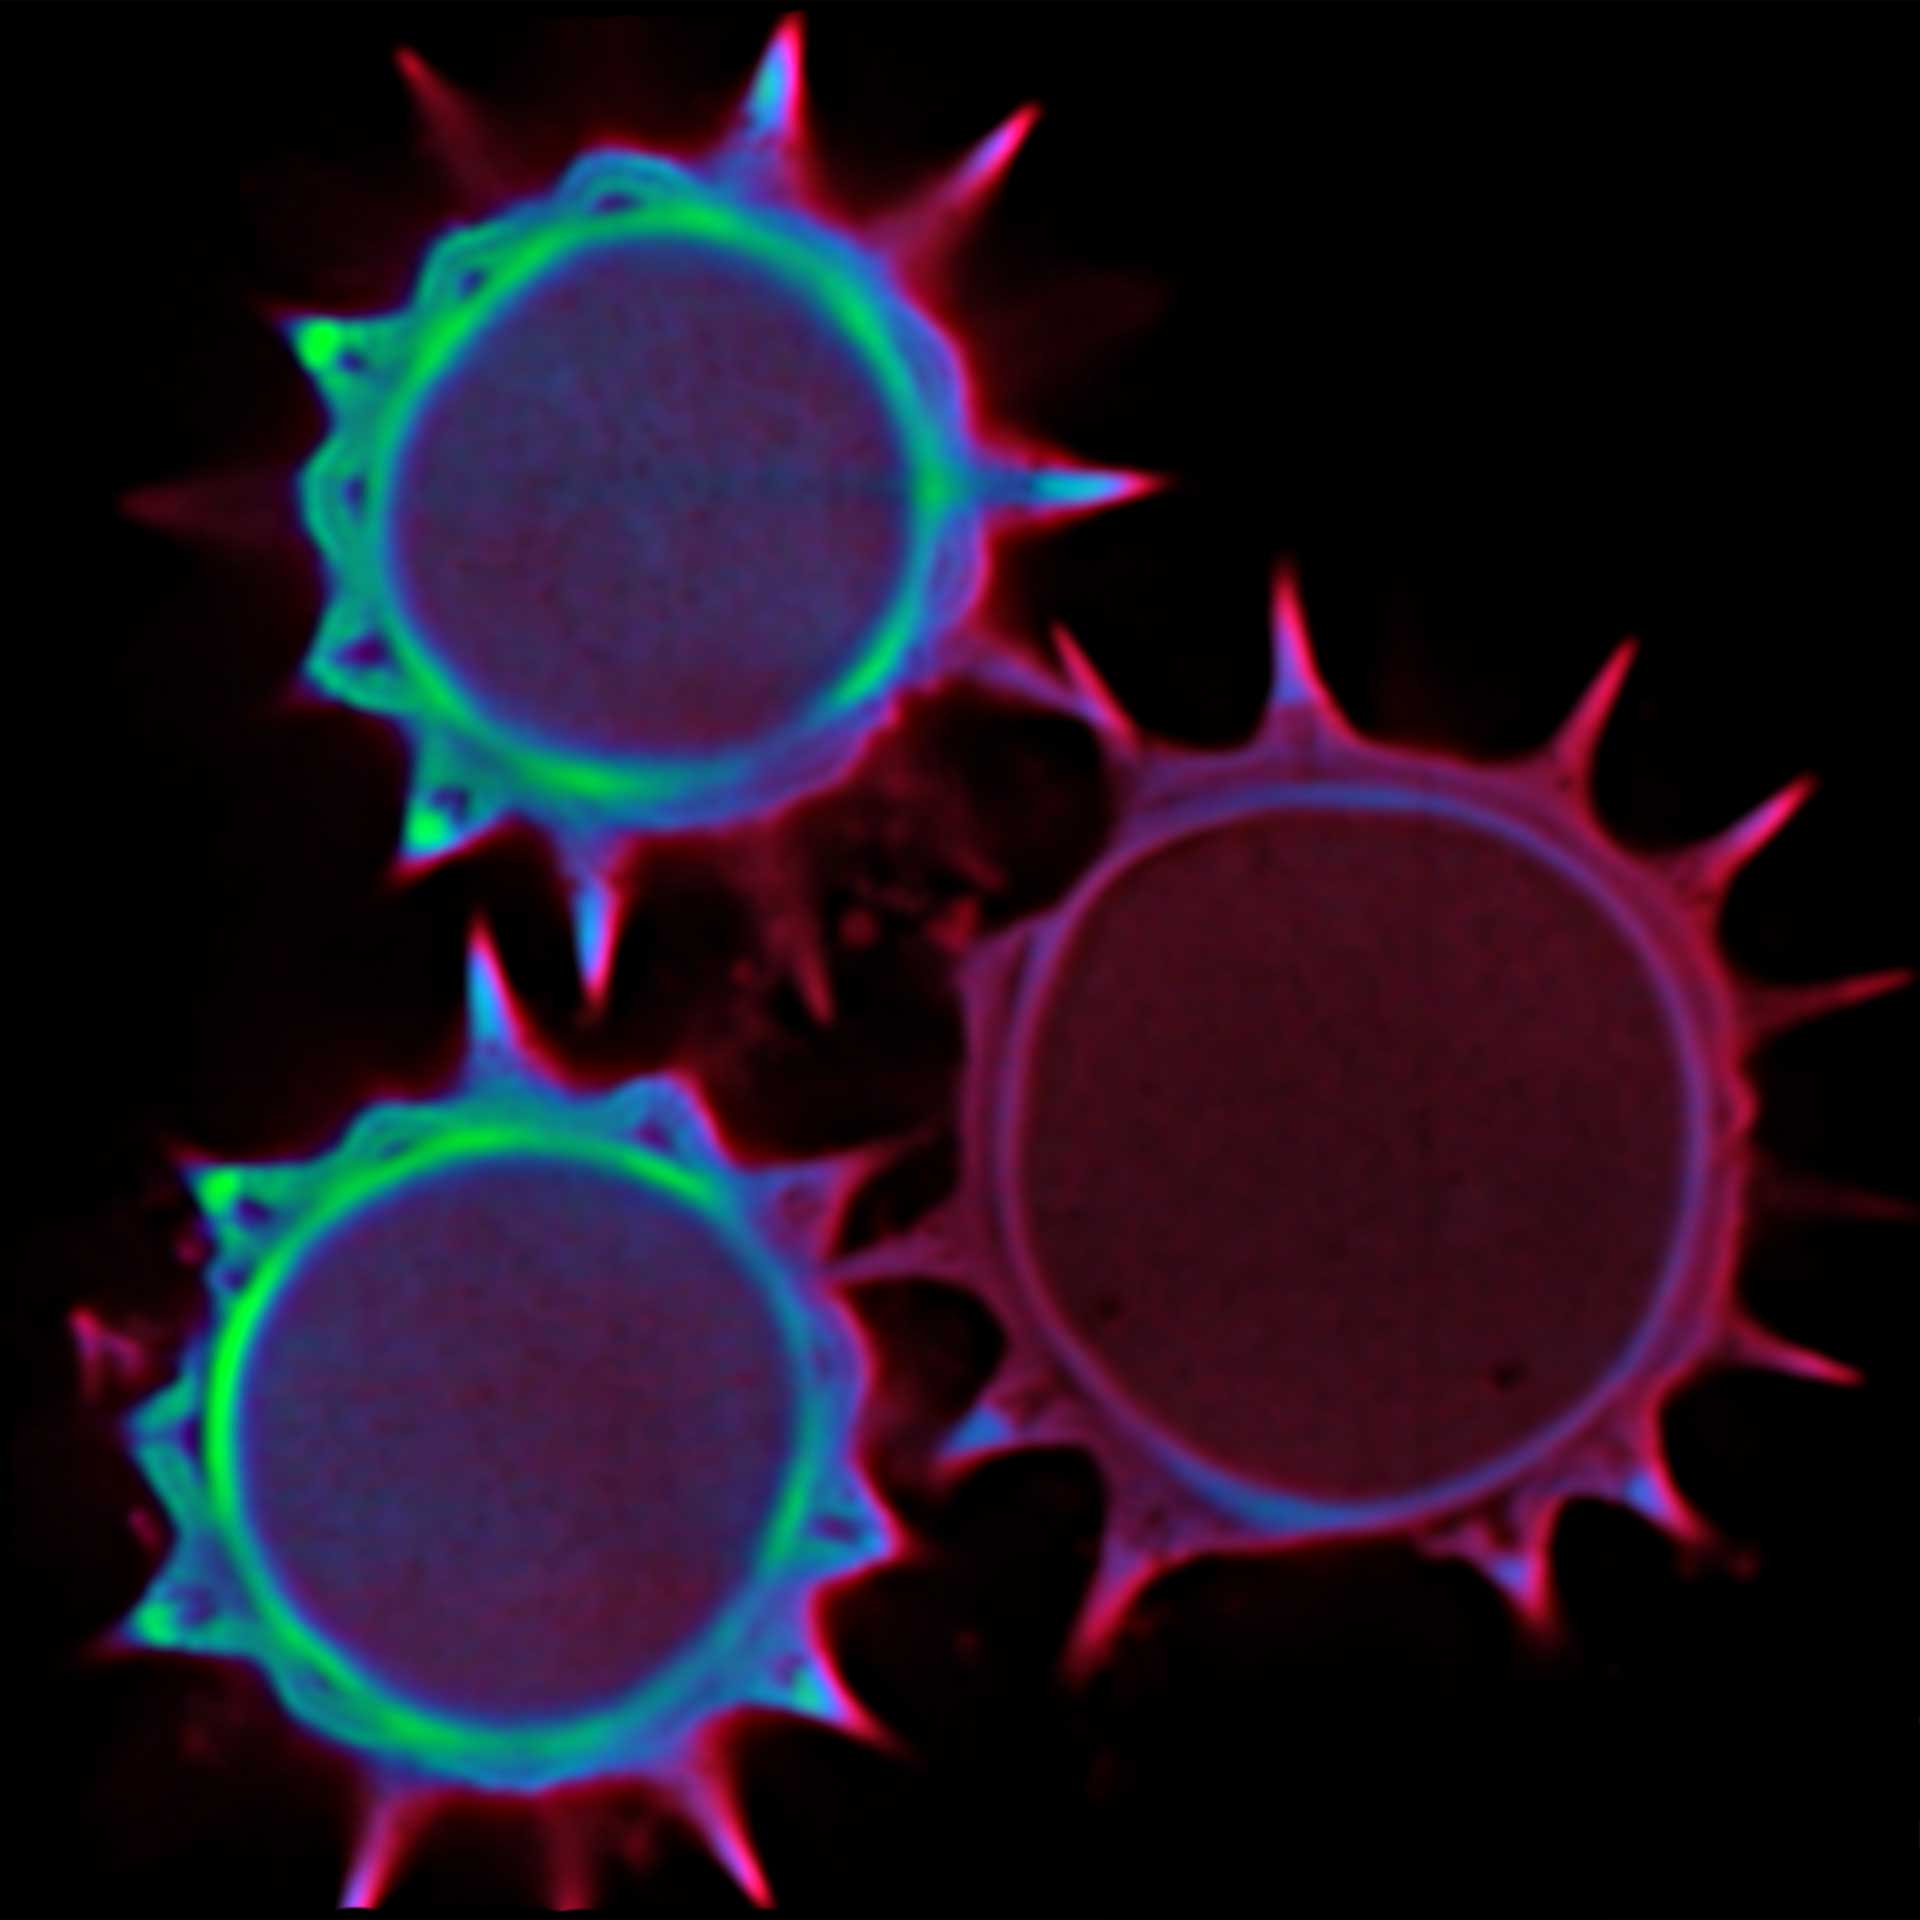
SARS-CoV2 ("Corona", magenta, abberior STAR RED) and cellular actin (green, abberior STAR ORANGE Phalloidin) in VeroE6 infected cells.
Copyright: MDVA team/CNRS Montpellier, France (D. Muriaux, C. Favard, M.-P. Blanchard @MRI)
Description
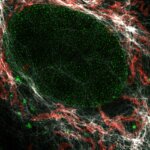
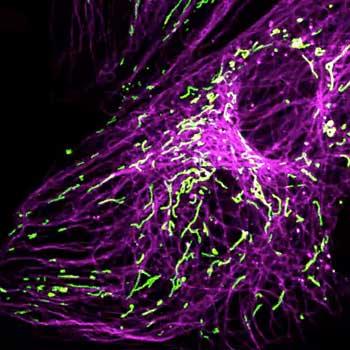
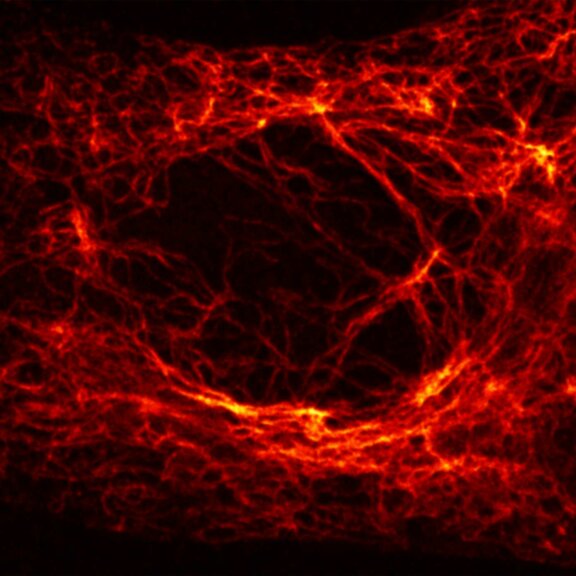
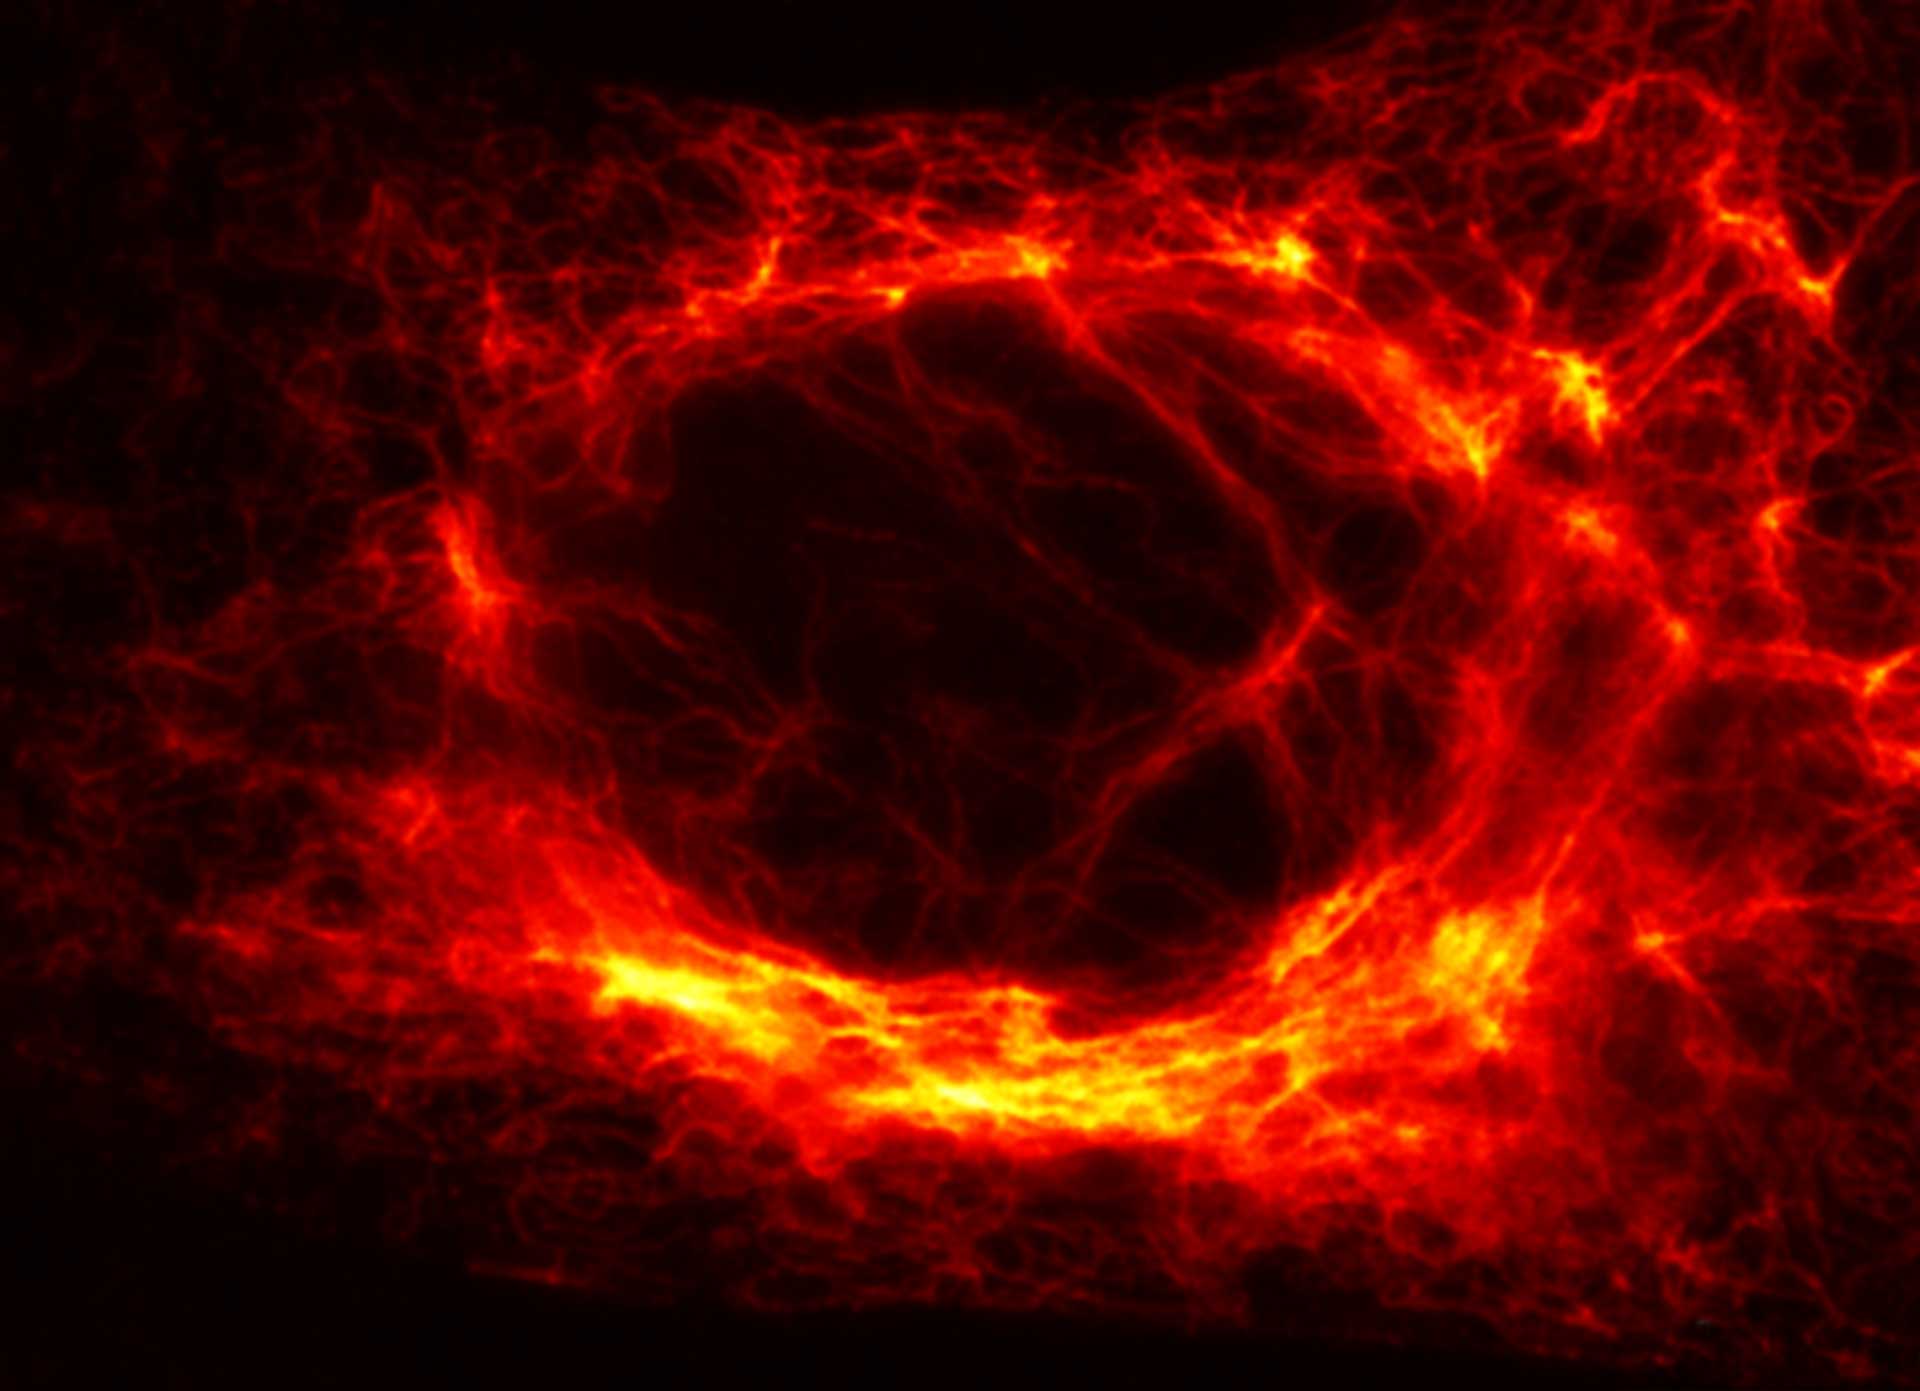
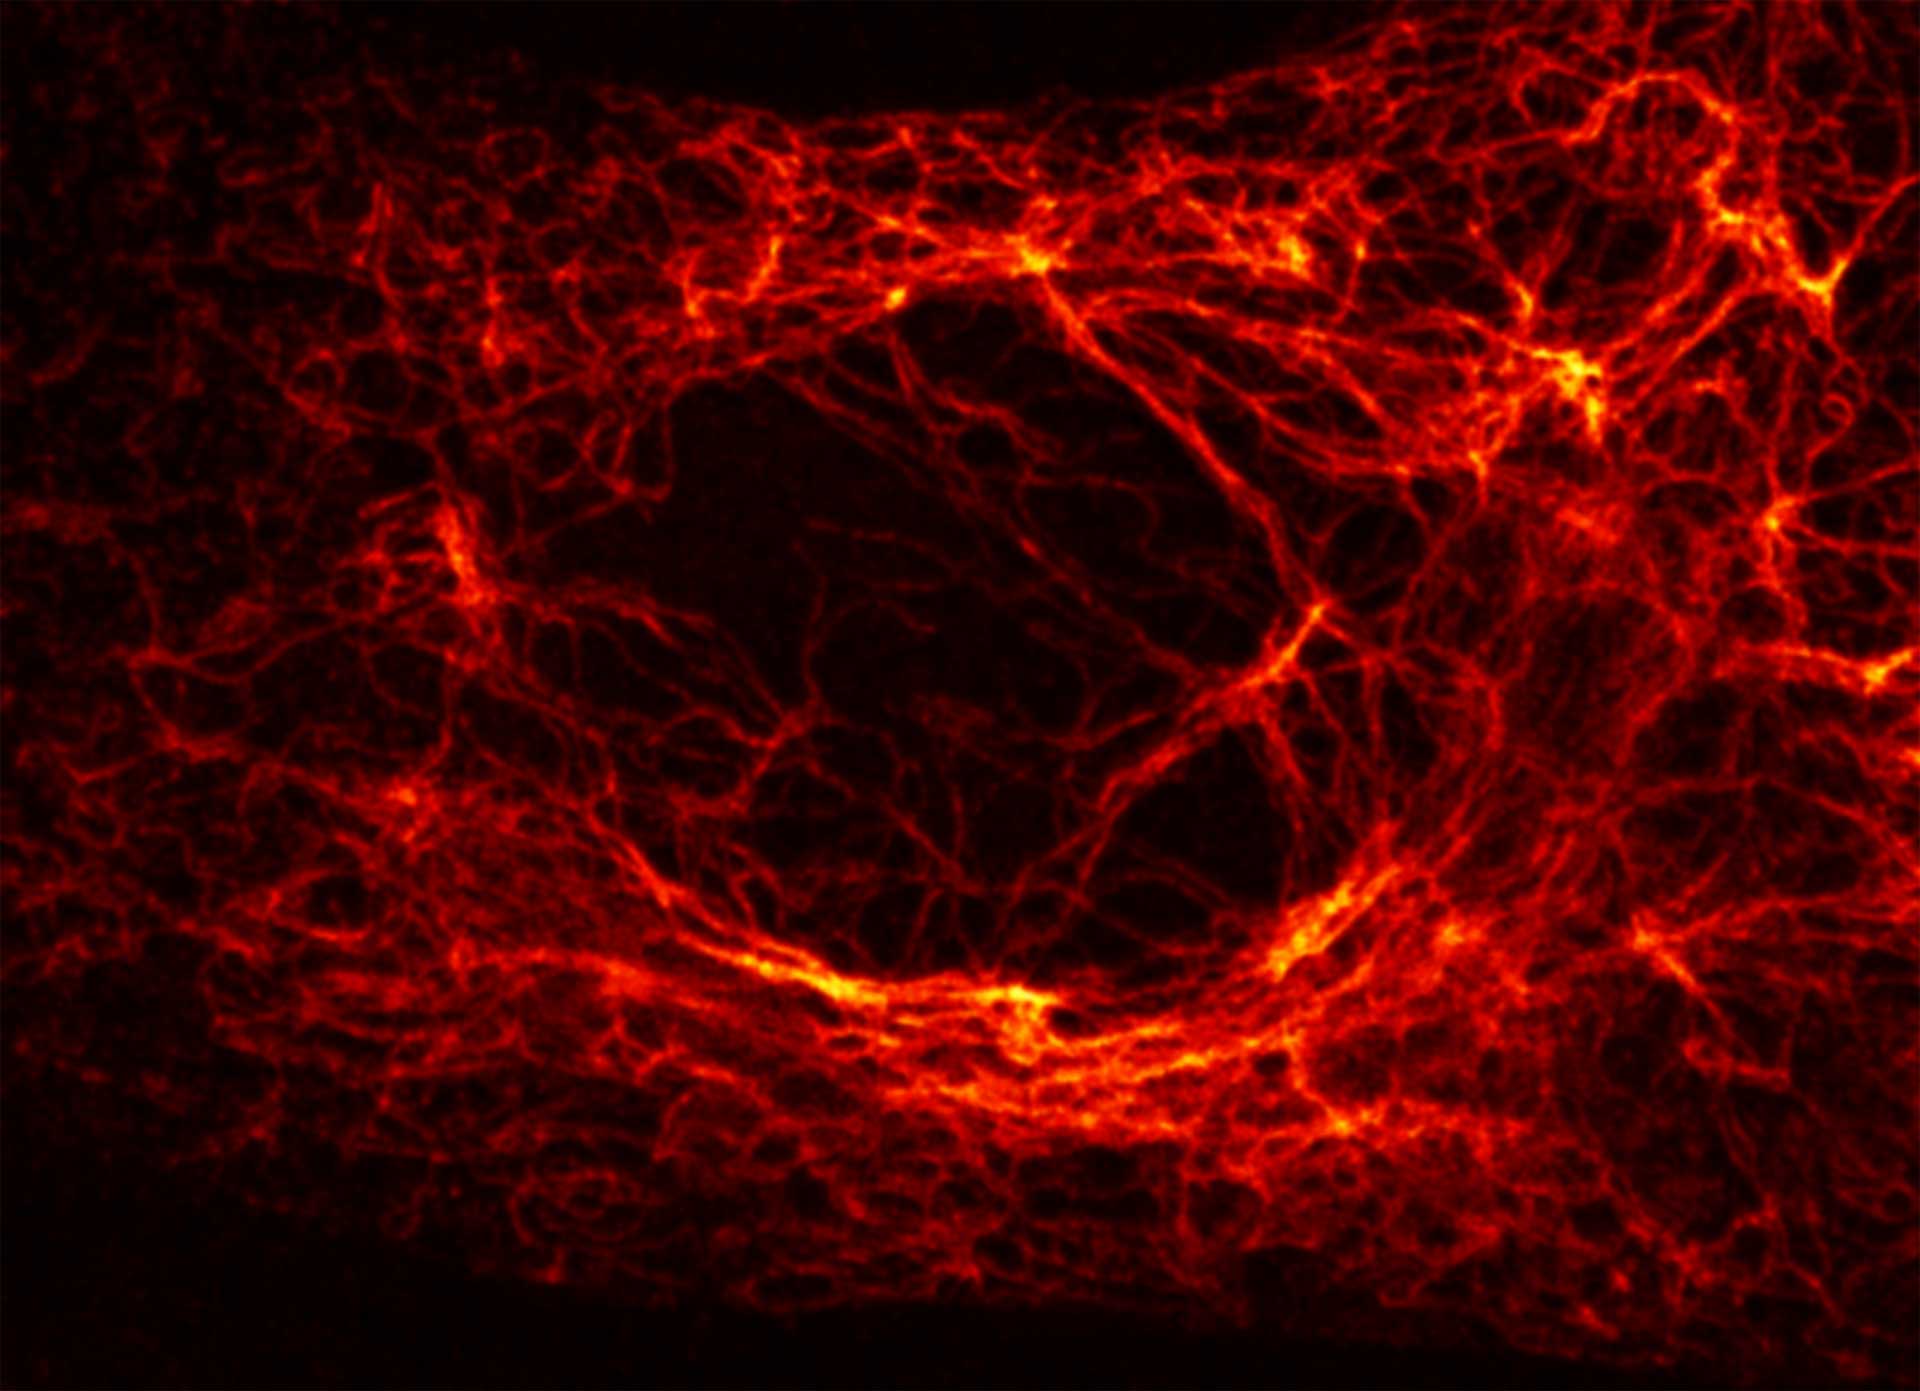
Vero cell, vimentin is labeled with abberior STAR RED. Note how in areas, where vimentin is thick, MATRIX removes background, while keeping the fibers in the foreground intact.
Modules:
Description
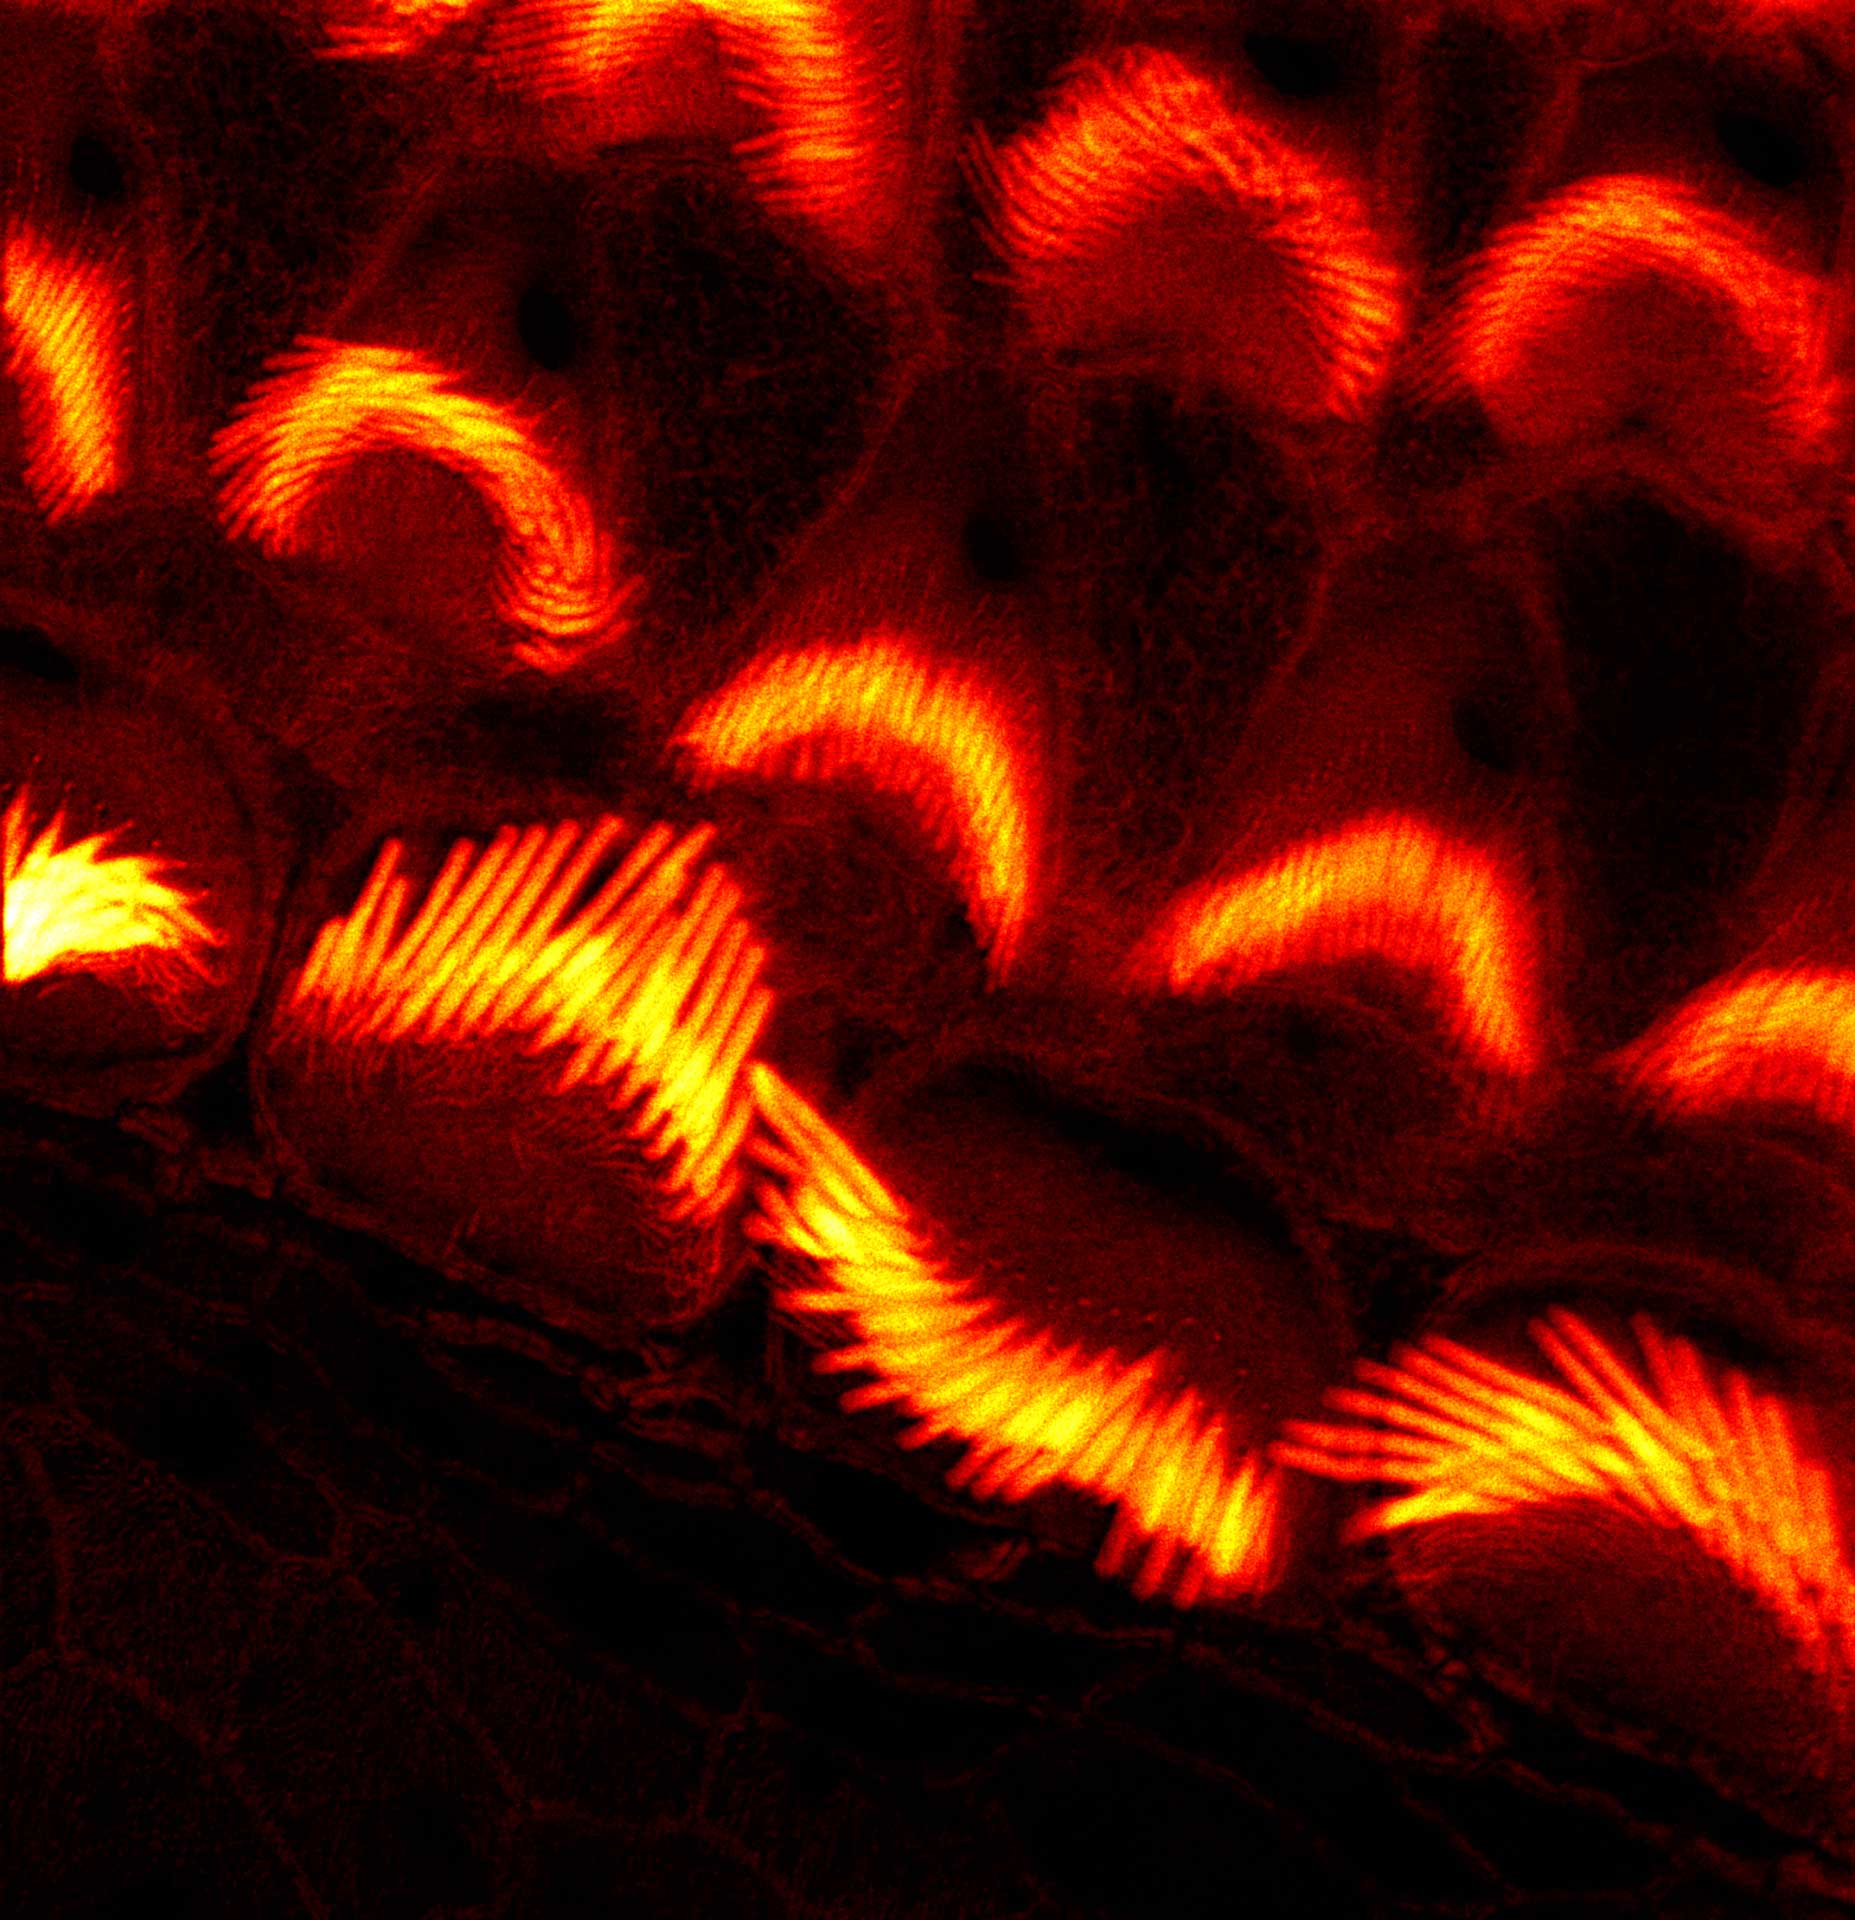
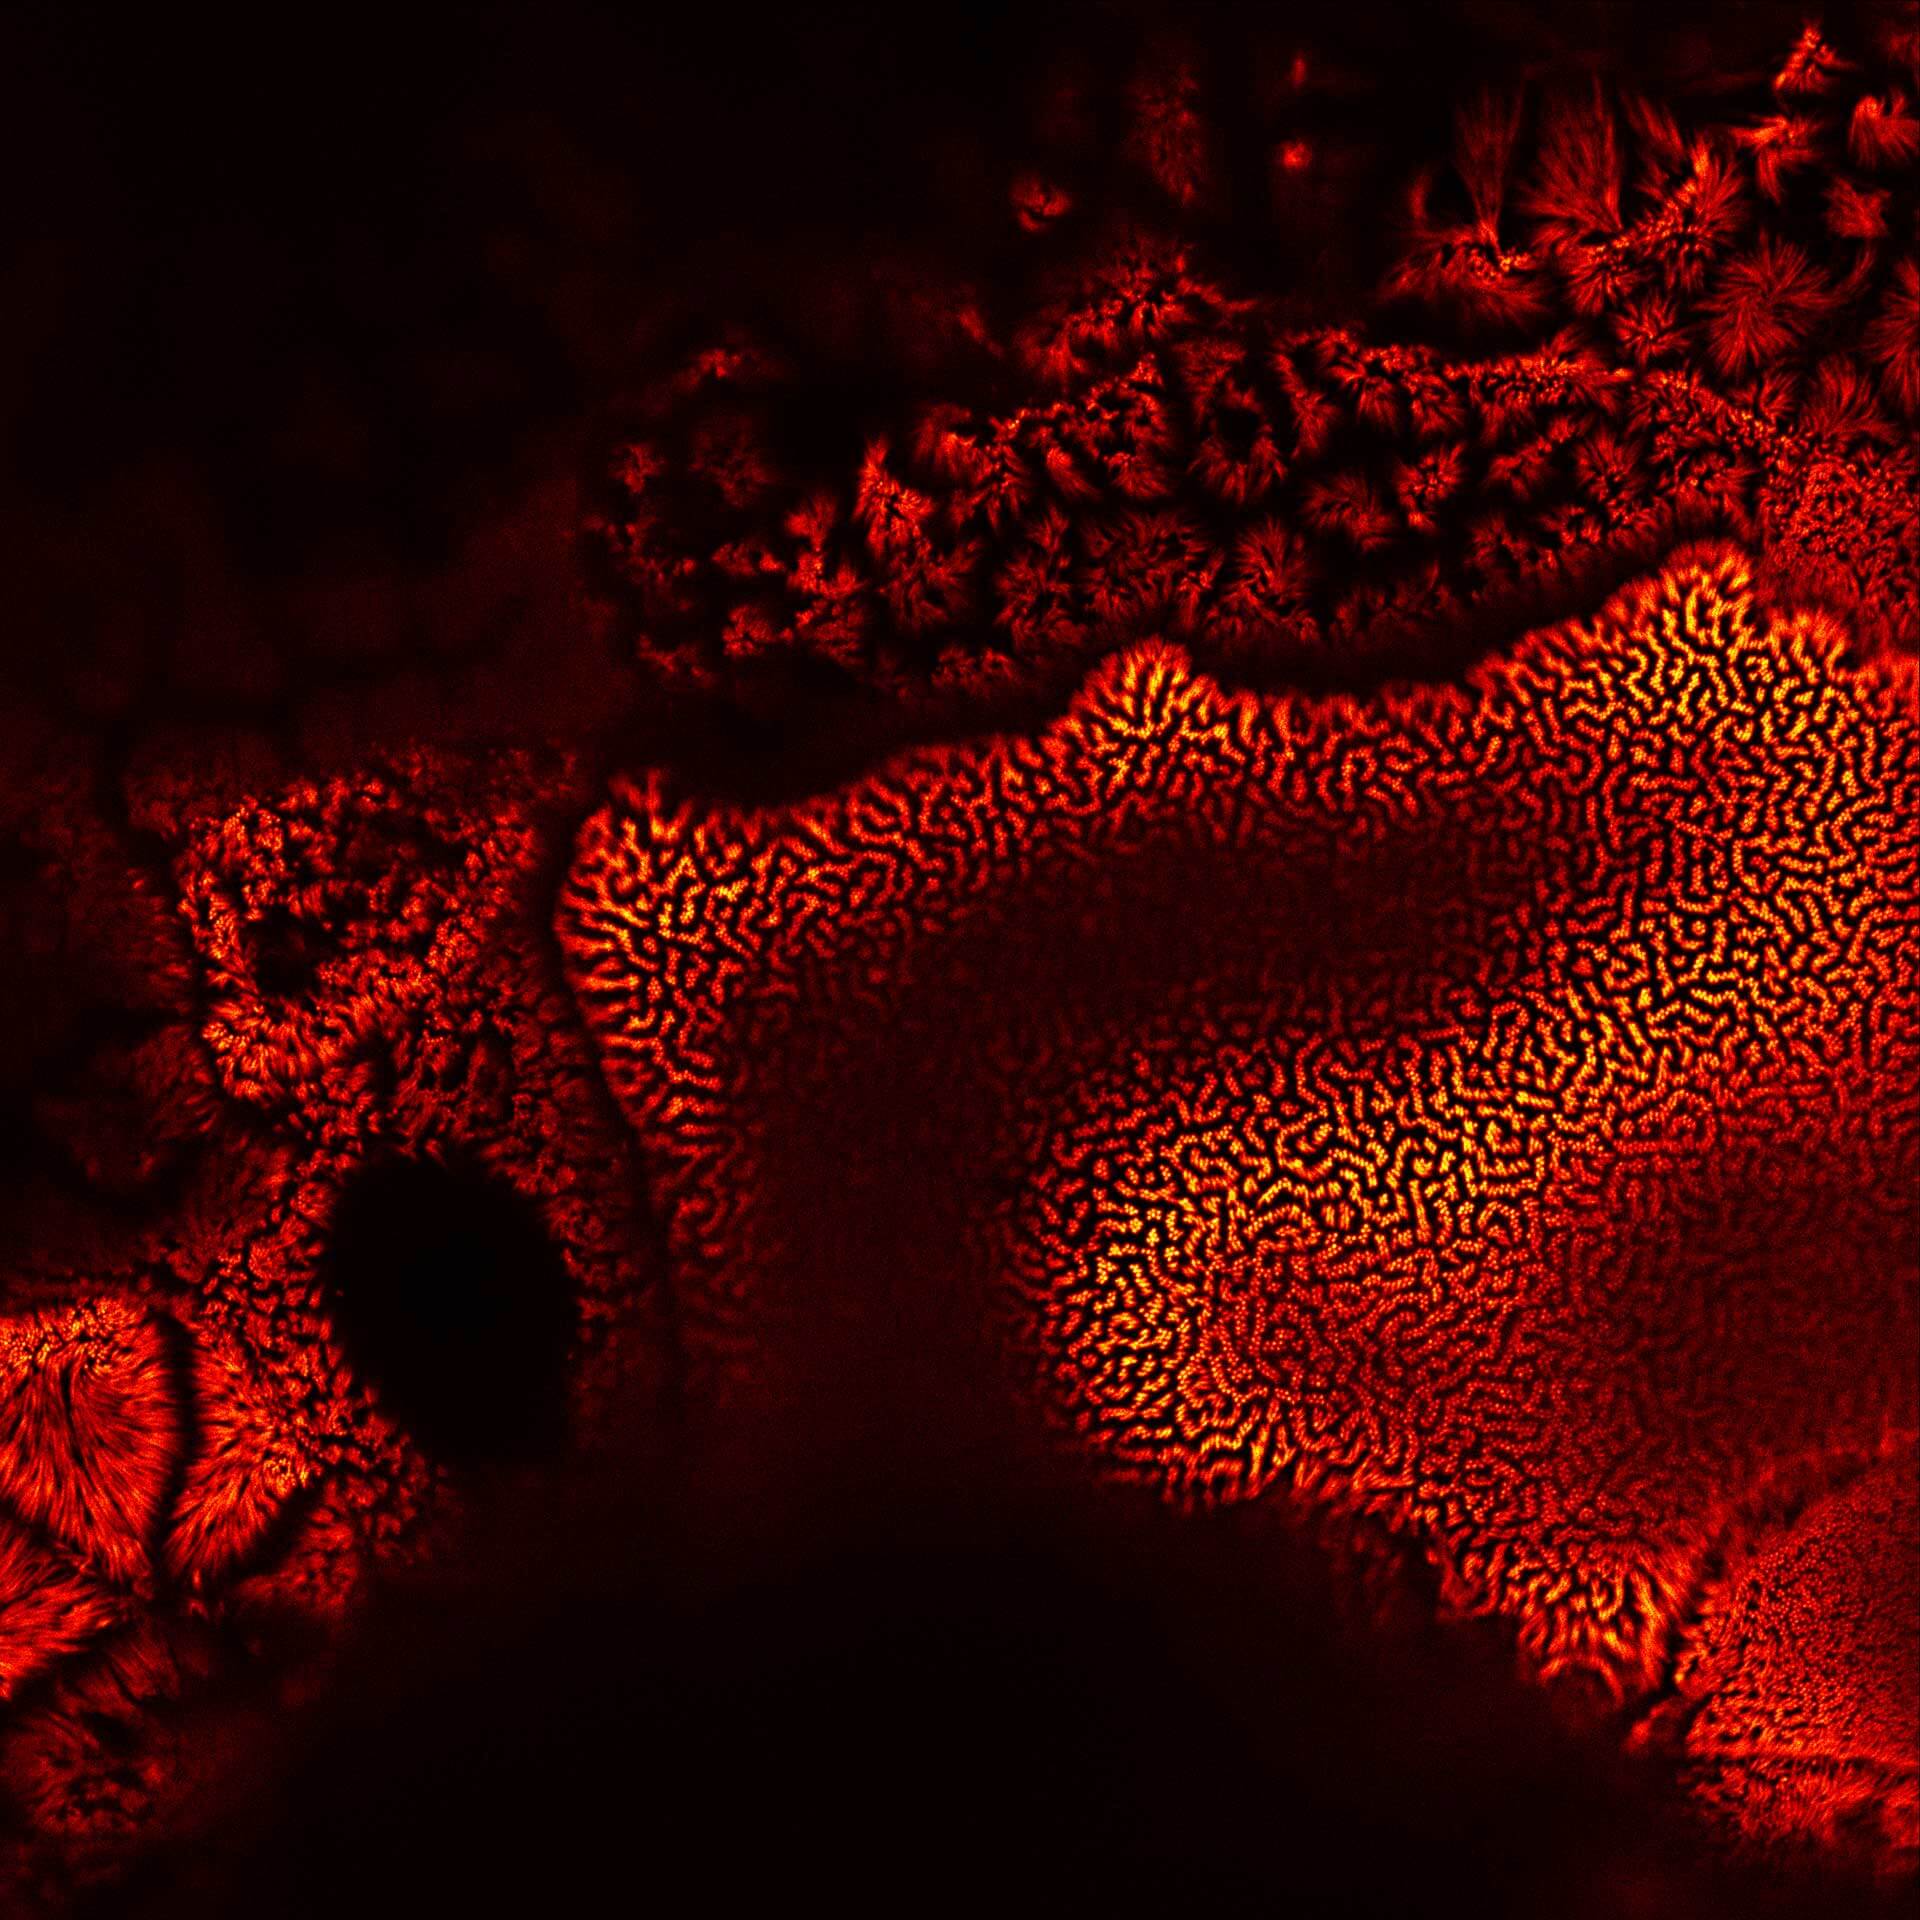
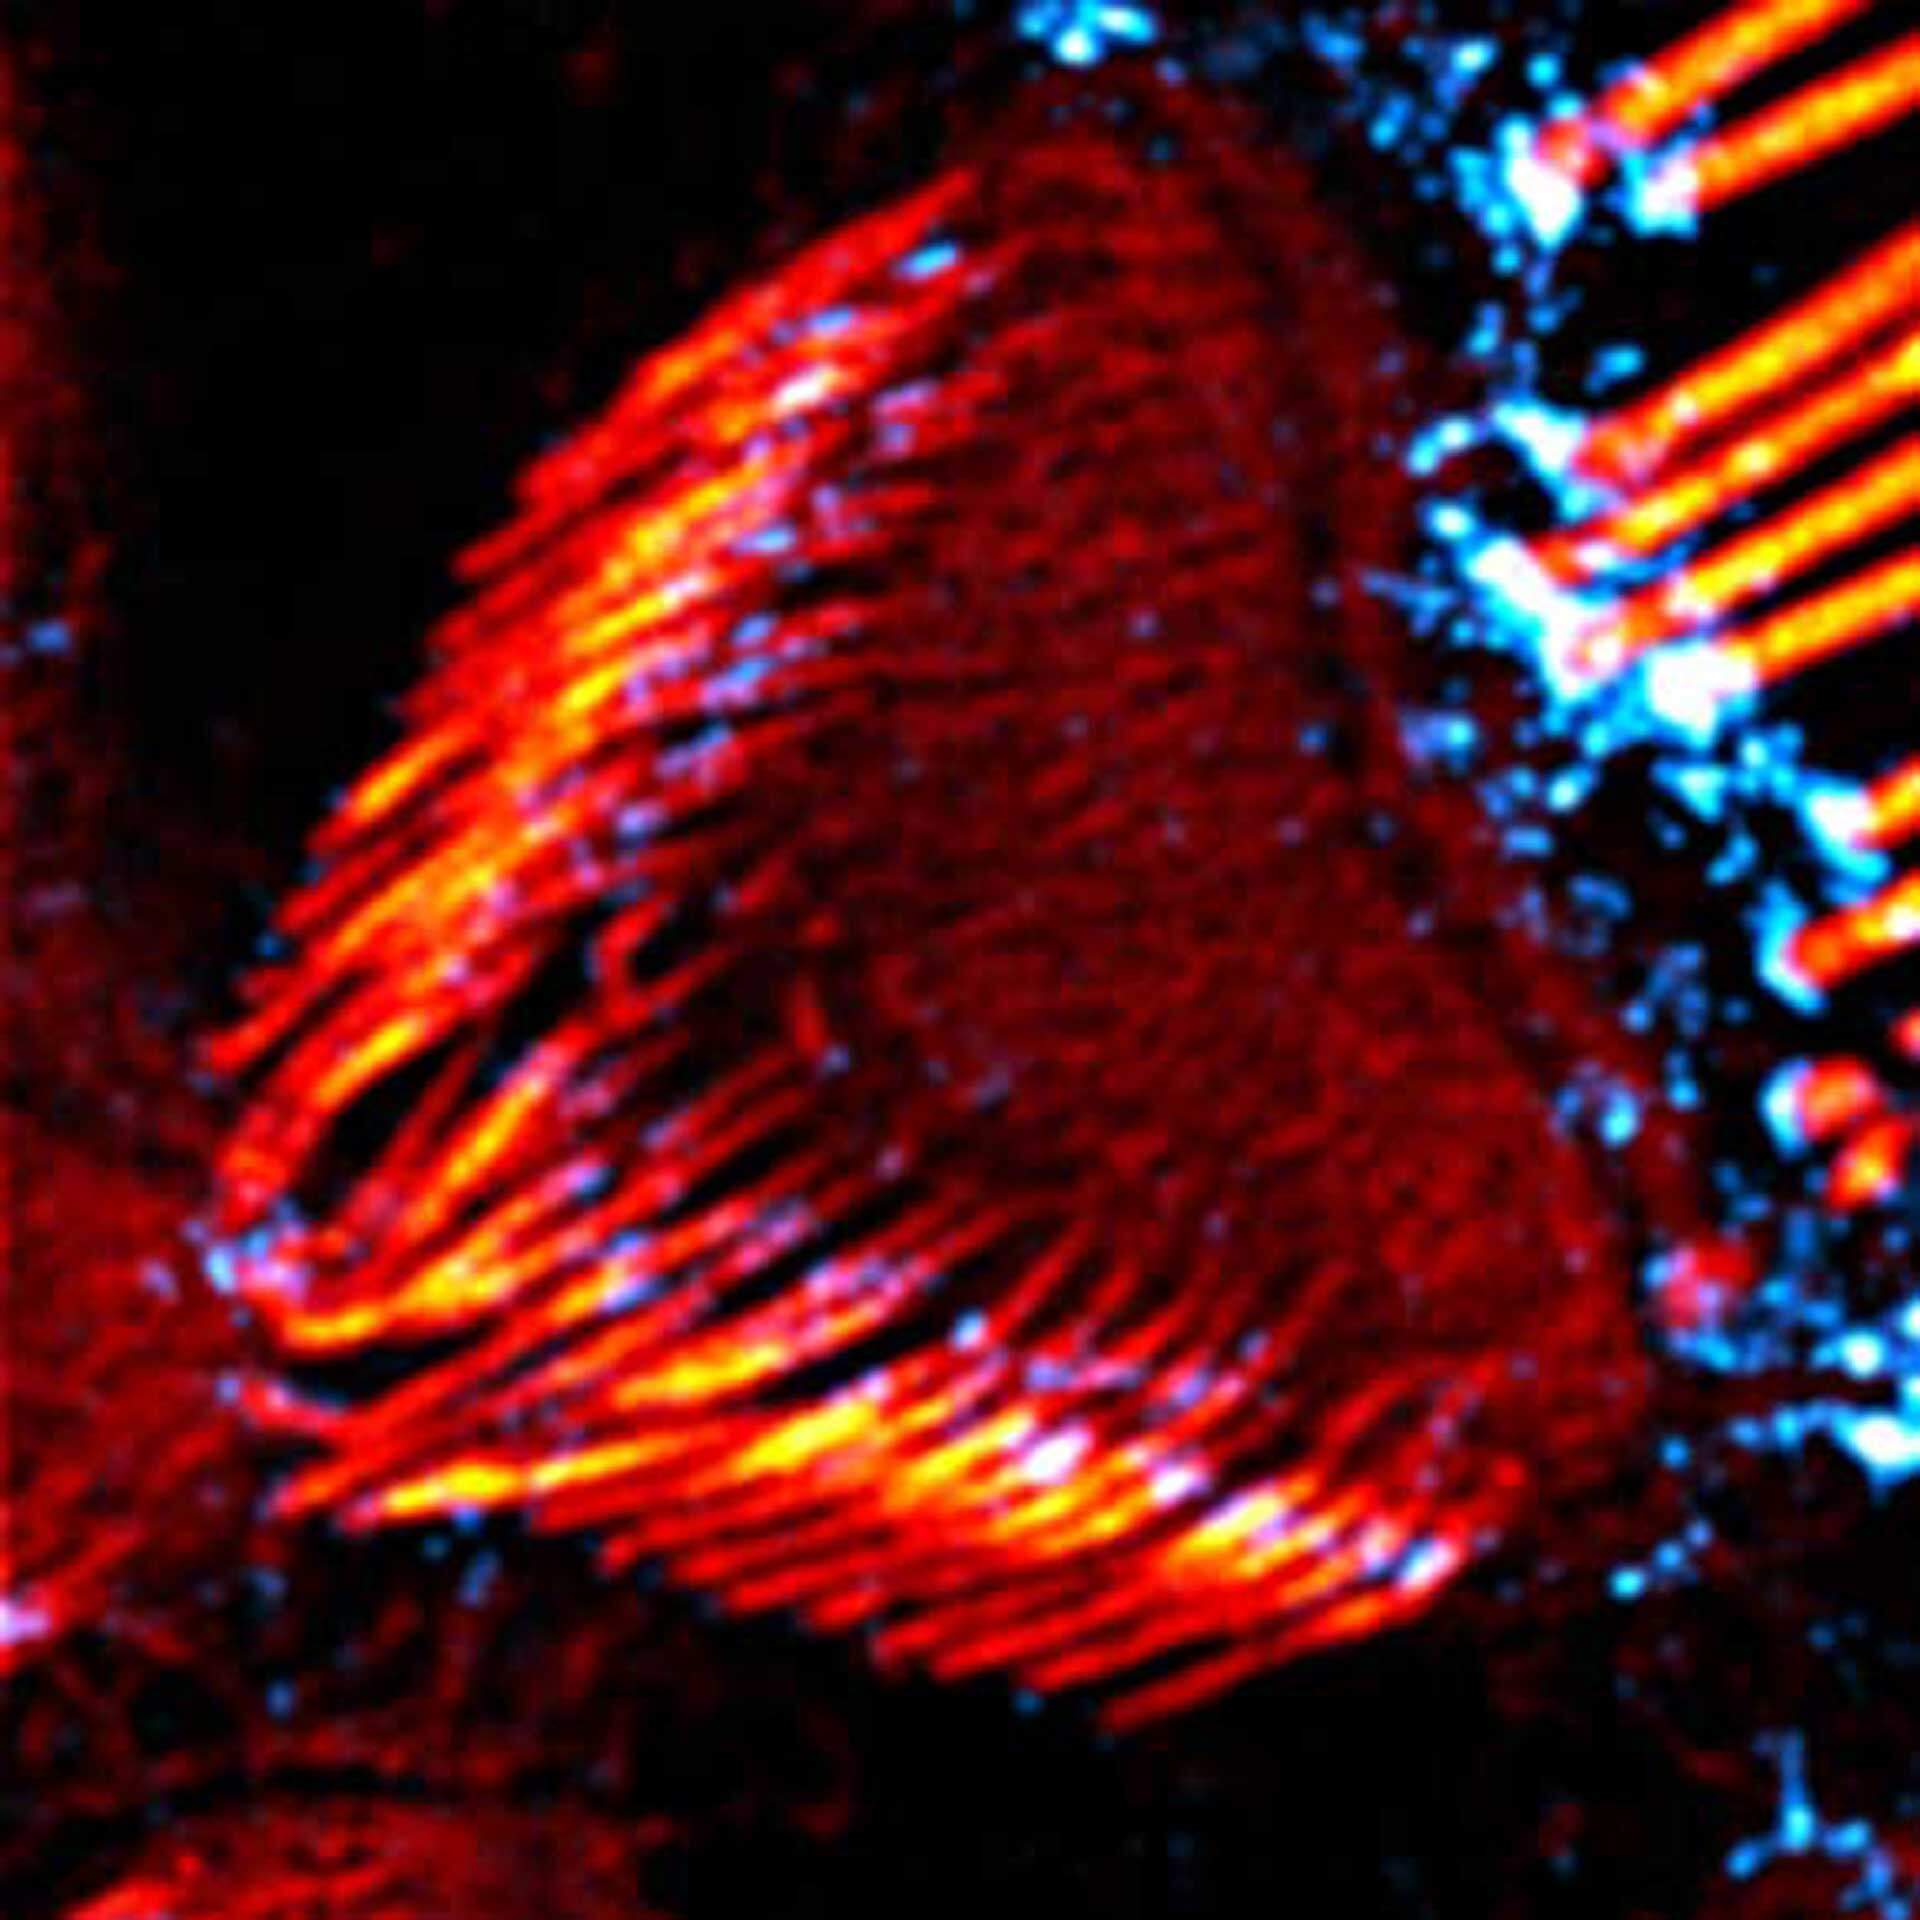
Actin stain of mouse inner ear hair cells using abberior STAR RED phalloidin. Zoom in for full effect.
Samples were prepared by Dr. Christian Vogl, InnerEarLab, UMG Göttingen, Germany.
Modules:

Description
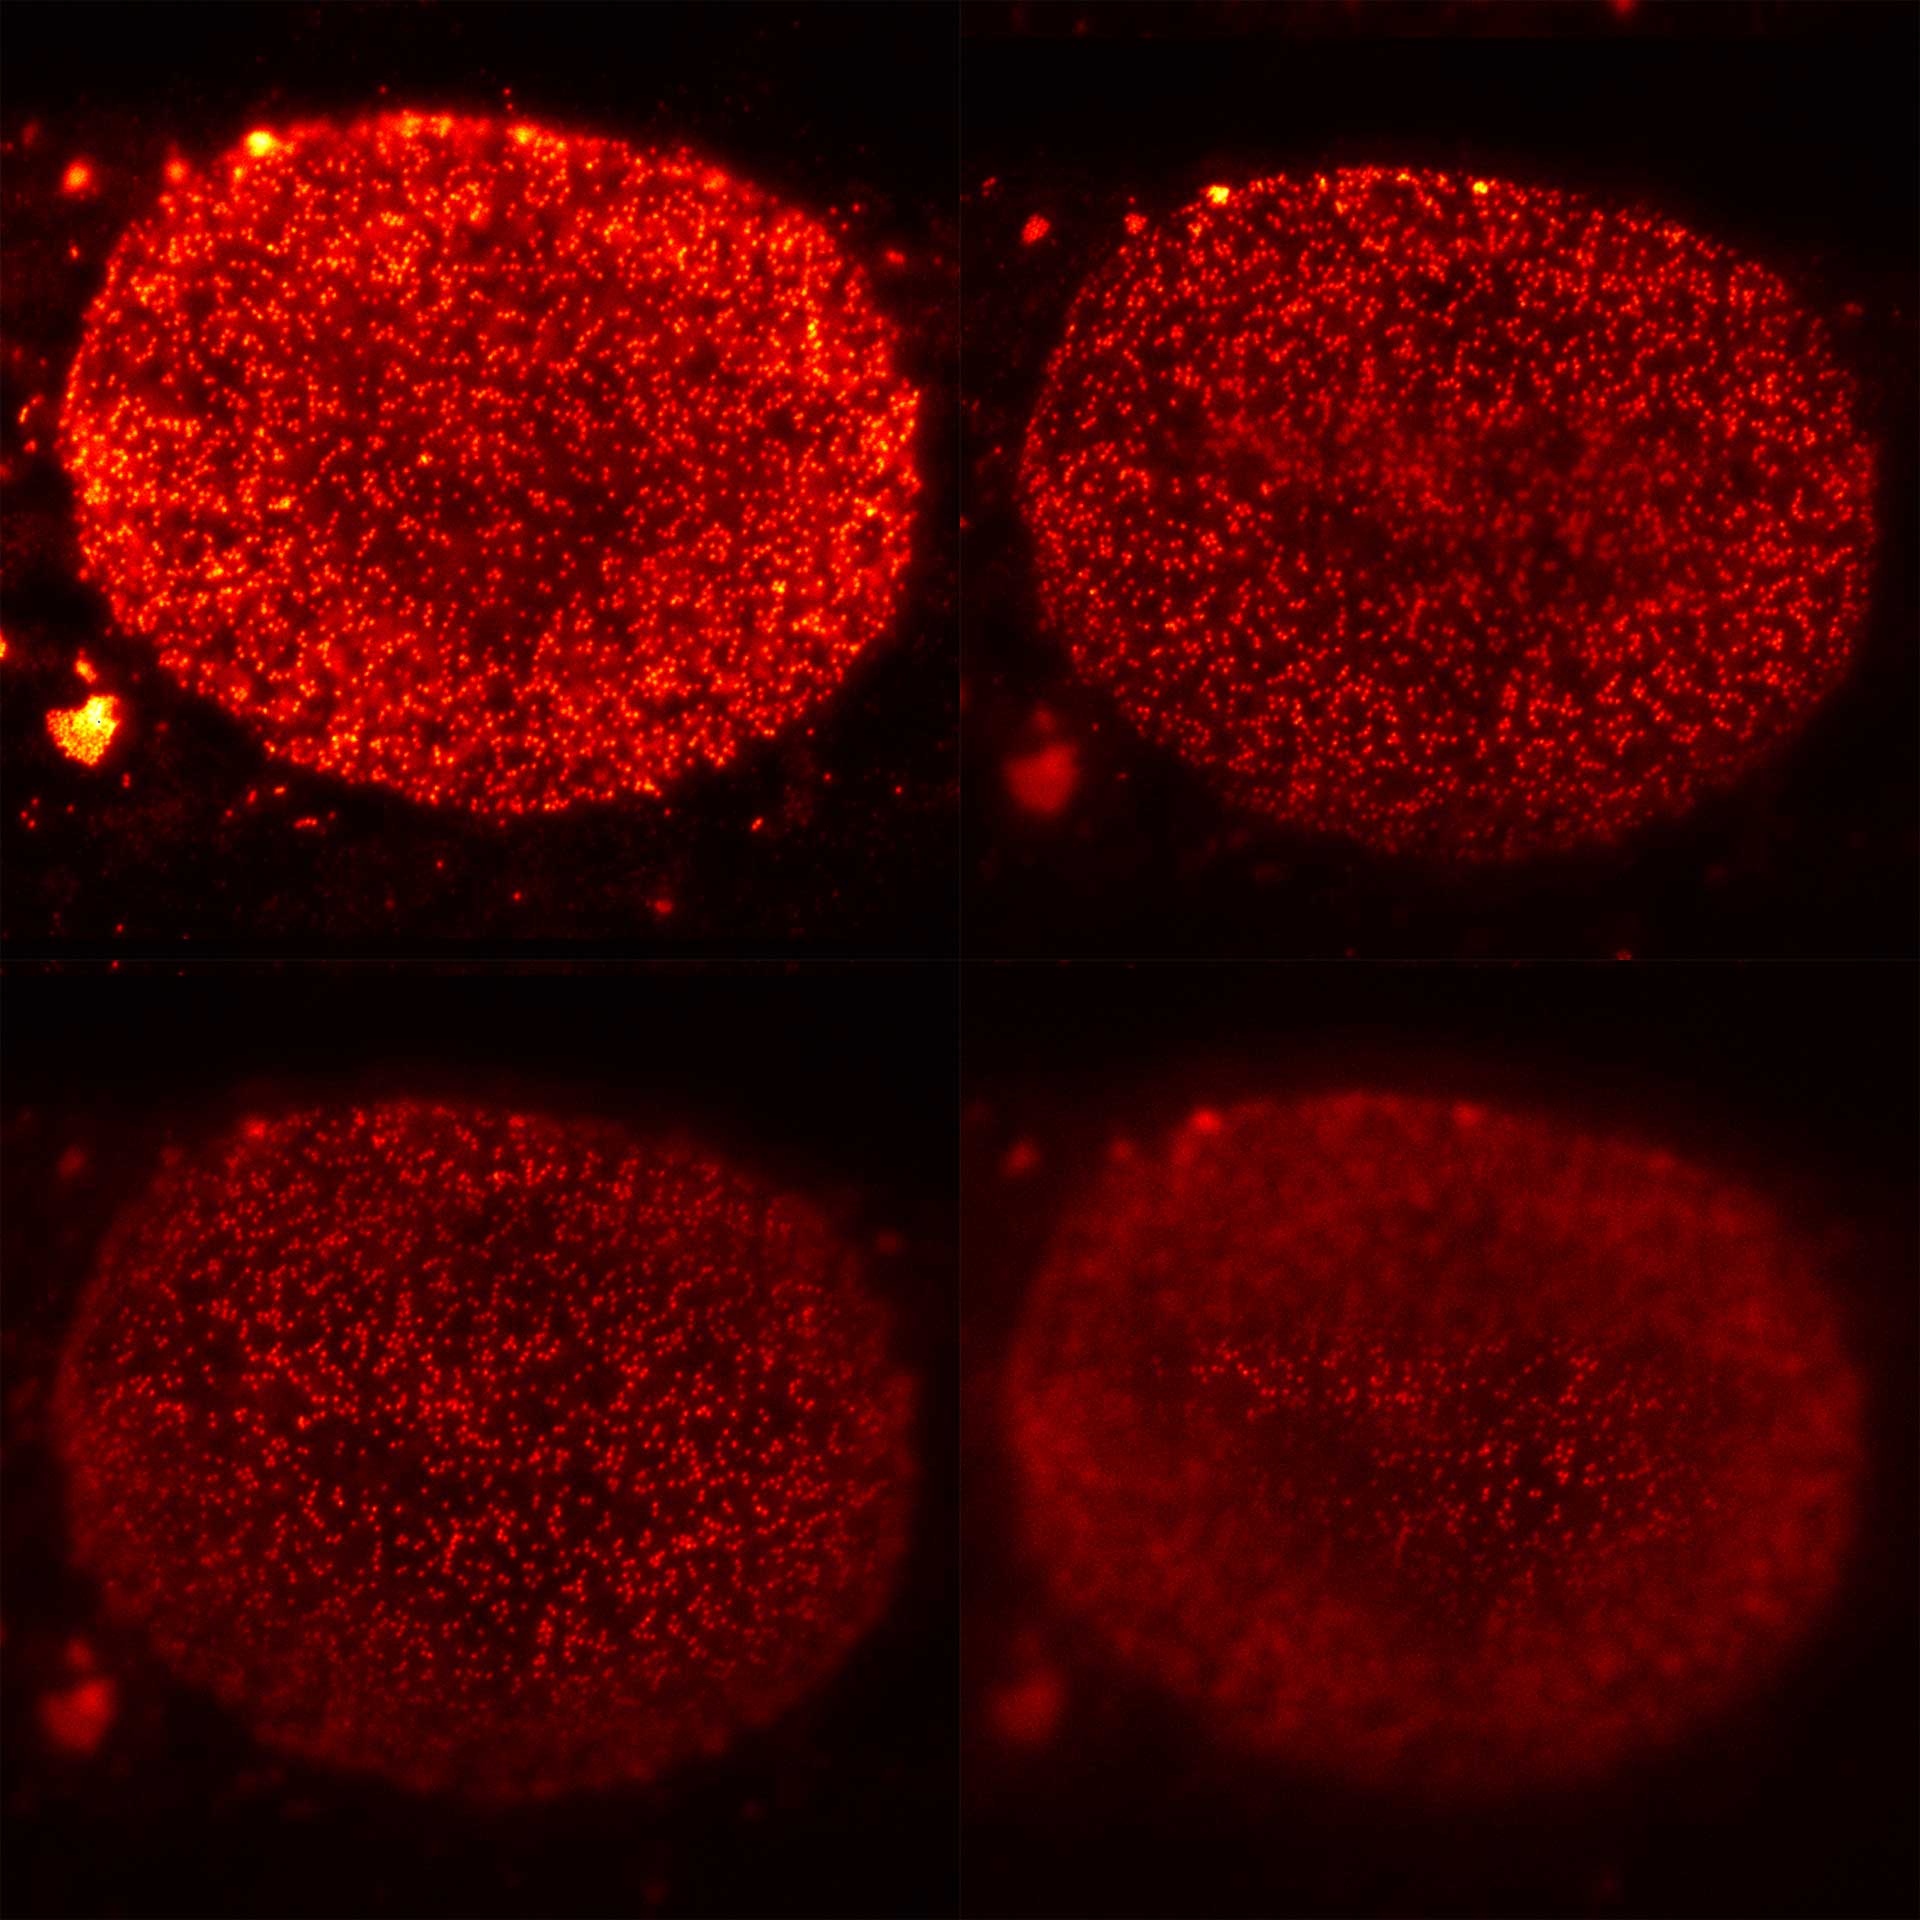
Four xy-planes from a volume stack recording of nuclear pore complexes (NUPs). With MATRIX, nuclear pores that are not in focus are effectively removed from the image.
Modules:
Description
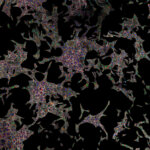
Cultured mammalian cells (NUP, Giantin, and Vimentin, labeled with abberior STAR RED, STAR ORANGE, STAR GREEN). Out-of-focus contributions of all three types of structures is effectively removed and section is improved.
Modules:
Description
Two proteins in the Golgi apparatus were immunolabelled using primary antibodies specific for GM130 and Giantin and secondary antibodies coupled to abberior STAR 580 and abberior STAR 635P. Shown is RAW DATA. Images were acquired using a STEDYCON attached to a Zeiss Axio Imager Z2.
Description
Vero cells, Vimentin (green, abberior STAR Red) and Phalloidin (white, abberior STAR Orange)
Modules:

Description
Centrosome linker. U2OS cells in which the centrosome-linker-protein rootletin was immunolabelled using secondary antibodies coupled to abberior STAR RED. The sample was prepared by R. Vlijm at MPI for Medical Research, Heidelberg, Germany. Imaged with abberior Instruments’ STEDYCON and deconvolved with SVI Huygens optimized for STEDYCON.
Description
Description
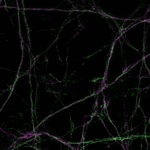
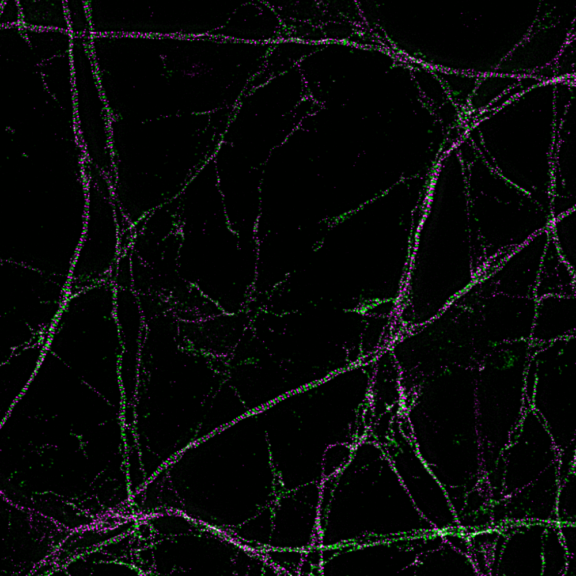
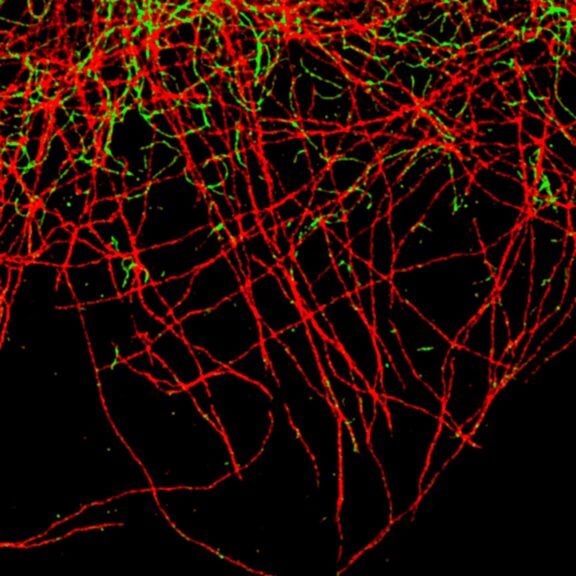
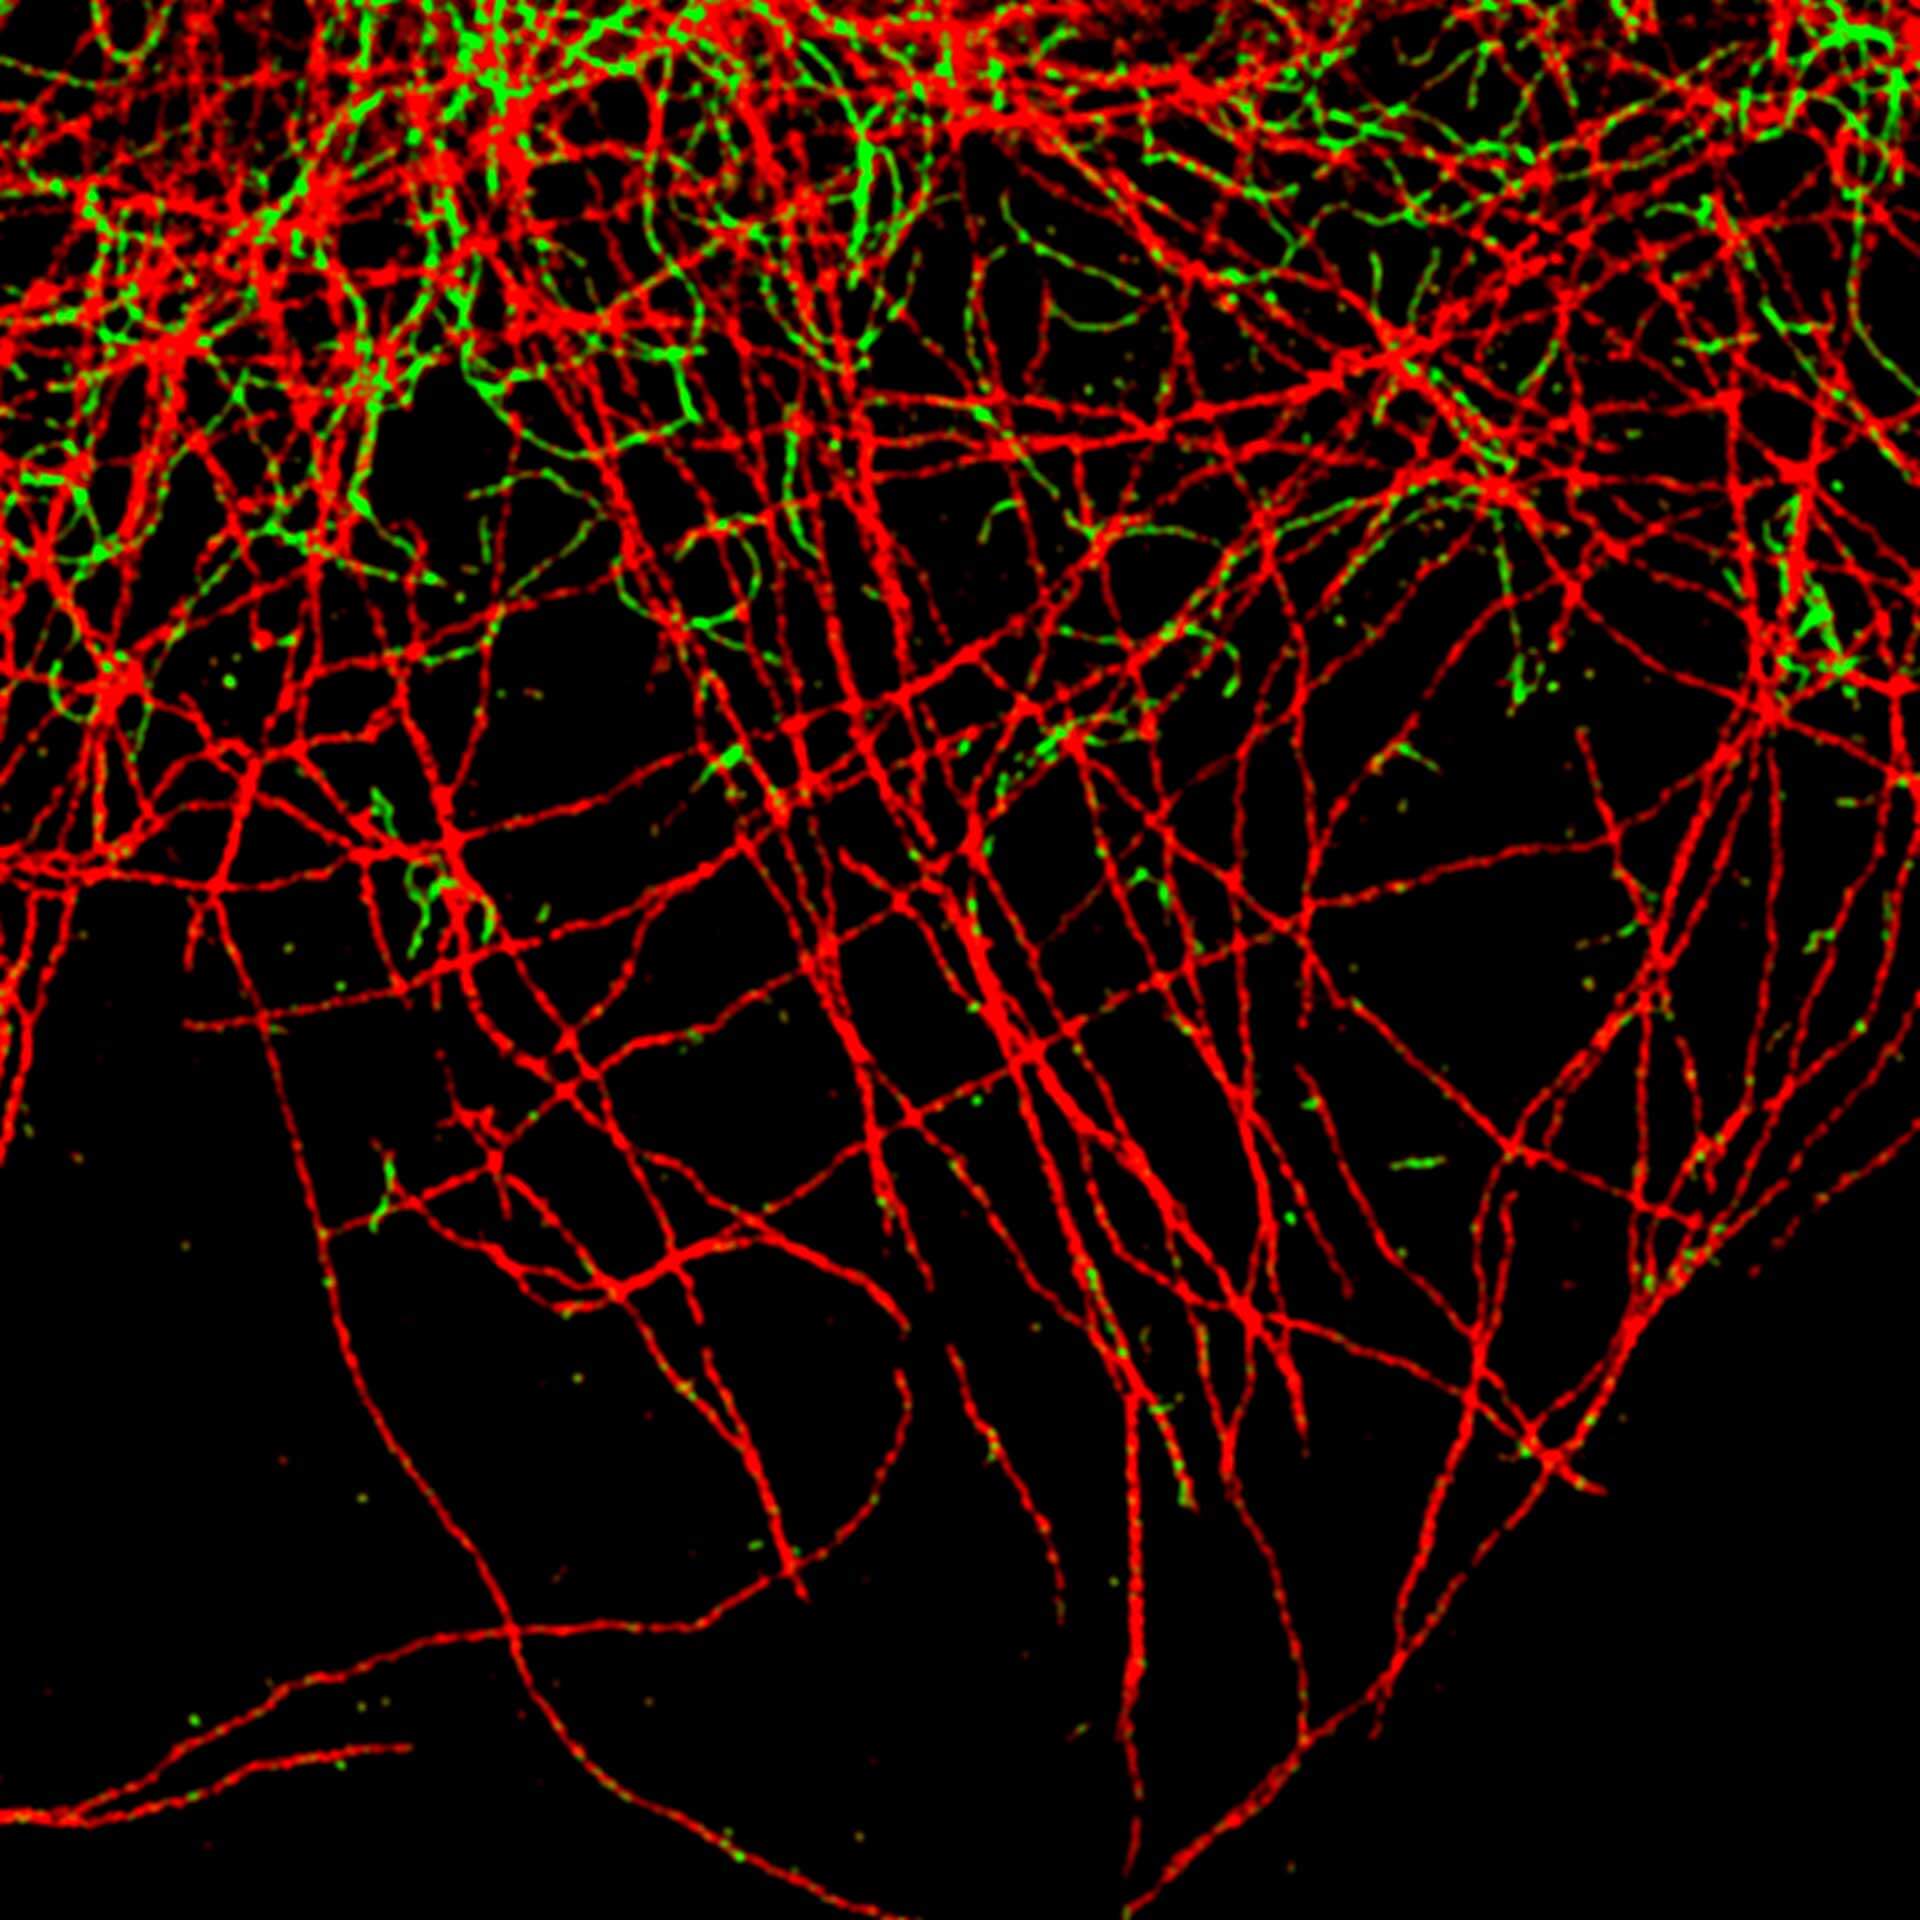
Primary hippocampal neurons with cytoskeleton proteins labeled (magenta, alpha-Adducin, abberior STAR 635P and green, ßII spectrin, Alexa 594). Imaged with abberior Instruments’ STEDYCON and deconvolved with SVI Huygens optimized for STEDYCON.
Description
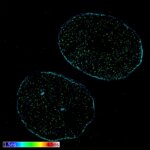
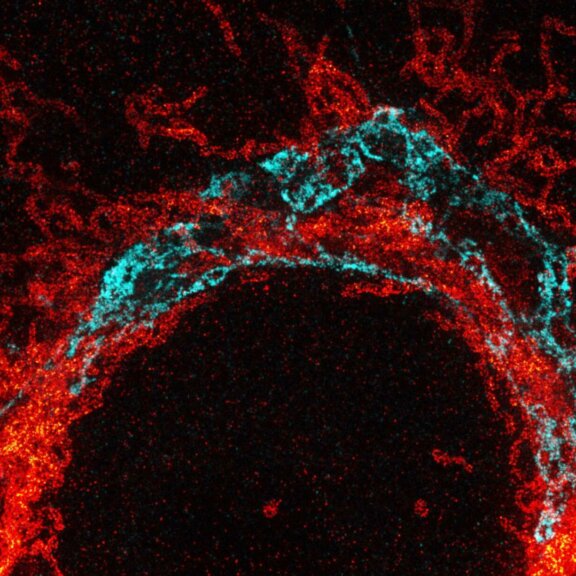
Maximum intensity projection of a z-stack showing nuclear pore complex protein (red, abberior STAR RED) and peroxisomes (cyan, Alexa 594) in mammalian cells. Imaged with abberior Instruments’ STEDYCON and deconvolved with SVI Huygens optimized for STEDYCON.
Description
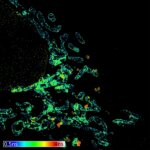
Actin in microvilli of Caco2 cells. Fixed cells were stained with abberior STAR RED phalloidin. MATRIX detection removes background signal and dramatically improves optical sectioning for 2D-STED.
Samples by Prof. Dorothee Günzel & Roman Mannweiler, Institut für Klinische Physiologie, Charité - Universitätsmedizin Berlin.
Modules:
Description
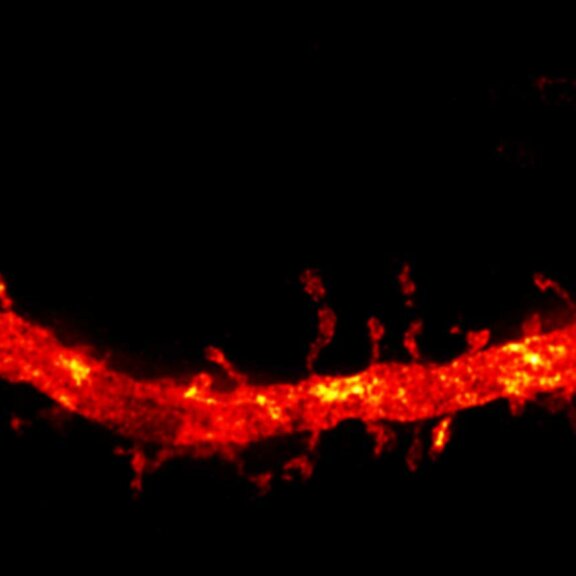
Body wall preparation of a 3rd instar Drosophila melanogaster larva. Synapses at the neuromuscular junction are visualized by immunostaining against Bruchpilot (Brp), an integral component of active zones in Drosophila. Images were acquired on a STEDYCON attached to an Olympus IX81. Images were kindly provided by Dr. Nadine Ehmann, Institute of Physiology, Neurophysiology, University of Würzburg.
Description
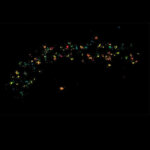
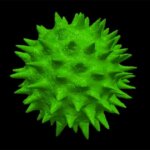
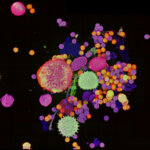
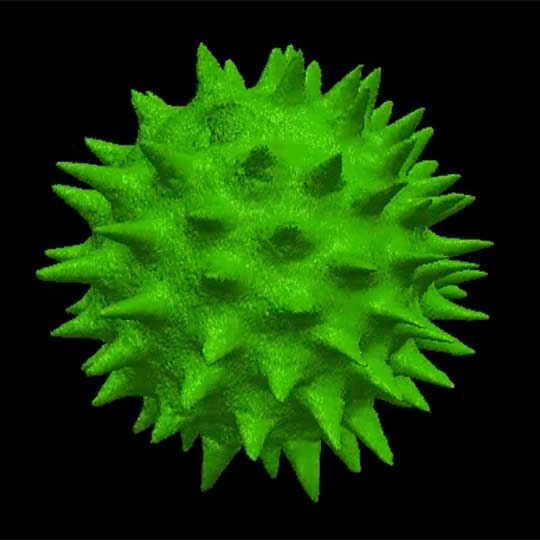
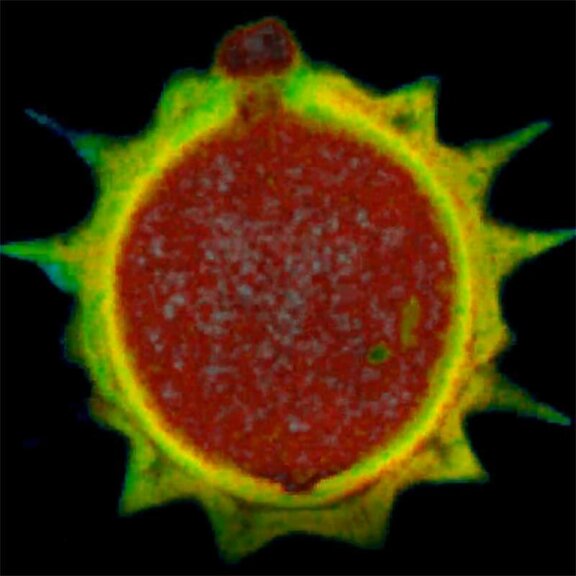
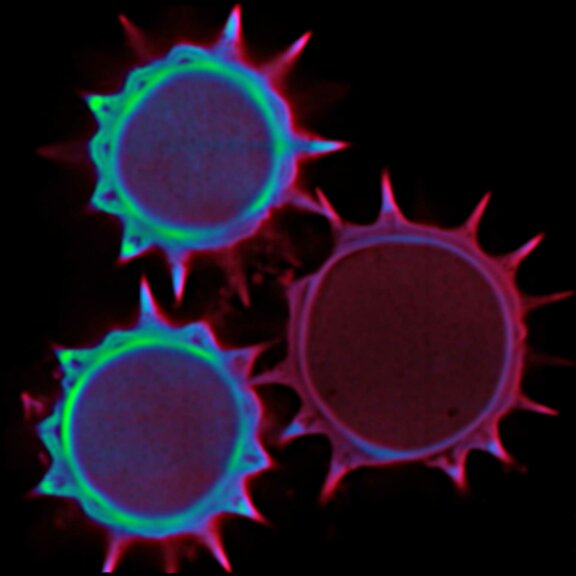
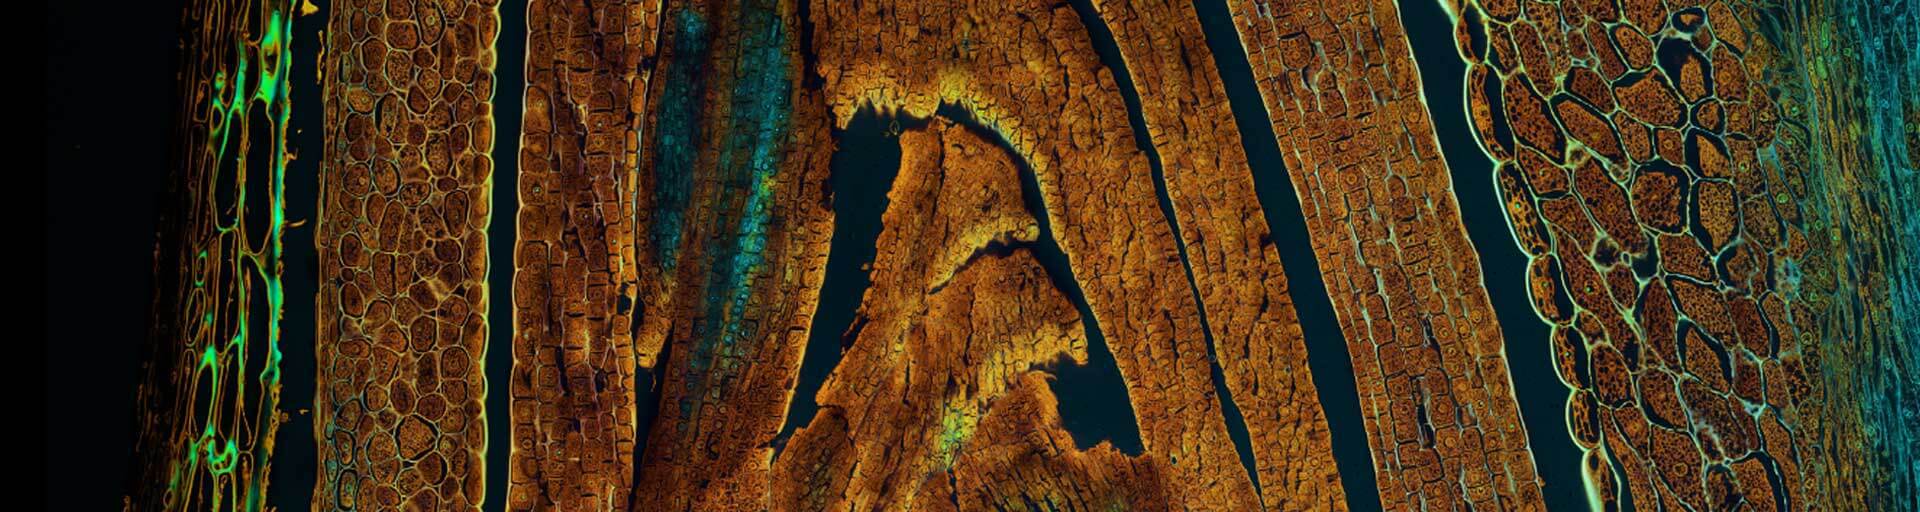
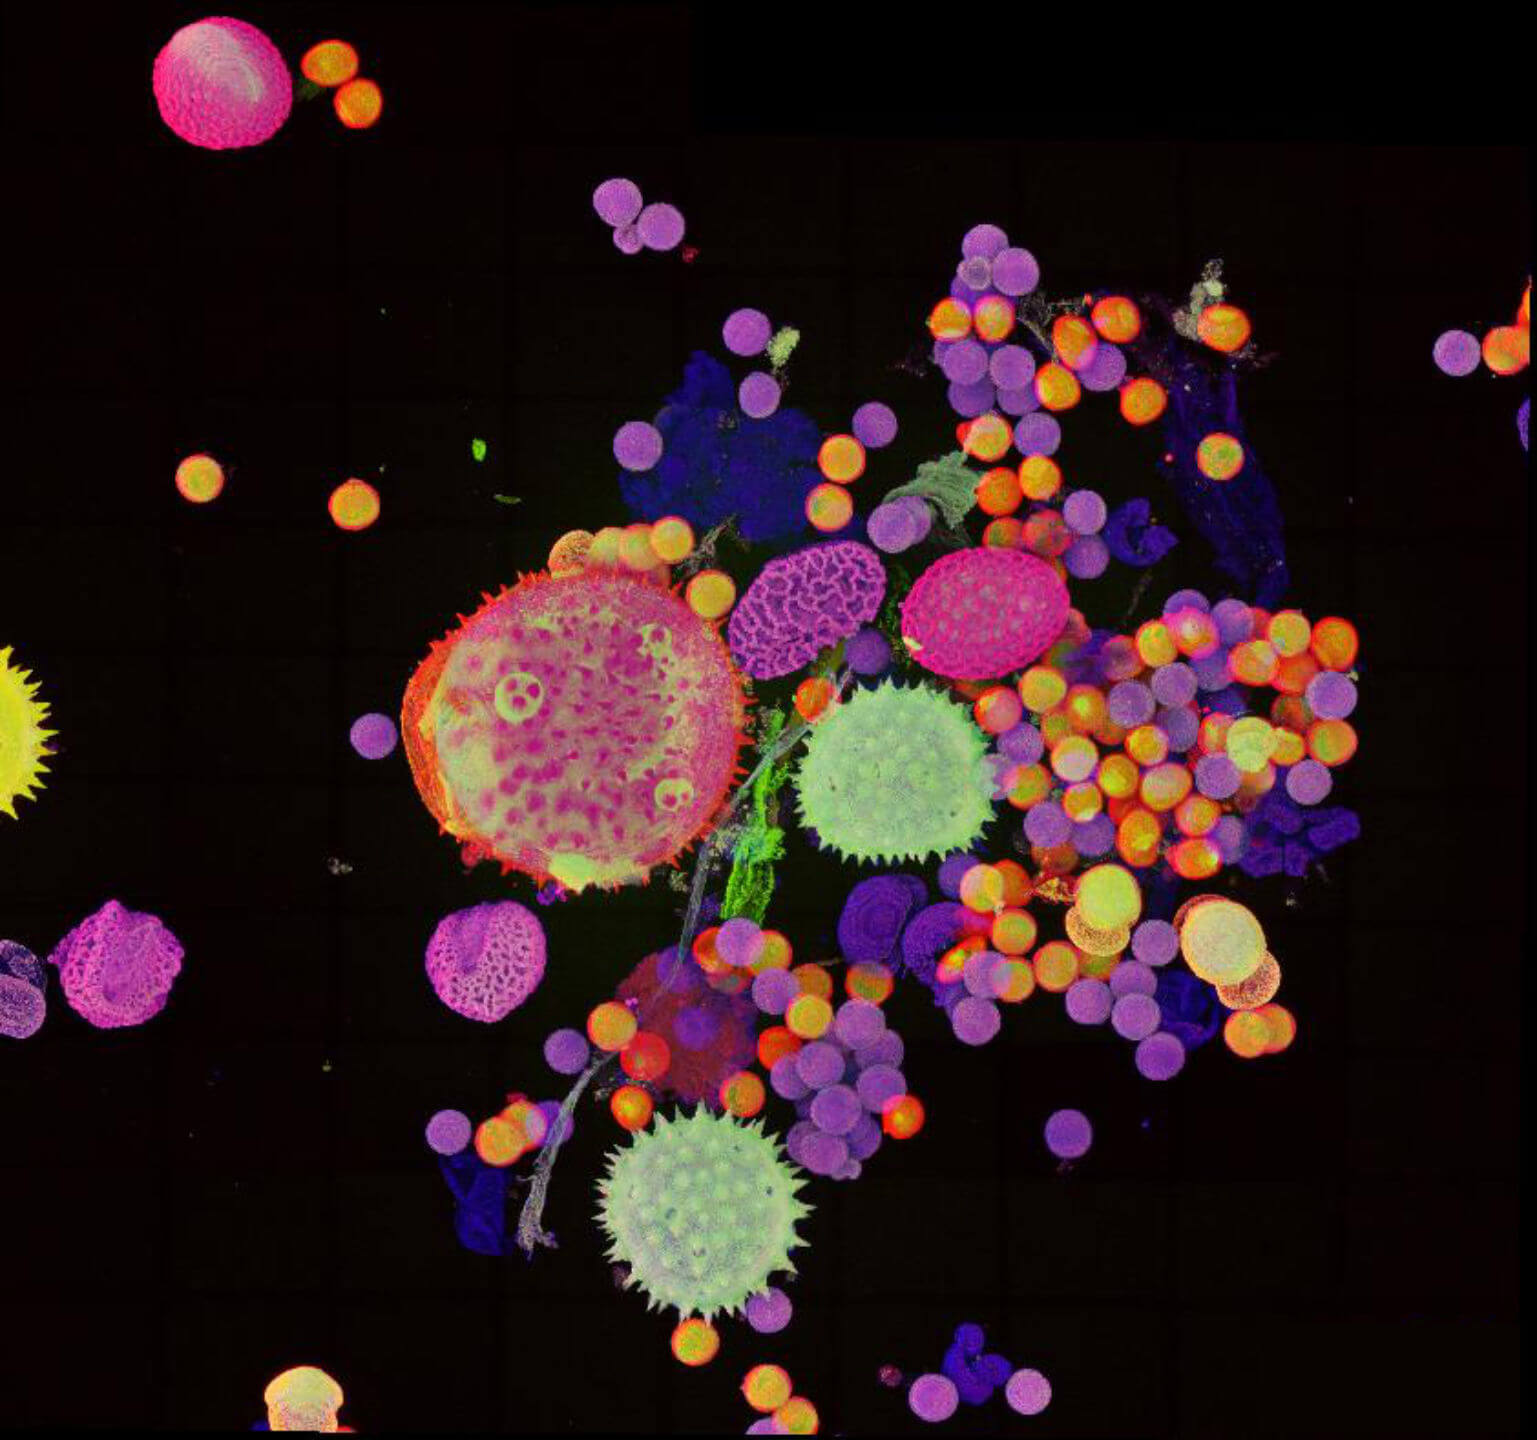
Pollen autofluorescence imaged with a STEDYCON on an IX83 microscope frame. z-stacks on 95 tiles were acquired and stitched with SVI Huygens.
Description
Immunolabelling of βIV-spectrin, a scaffolding protein of the axon initial segment, using a self-made primary antibody and Alexa 594 secondary antibody. Cryo-section of mouse neocortex cut at 20 µm. Images were acquired using a STEDYCON attached to a Zeiss AxioImager Z2. The sample was kindly provided by Dr. Maren Engelhardt, Institute of Neuroanatomy, Medical Faculty Mannheim, Heidelberg University.
Description
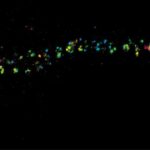
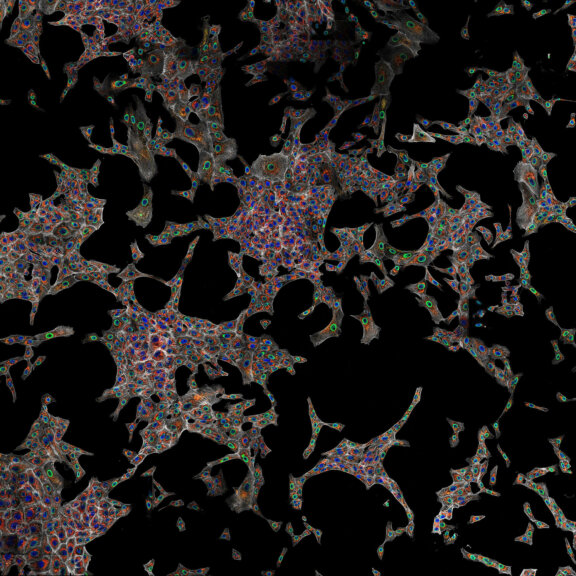
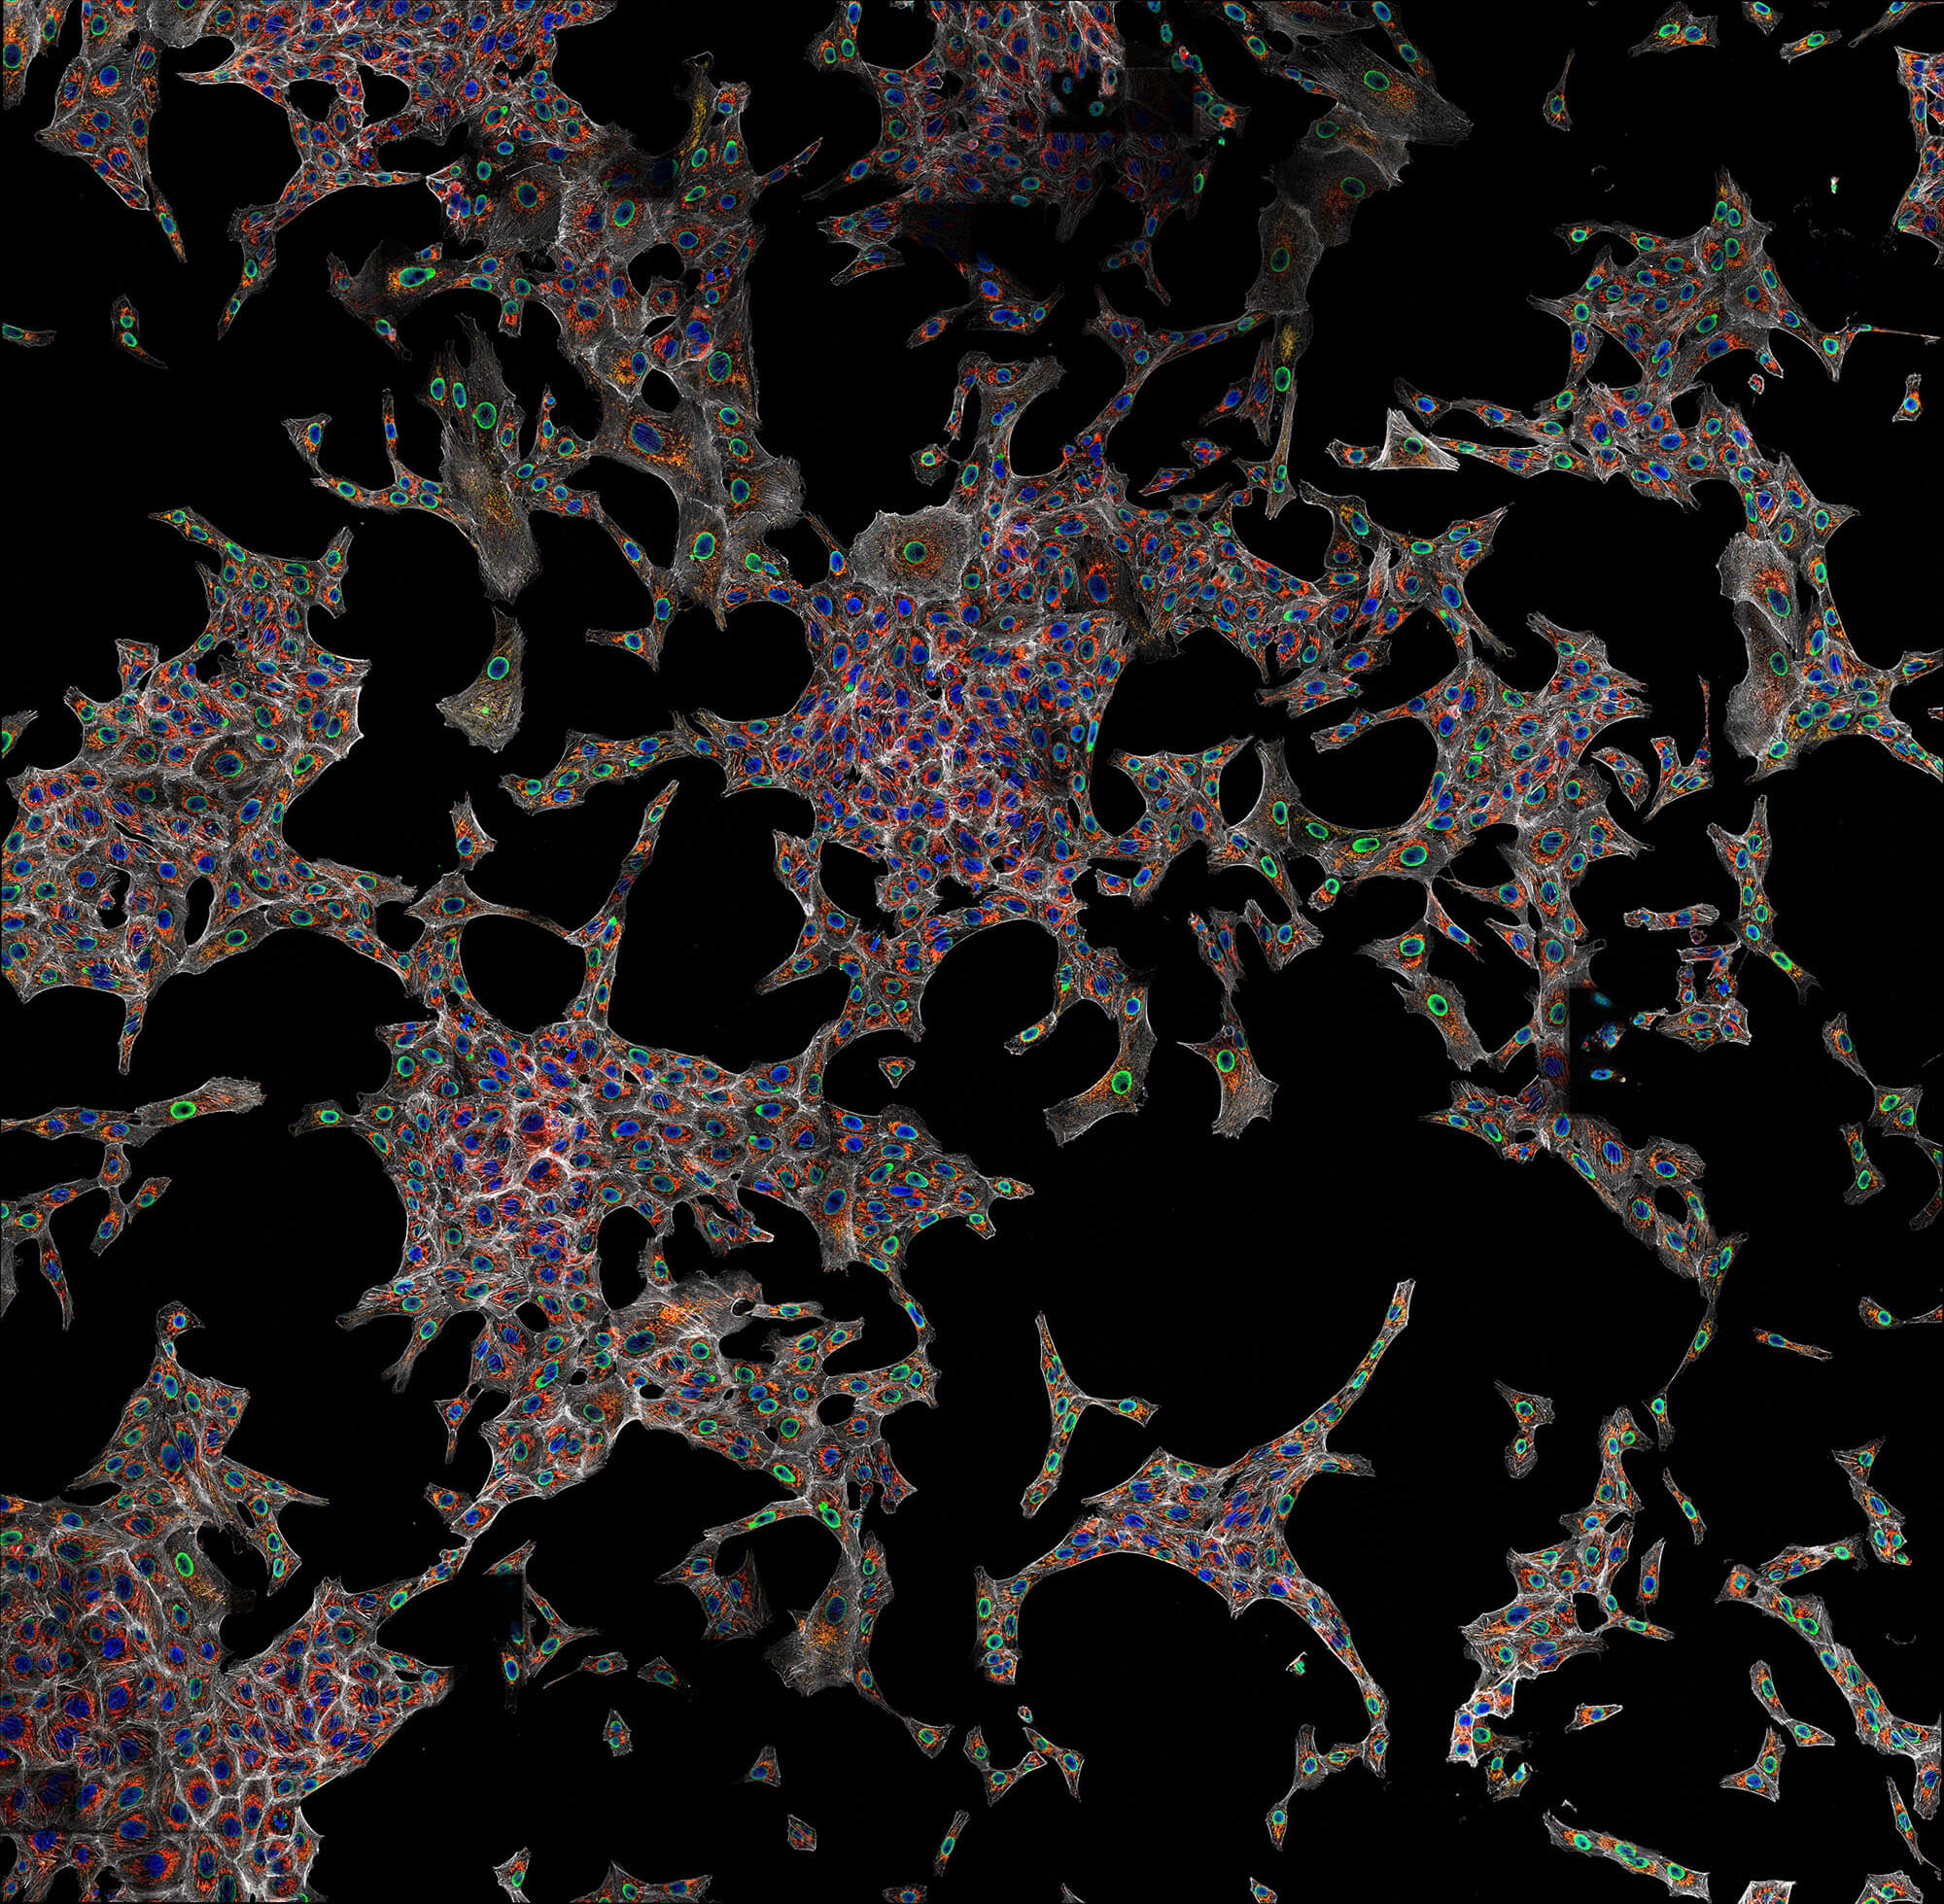
Confocal imaging of a large sample region. Shown is a 2.8 mm x 2.5 mm region, acquired using 35 by 29 tiles using the STEADYFOCUS and stitched with SVI Huygens. Sample: mammalian cells immunolabelled for the mitochondrial protein TOM20 (abberior STAR RED, red), double-stranded DNA to visualize mitochondrial DNA (abberior STAR ORANGE, green), phalloidin to label F-actin (abberior STAR GREEN, gray), and DAPI to label nuclei. Sample preparation by abberior GmbH.
Description
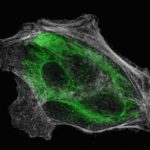
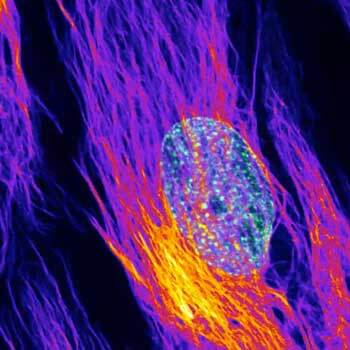
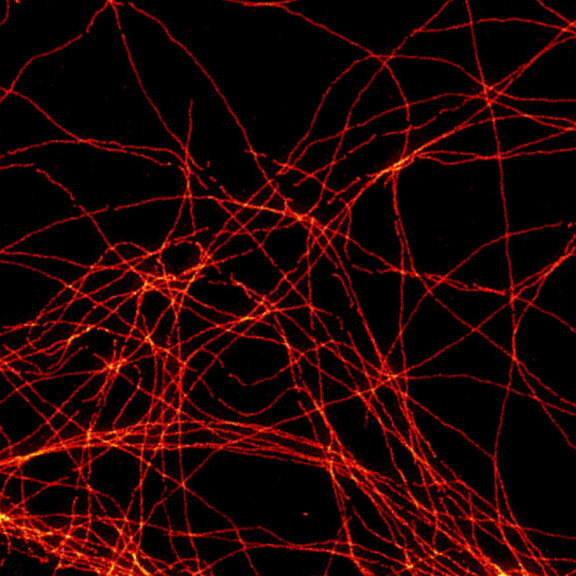
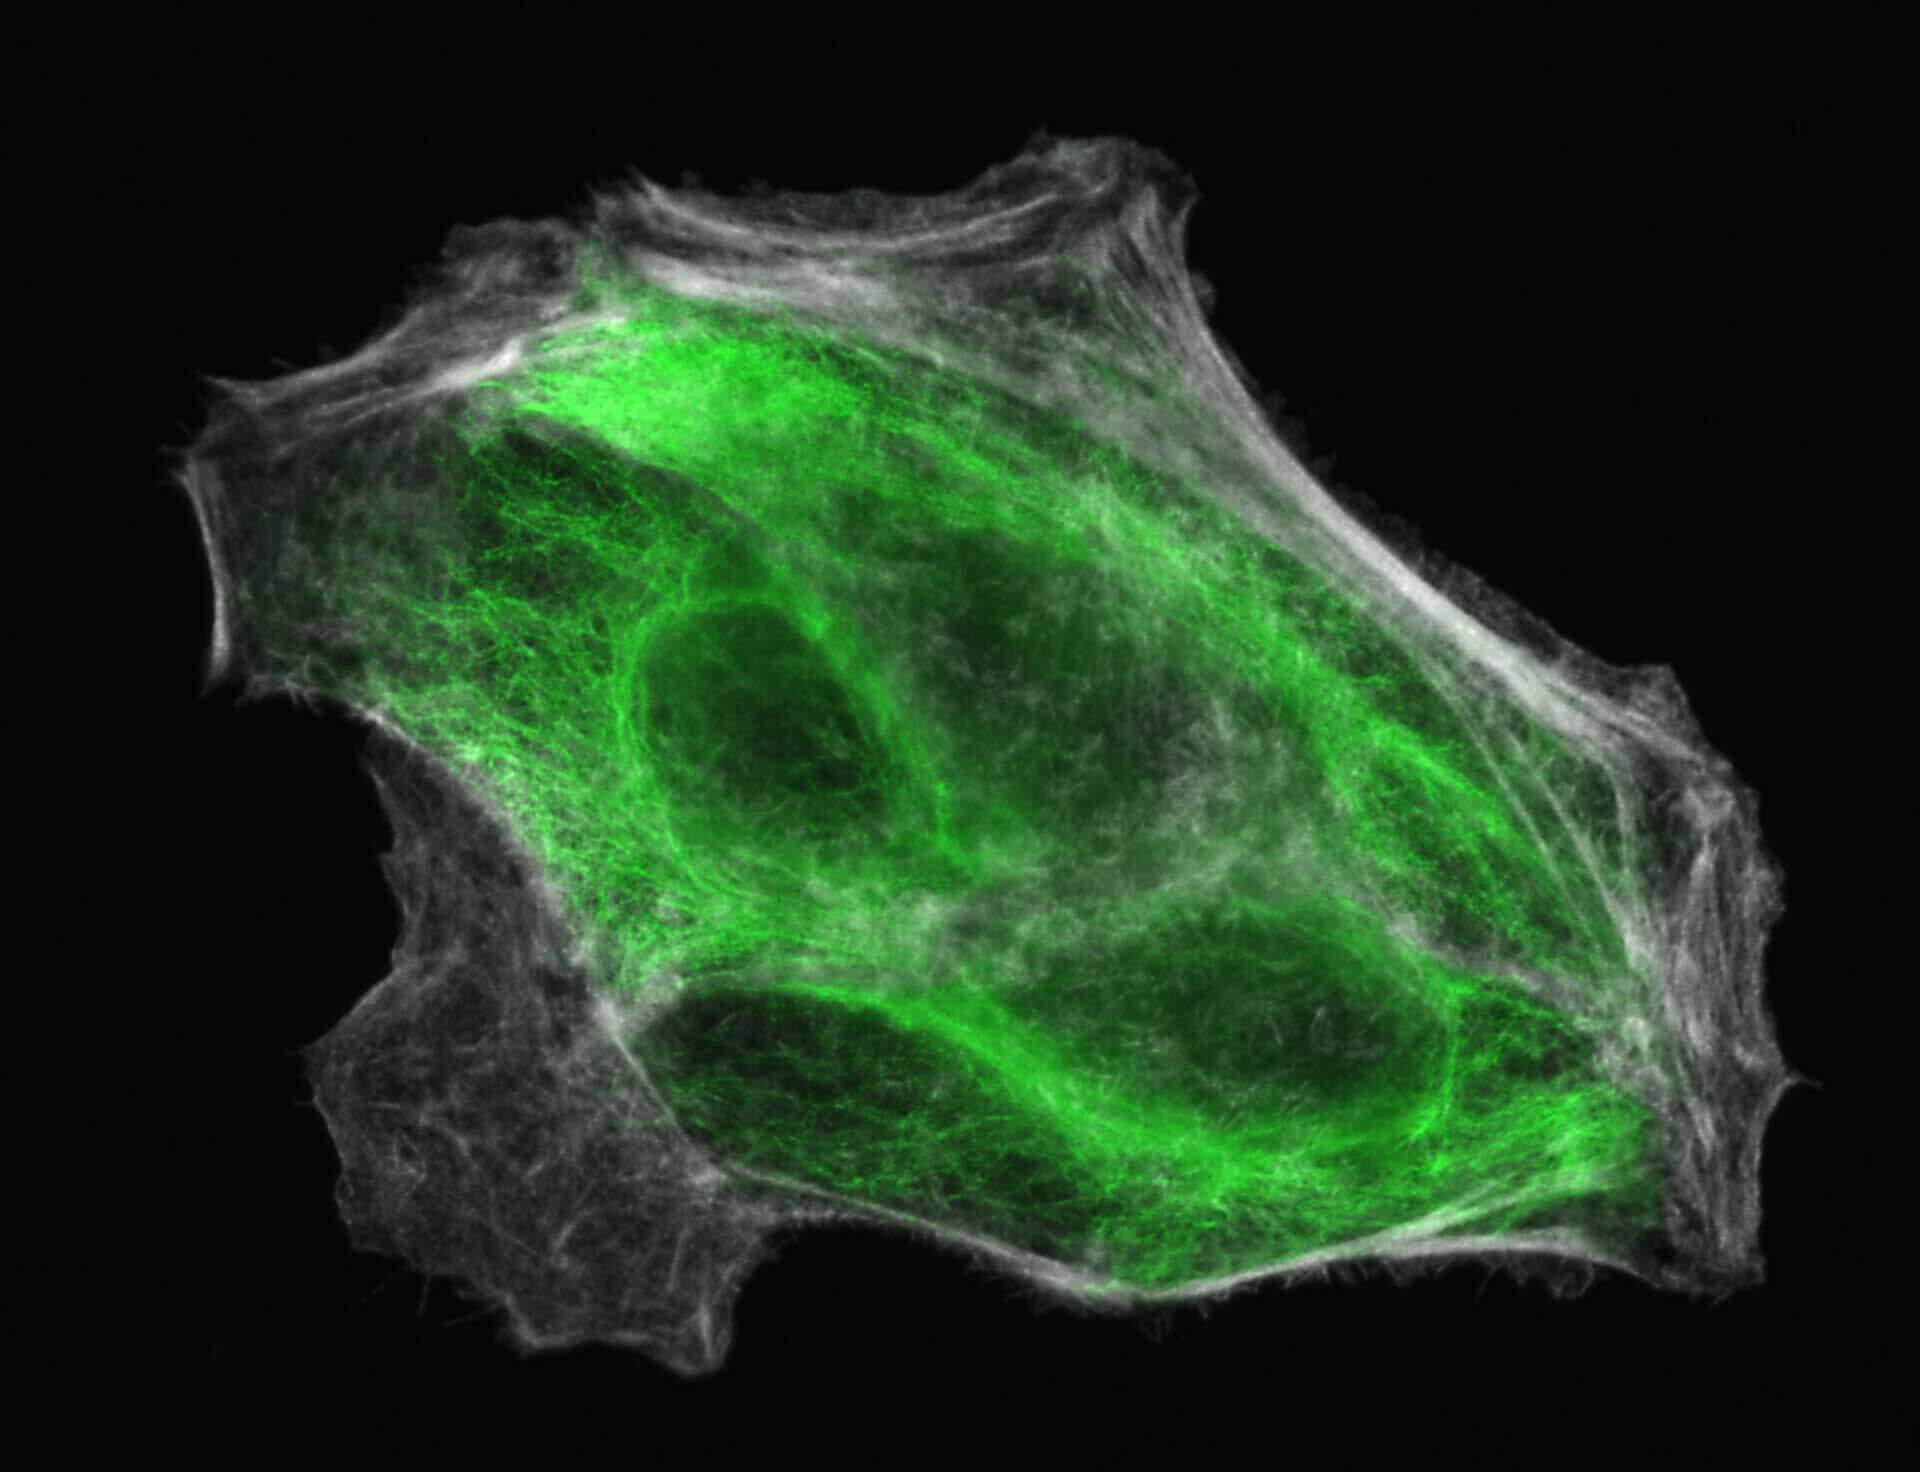
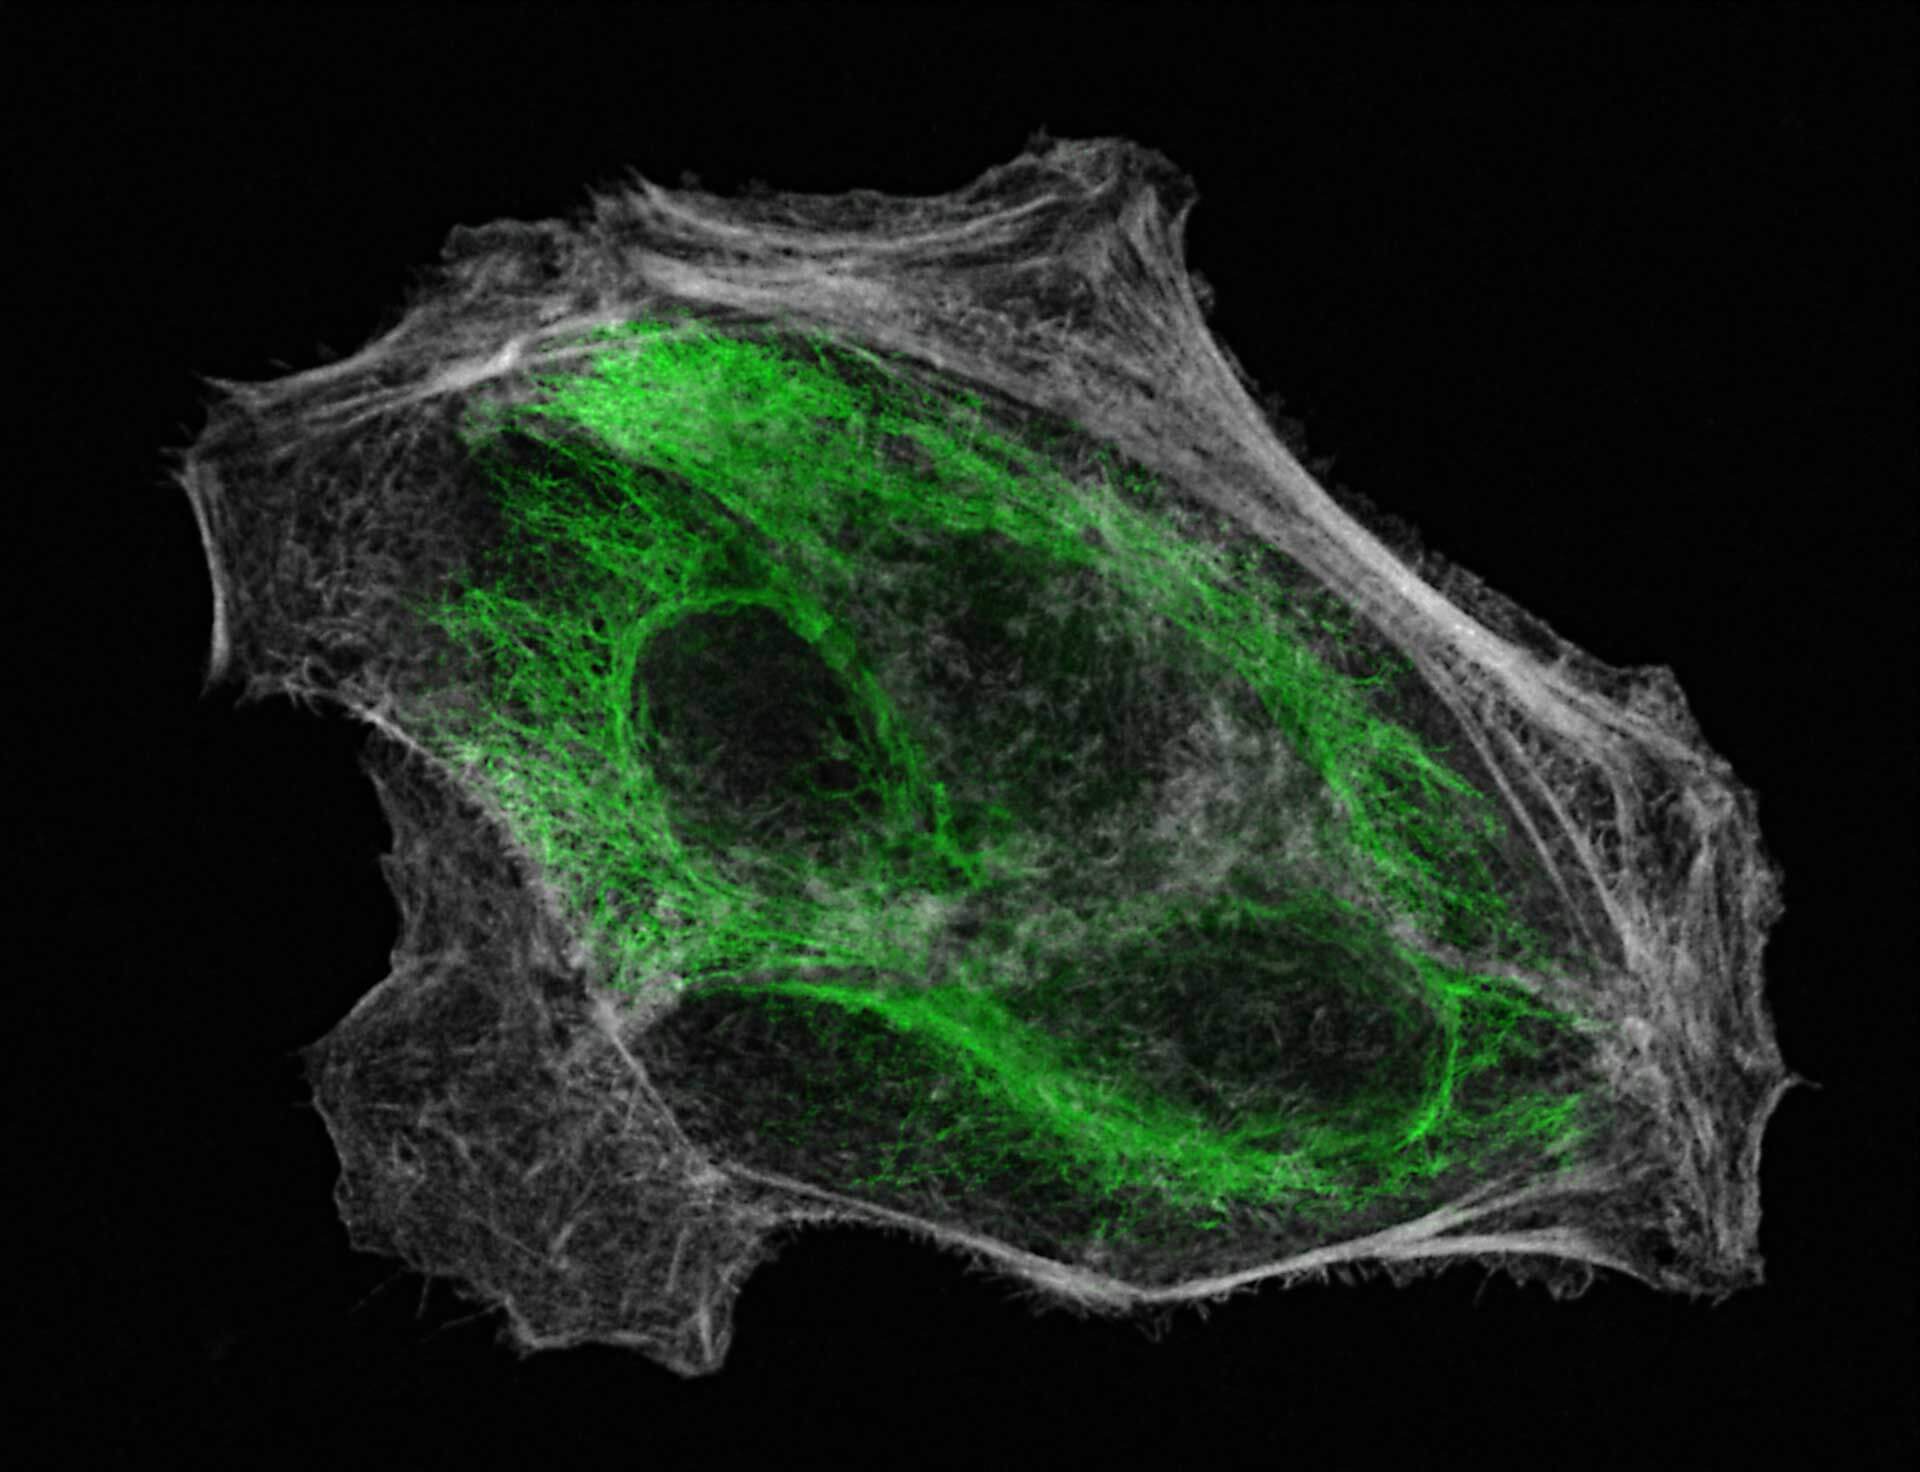
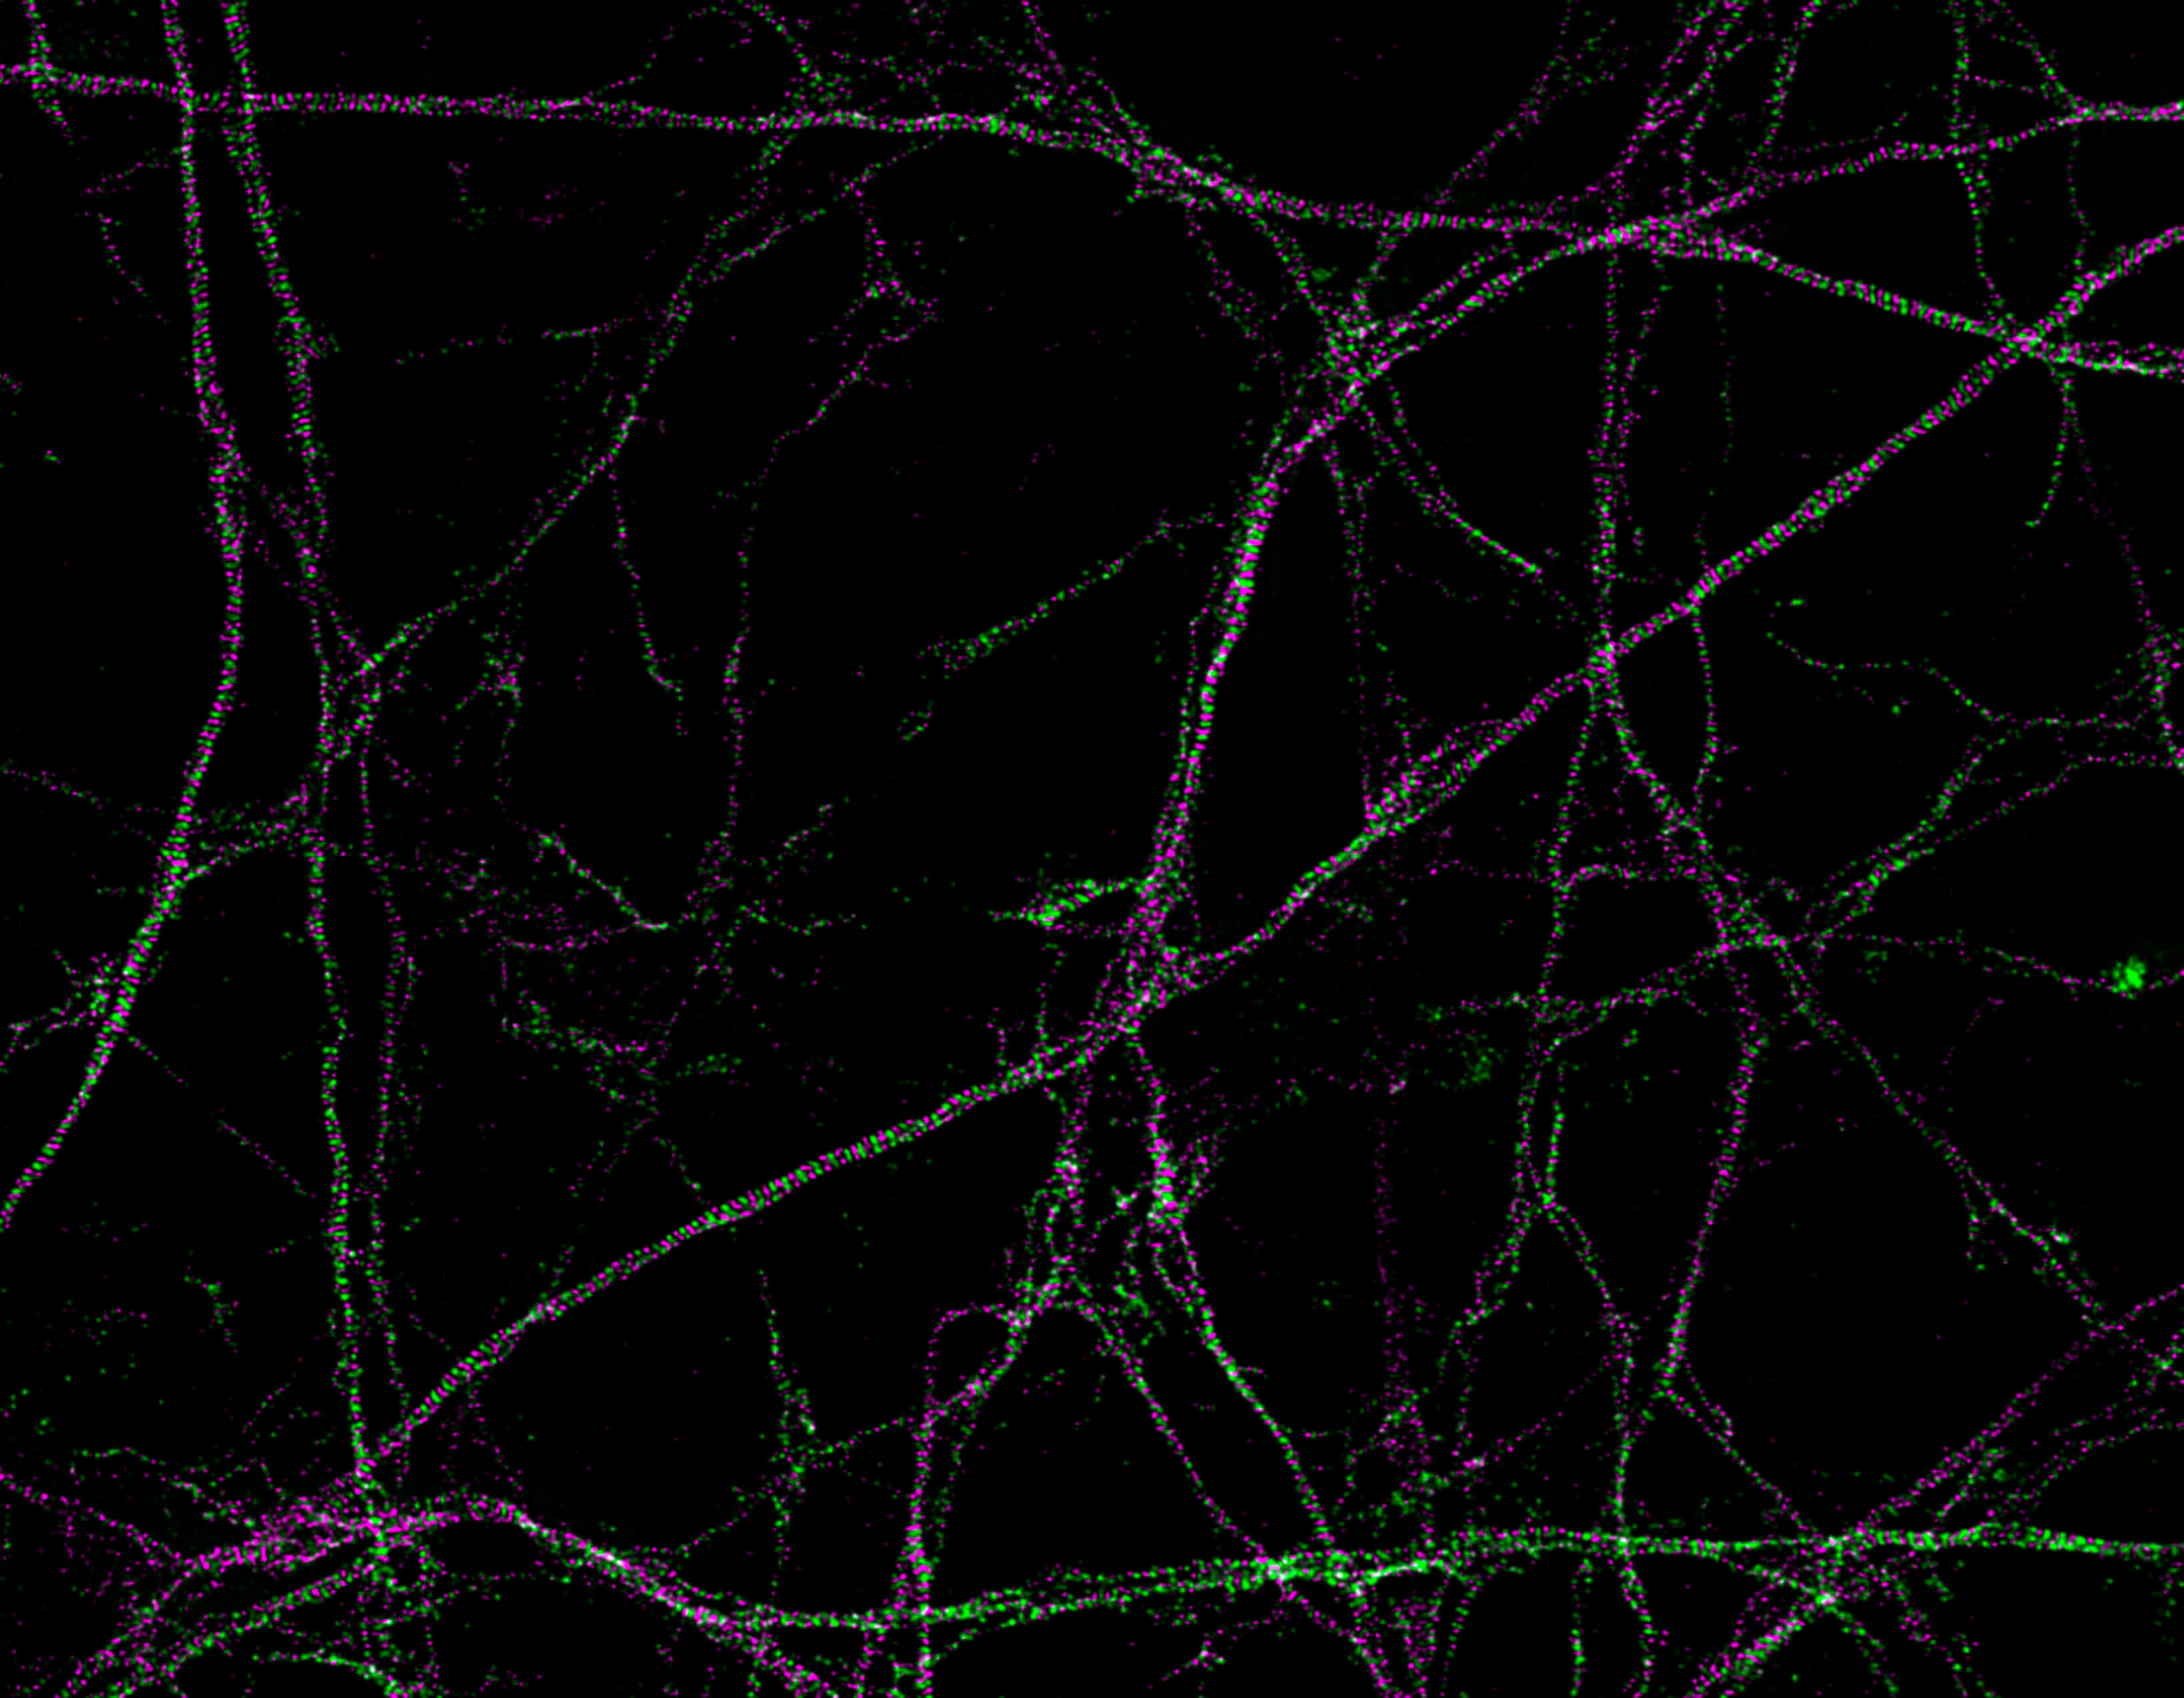
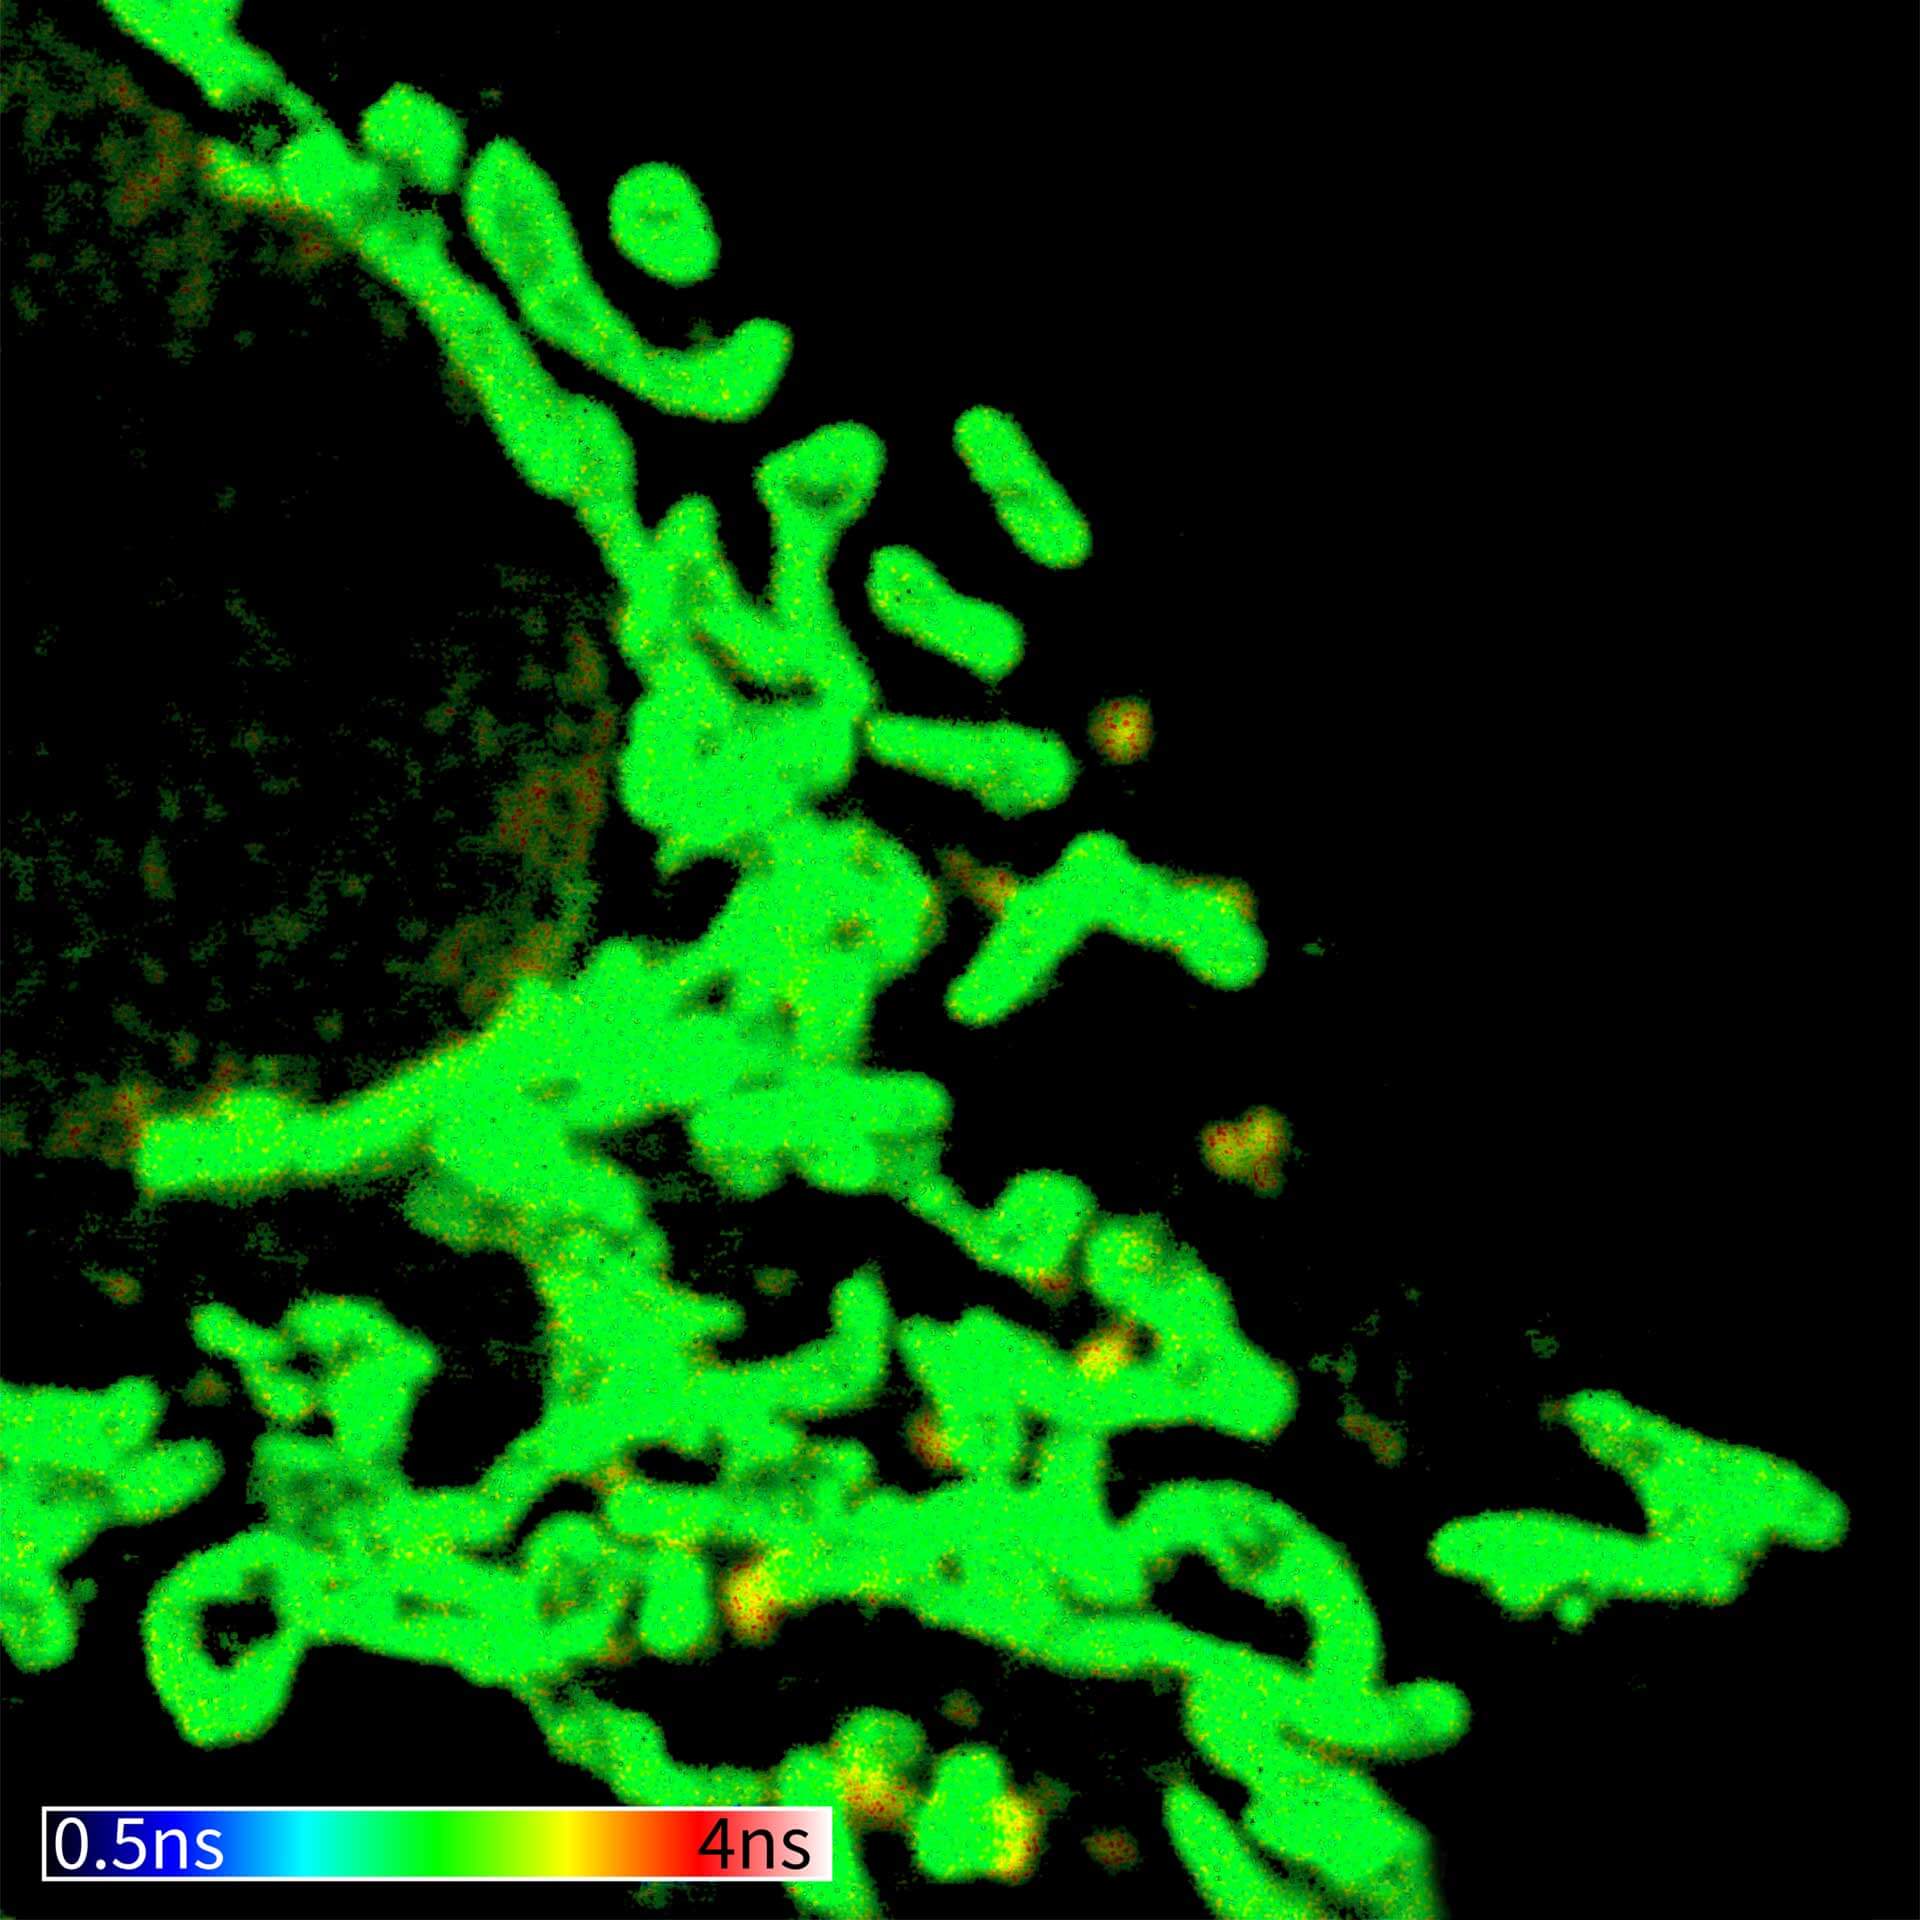
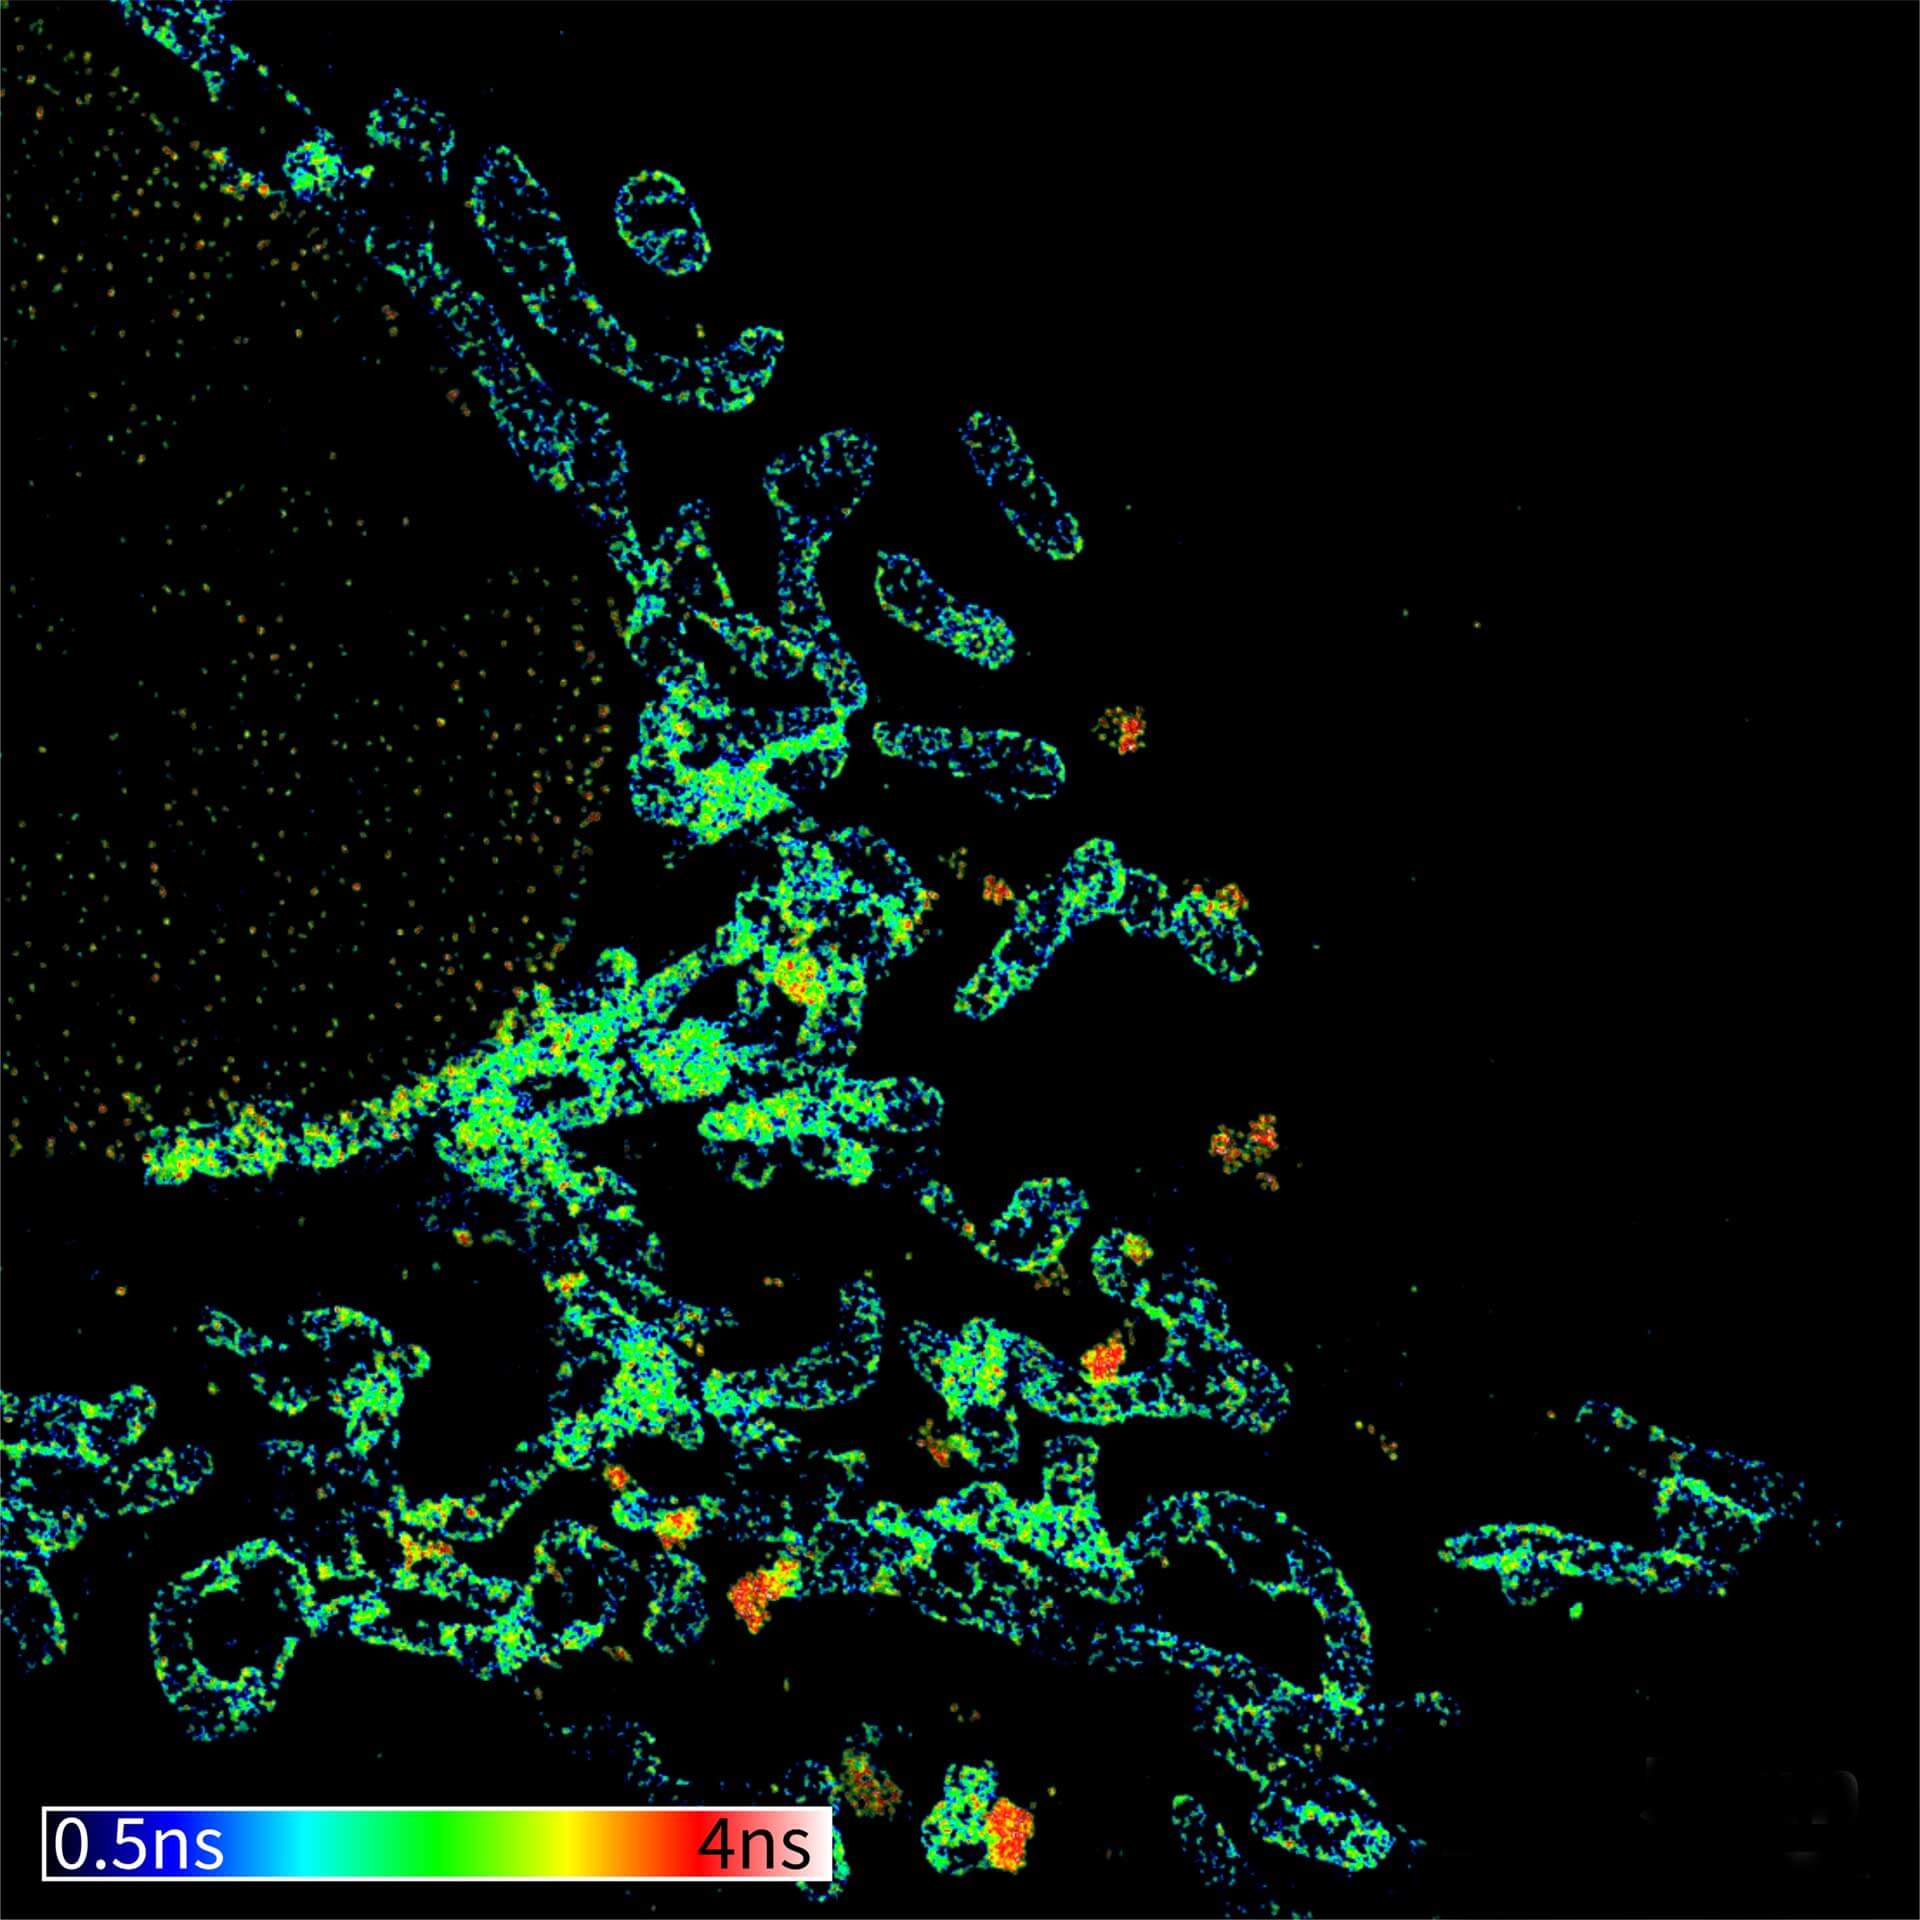
TIMEBOW image of tubulin labeled with Atto647N and vimentin labeled with abberior STAR 635P. The two labels (Atto647N and abberior STAR 635P) have the same excitation spectra, but different lifetimes. Tubulin (red, short lifetime) and vimentin (green, long lifetime) can successfully be separated in the TIMEBOW STED recording via their lifetimes.
Modules:
Description
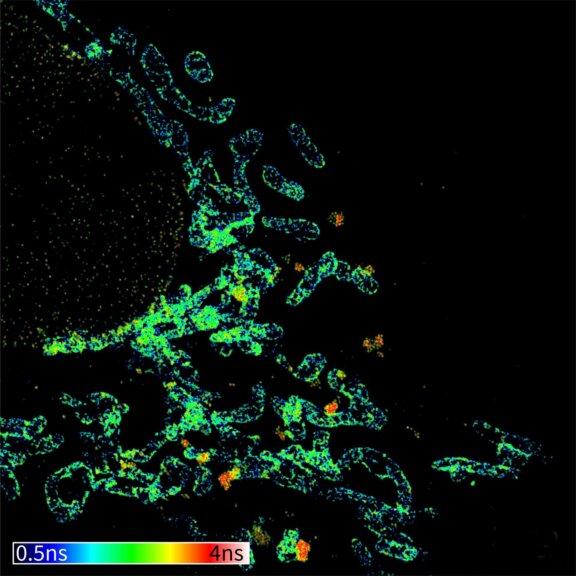
TIMEBOW image of mammalian cells labeled with antibodies against Tom20, ATTO 647N and NUP153, abberior STAR 635P. Note that nuclear pore (NUP) complex subunits appear to be localized in the cytoplasm, which is due to the NUP import pathway into the nuclear membrane.
Modules:
Description
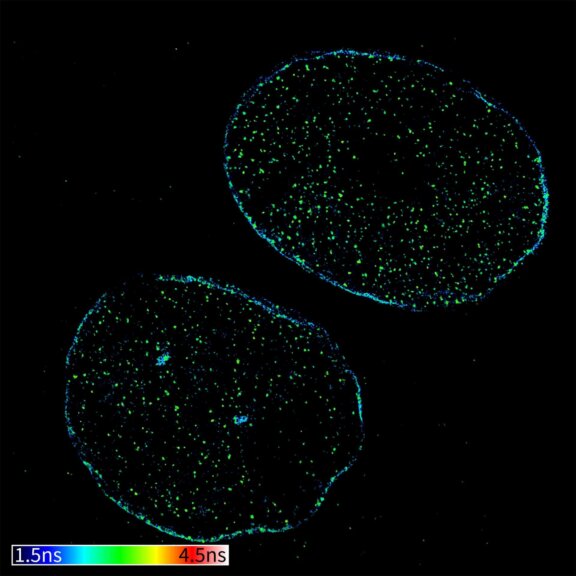
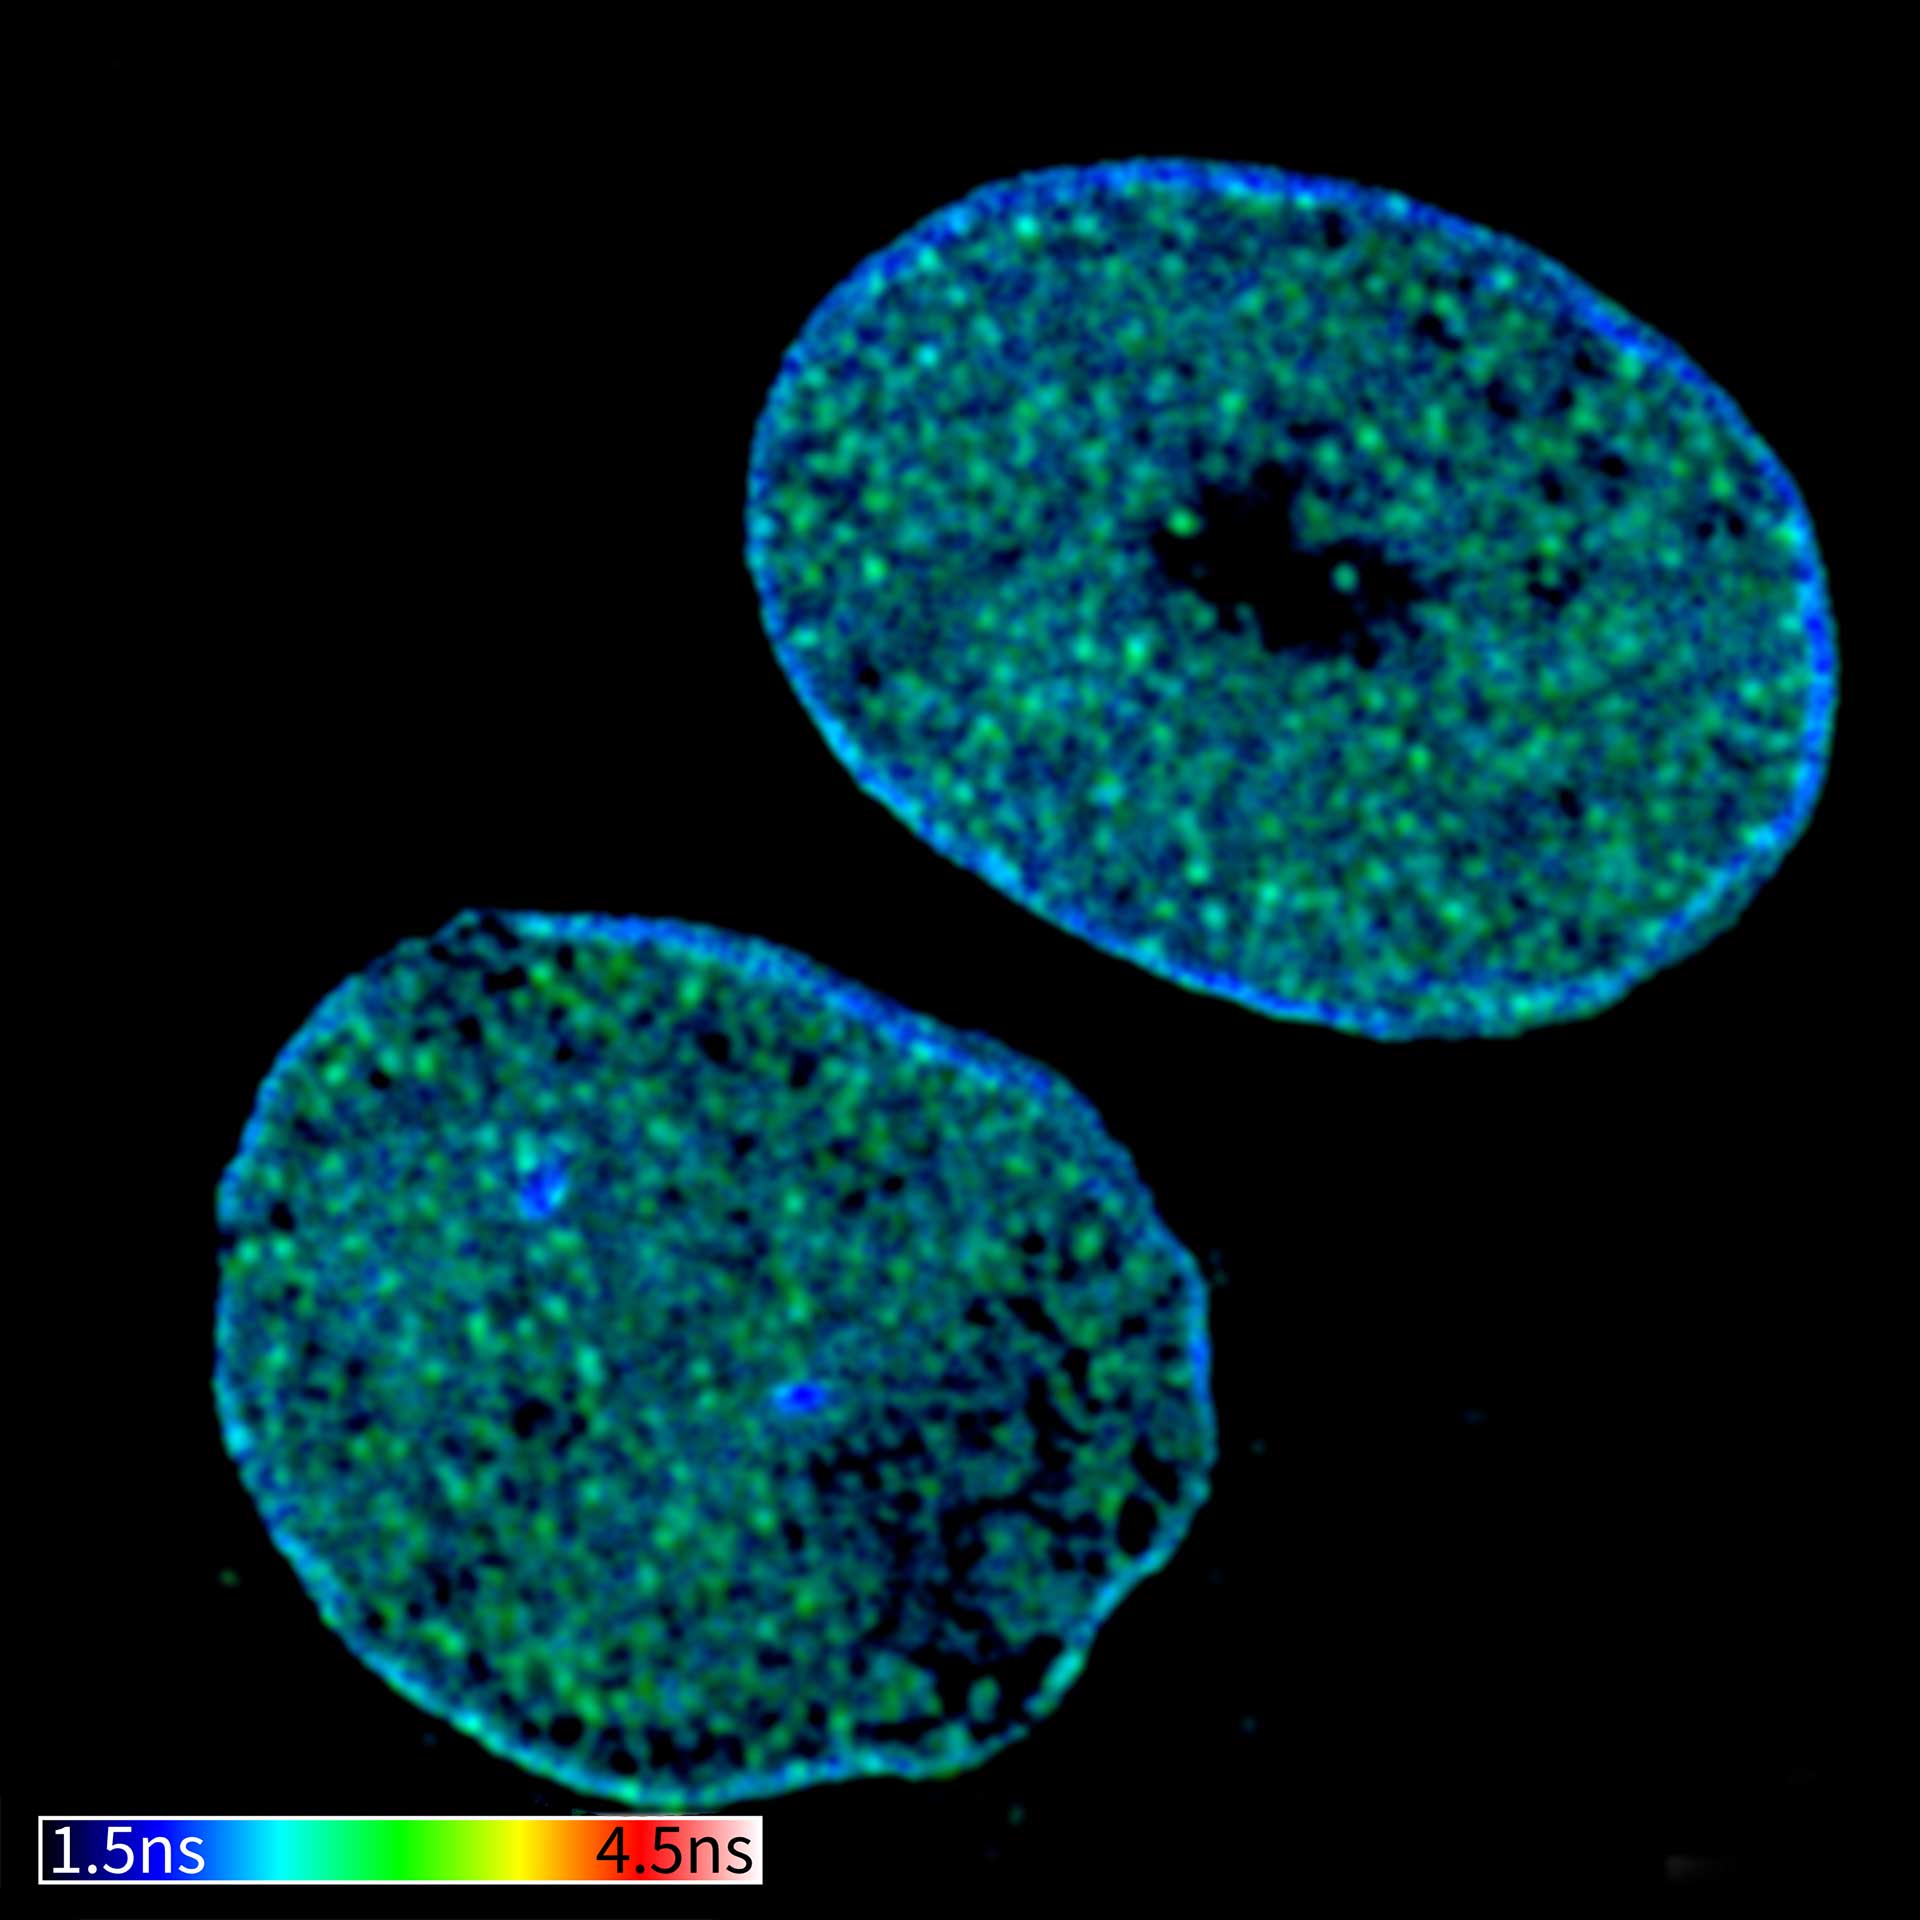
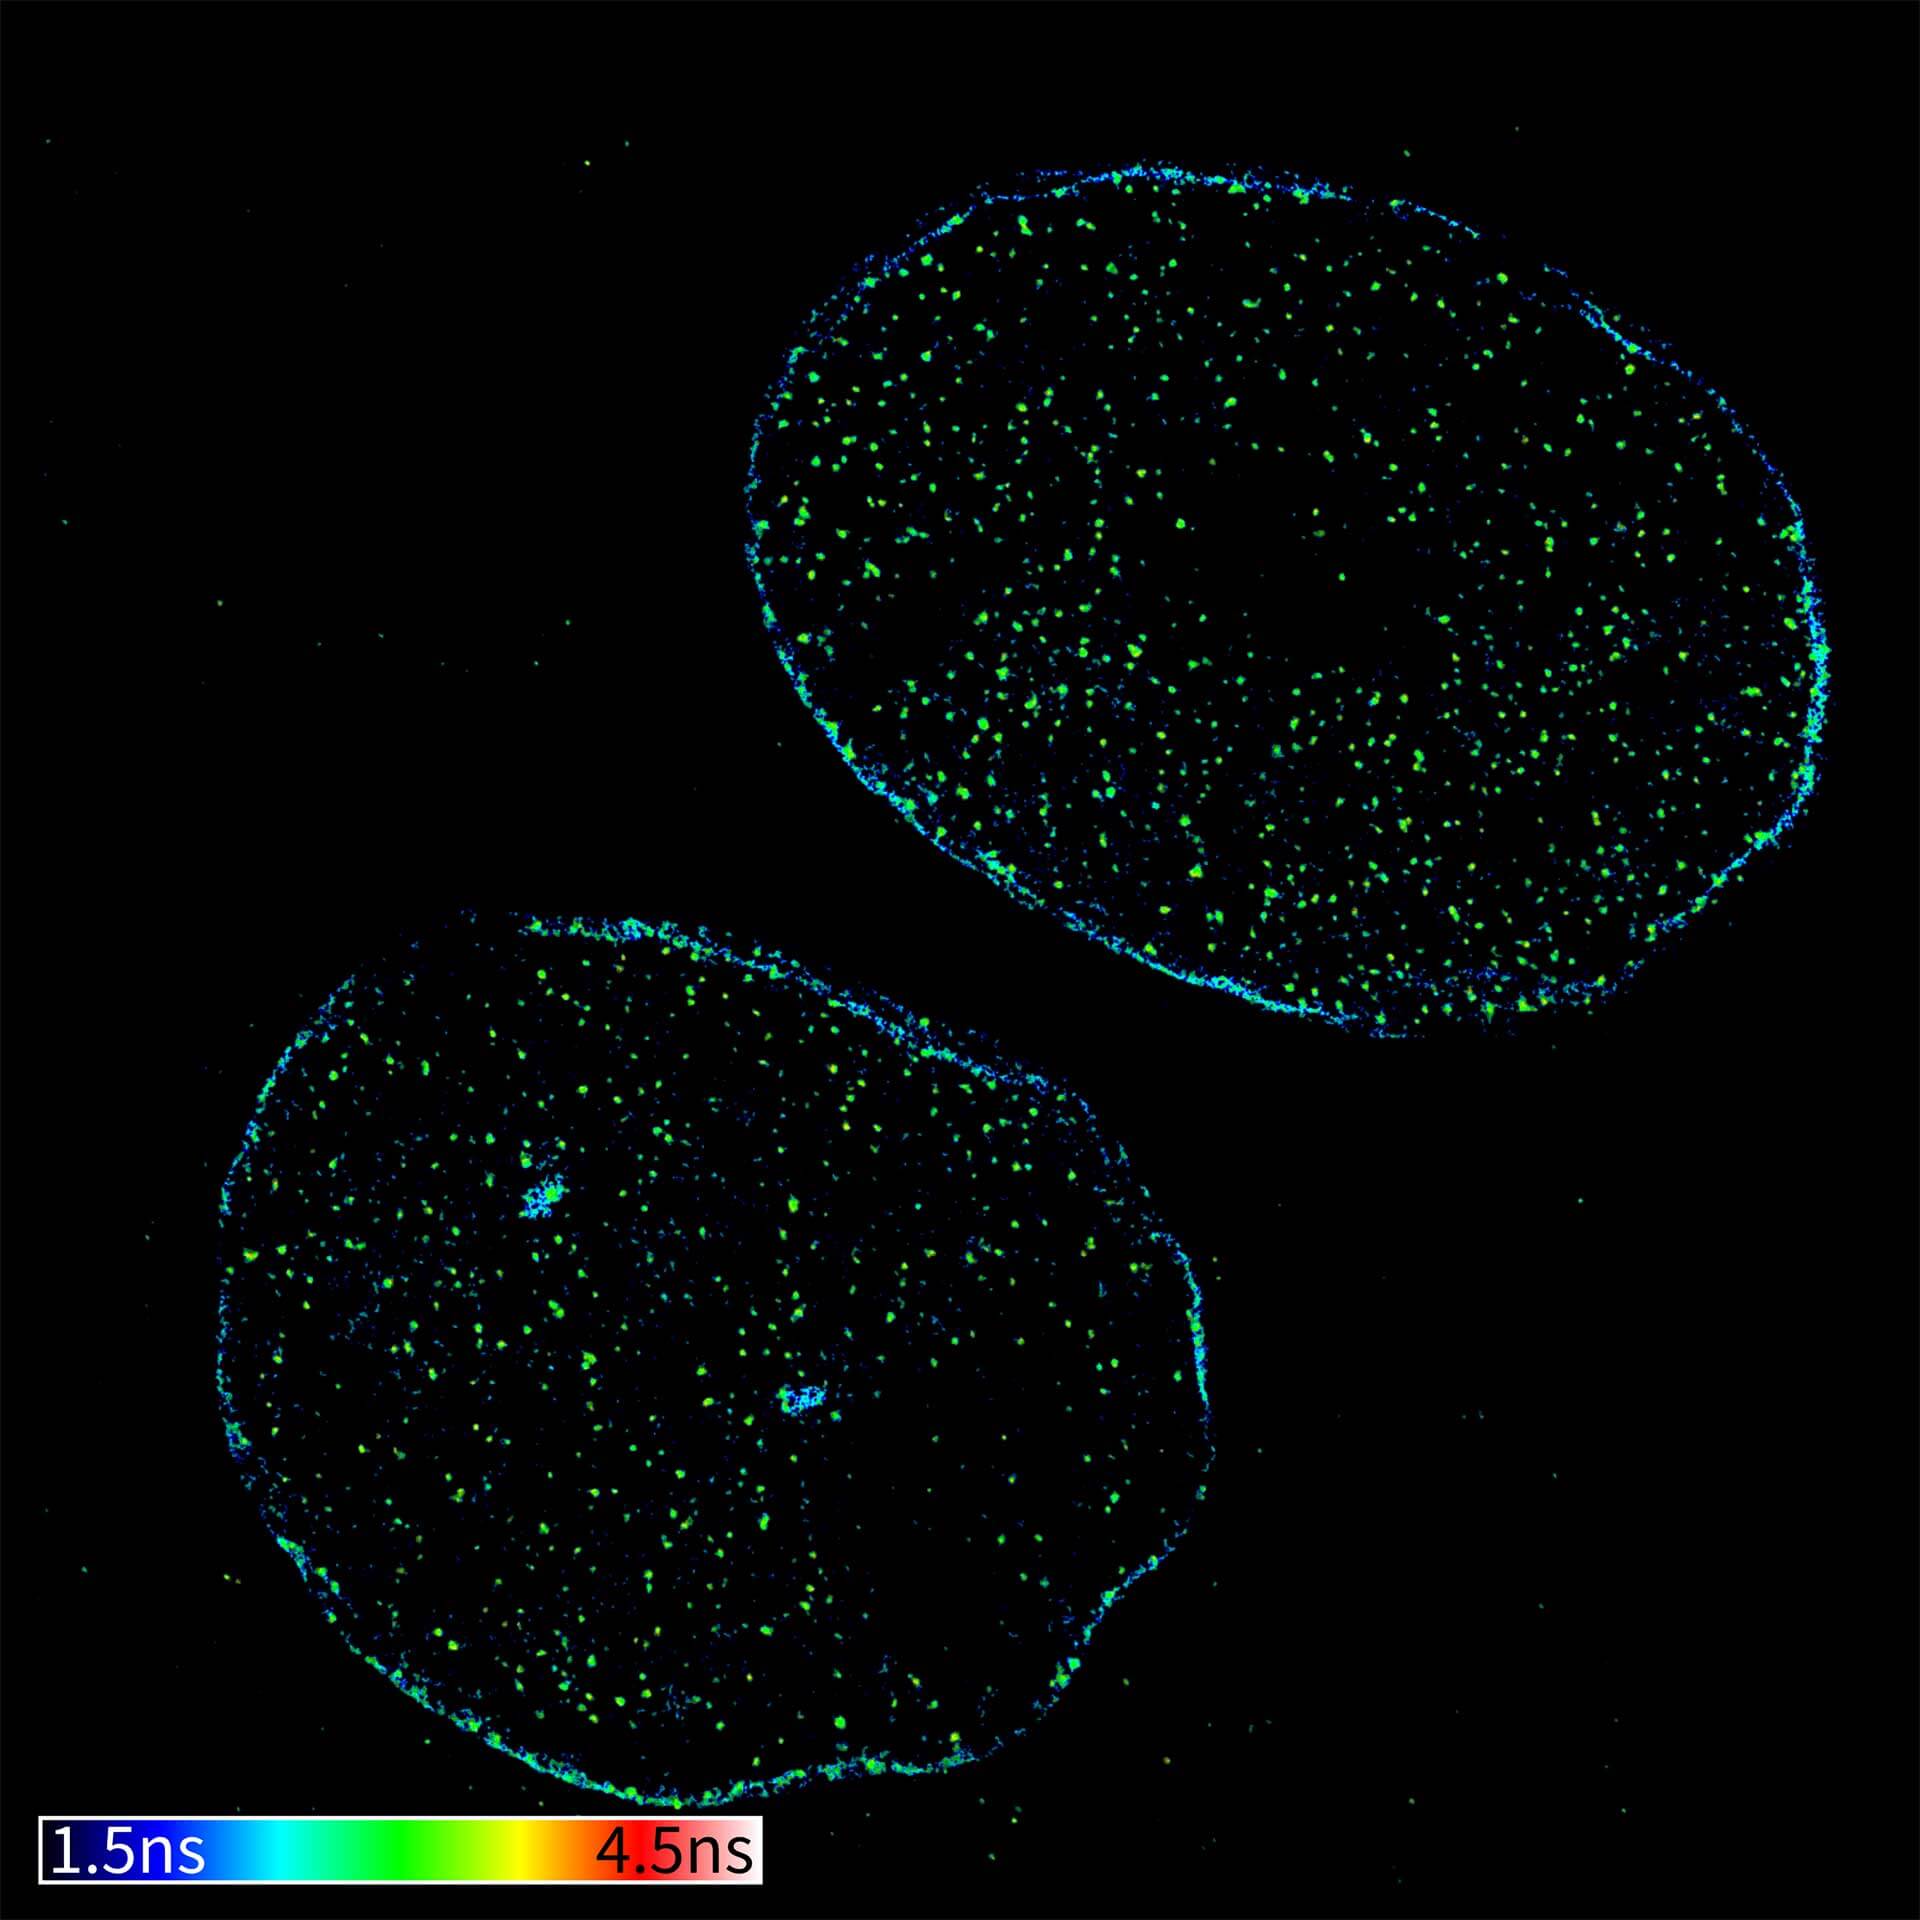
TIMEBOW confocal and TIMEBOW STED image of mammalian cells labeled with antibodies against lamin, ATTO 647N and dsDNA, abberior STAR 635P.
Modules:
Description
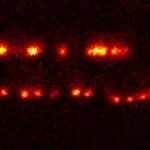
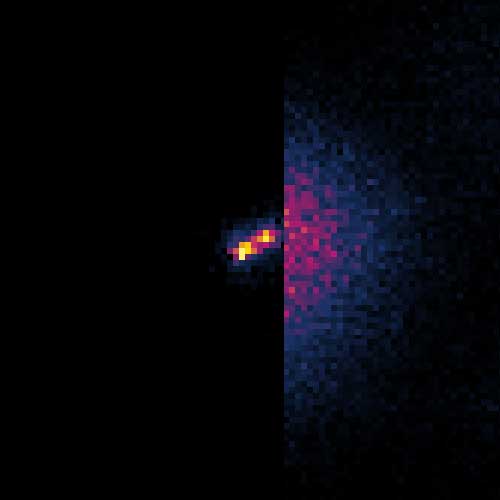
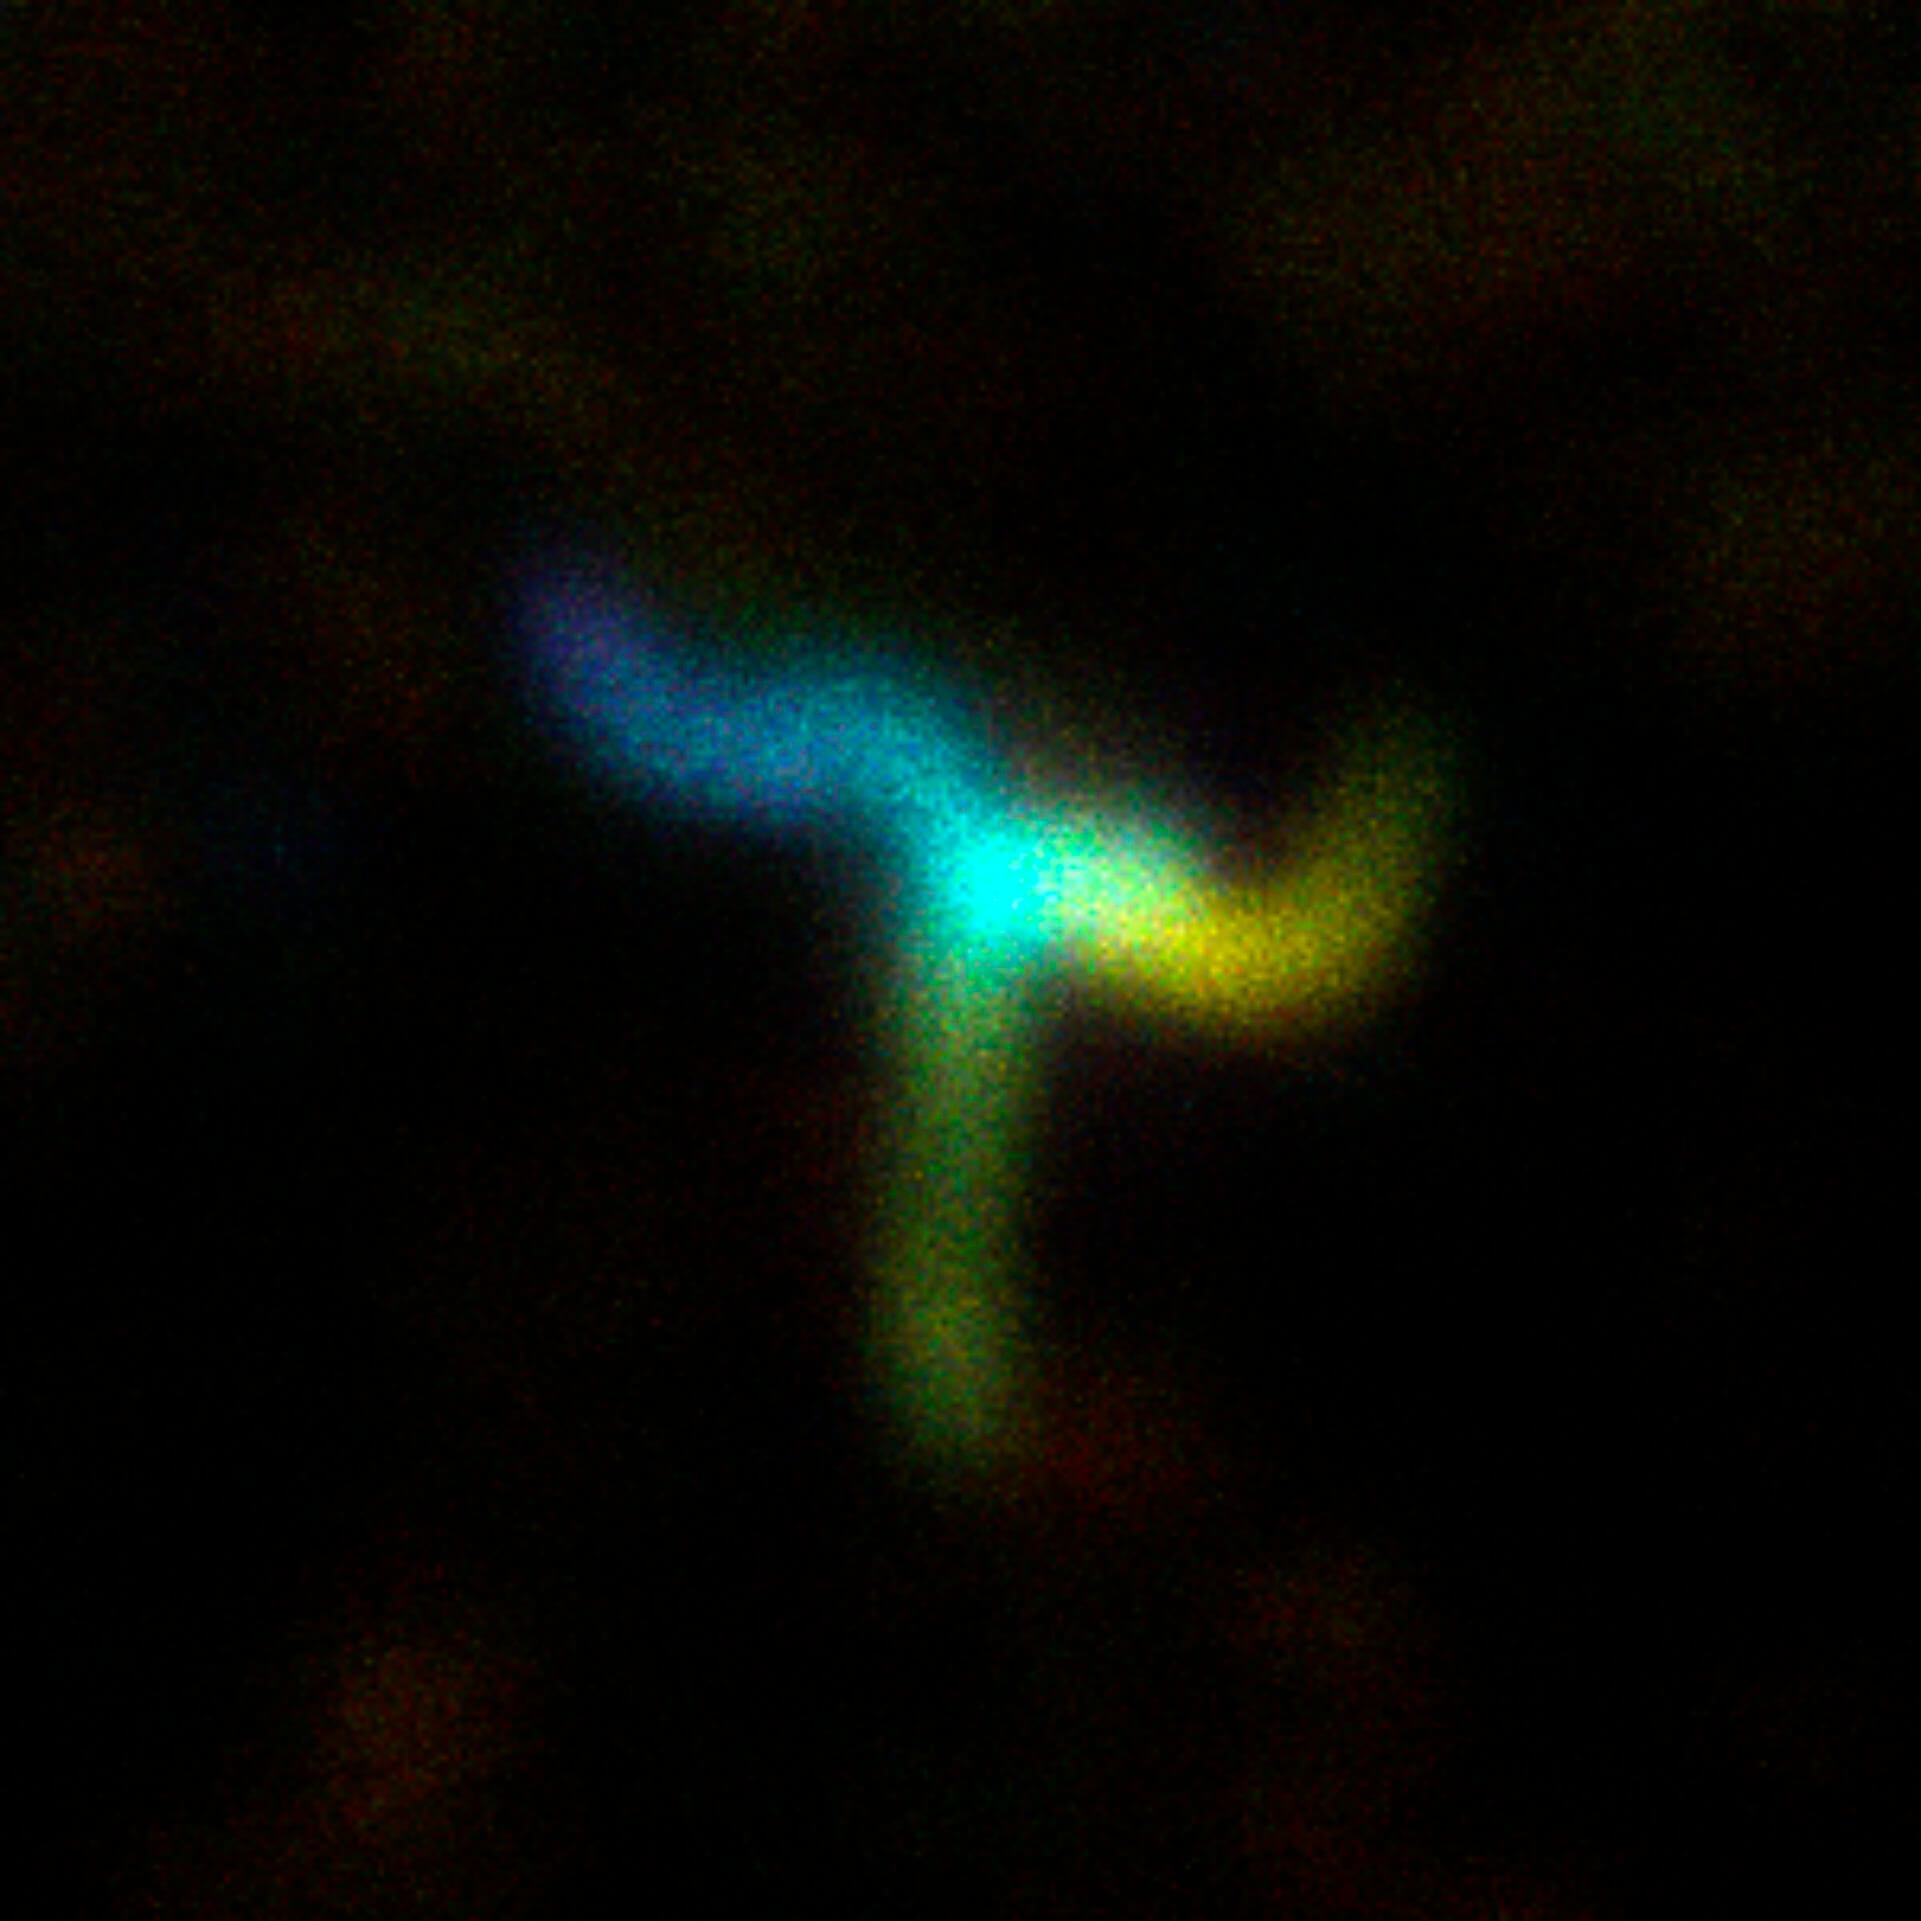
2D tracking of a lipid-coupled Atto 647N molecule embedded in a supported lipid bilayer. The movement of the labeled lipid was tracked with a frequency of up to 10 kHz.

Description
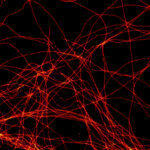
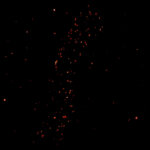
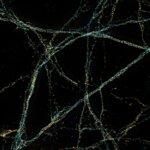
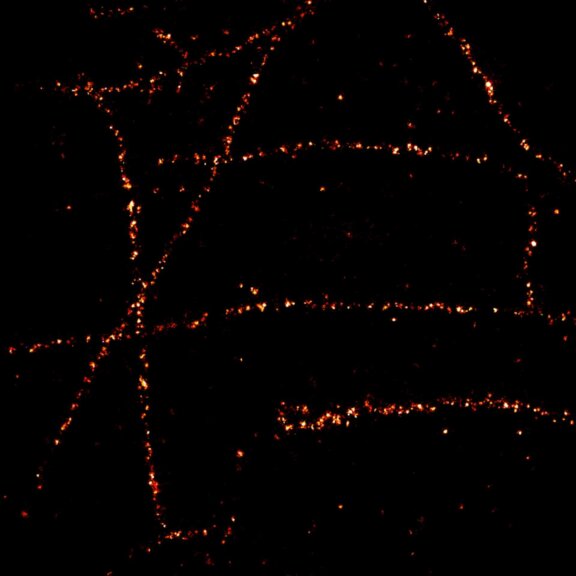
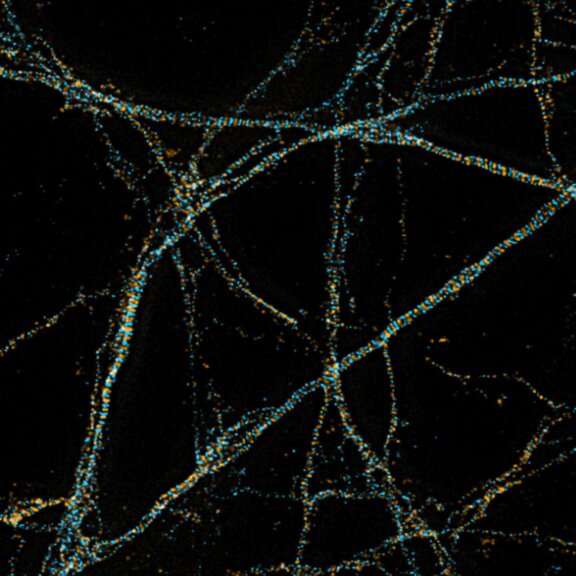
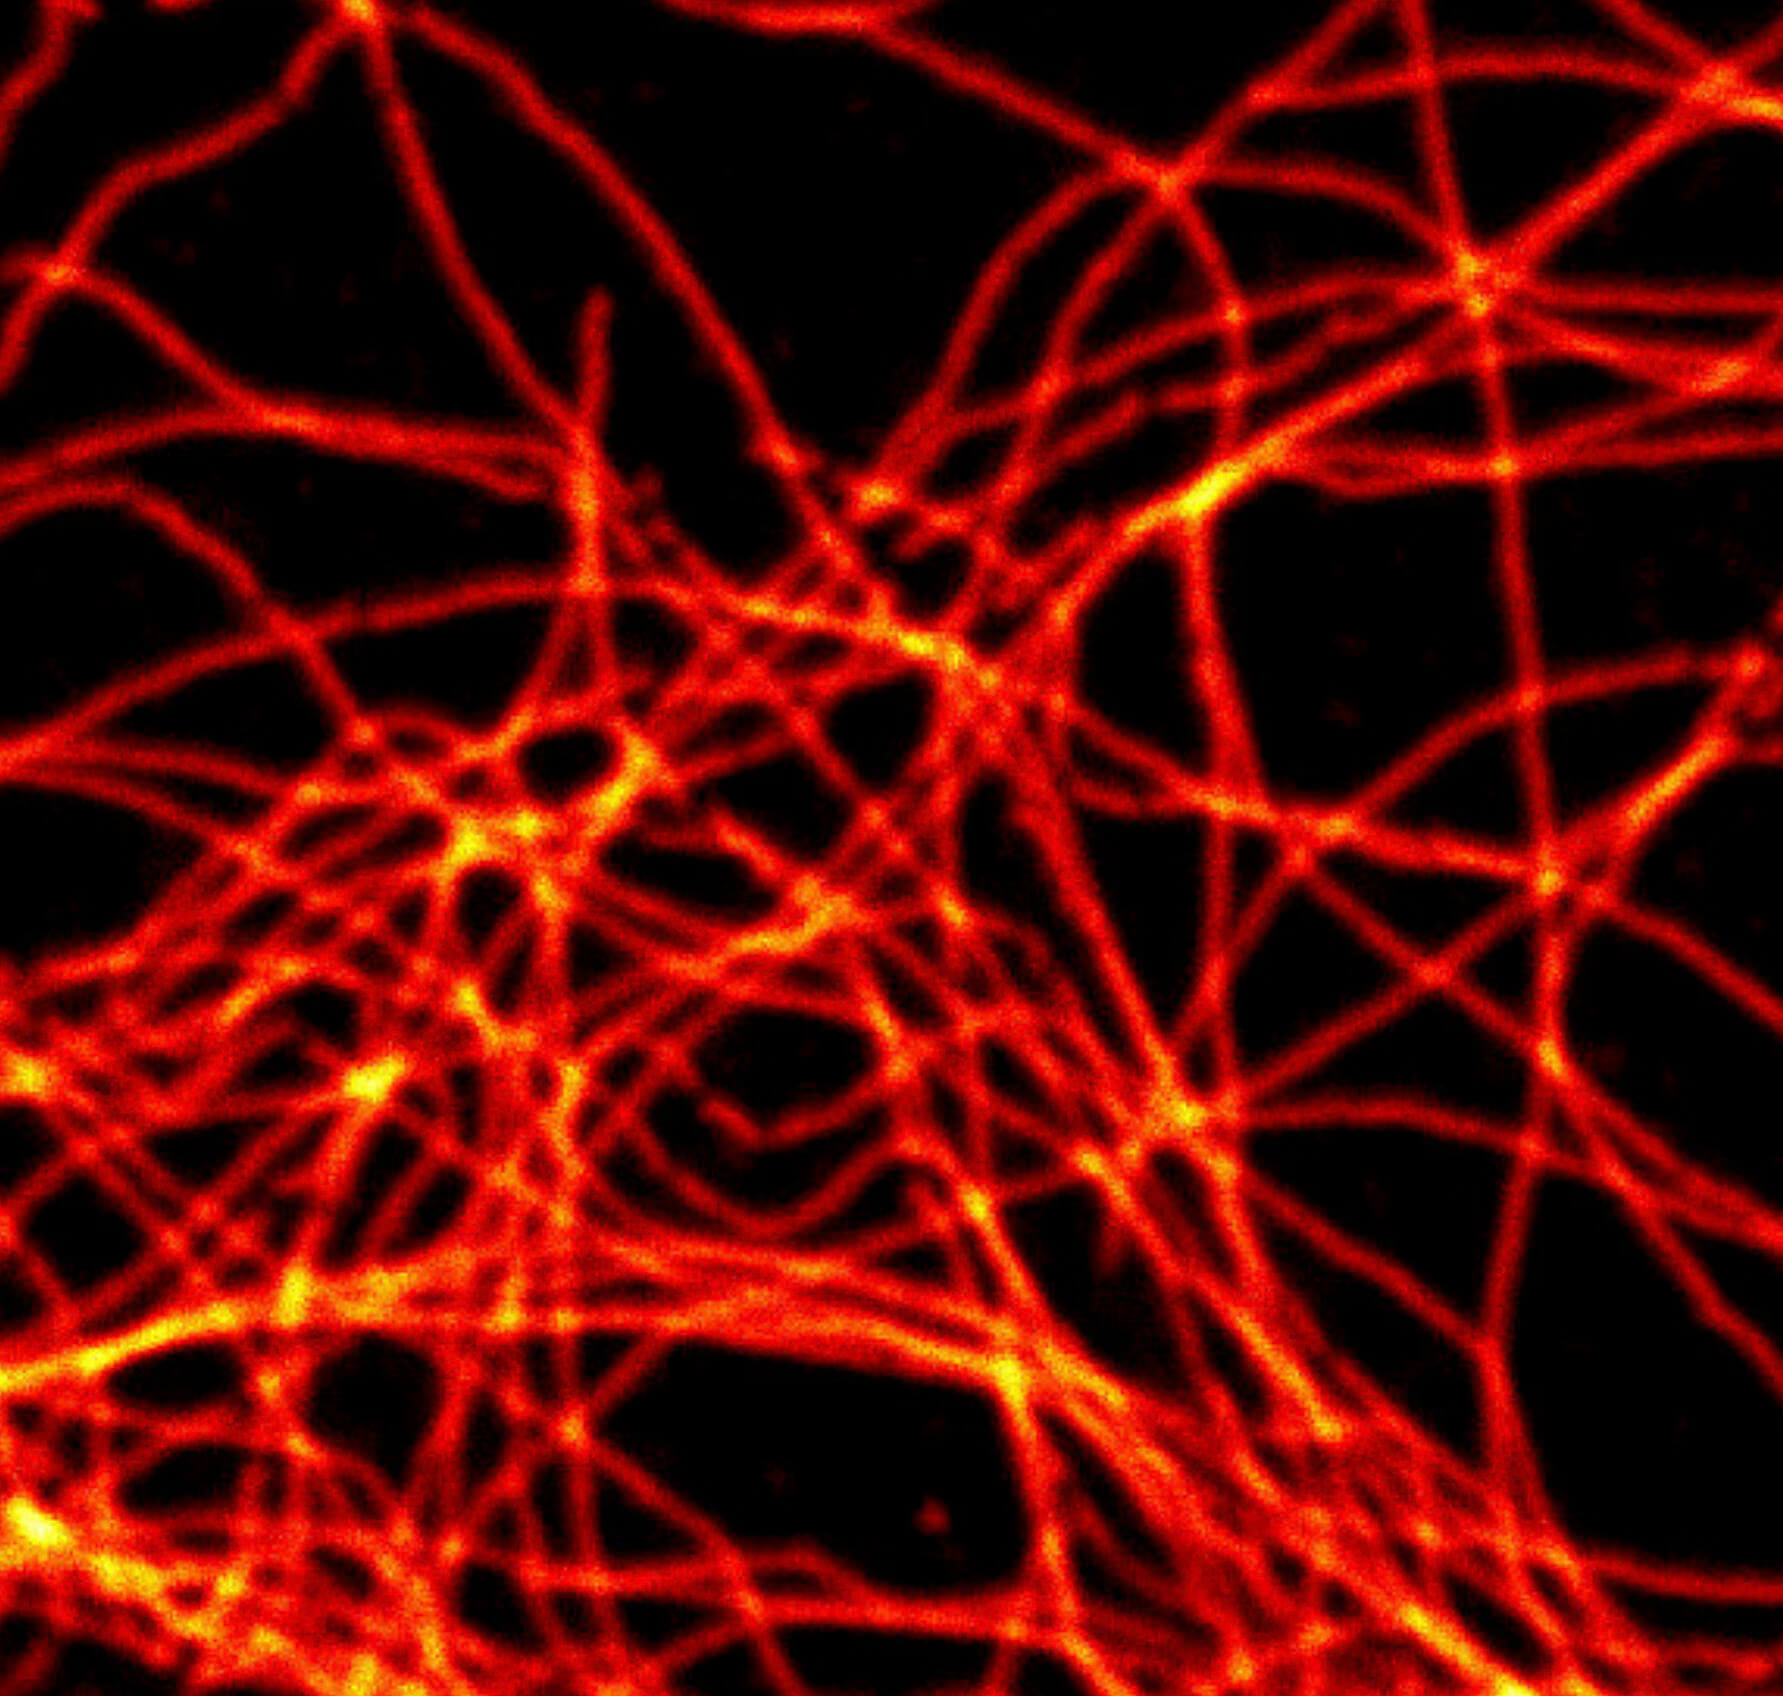
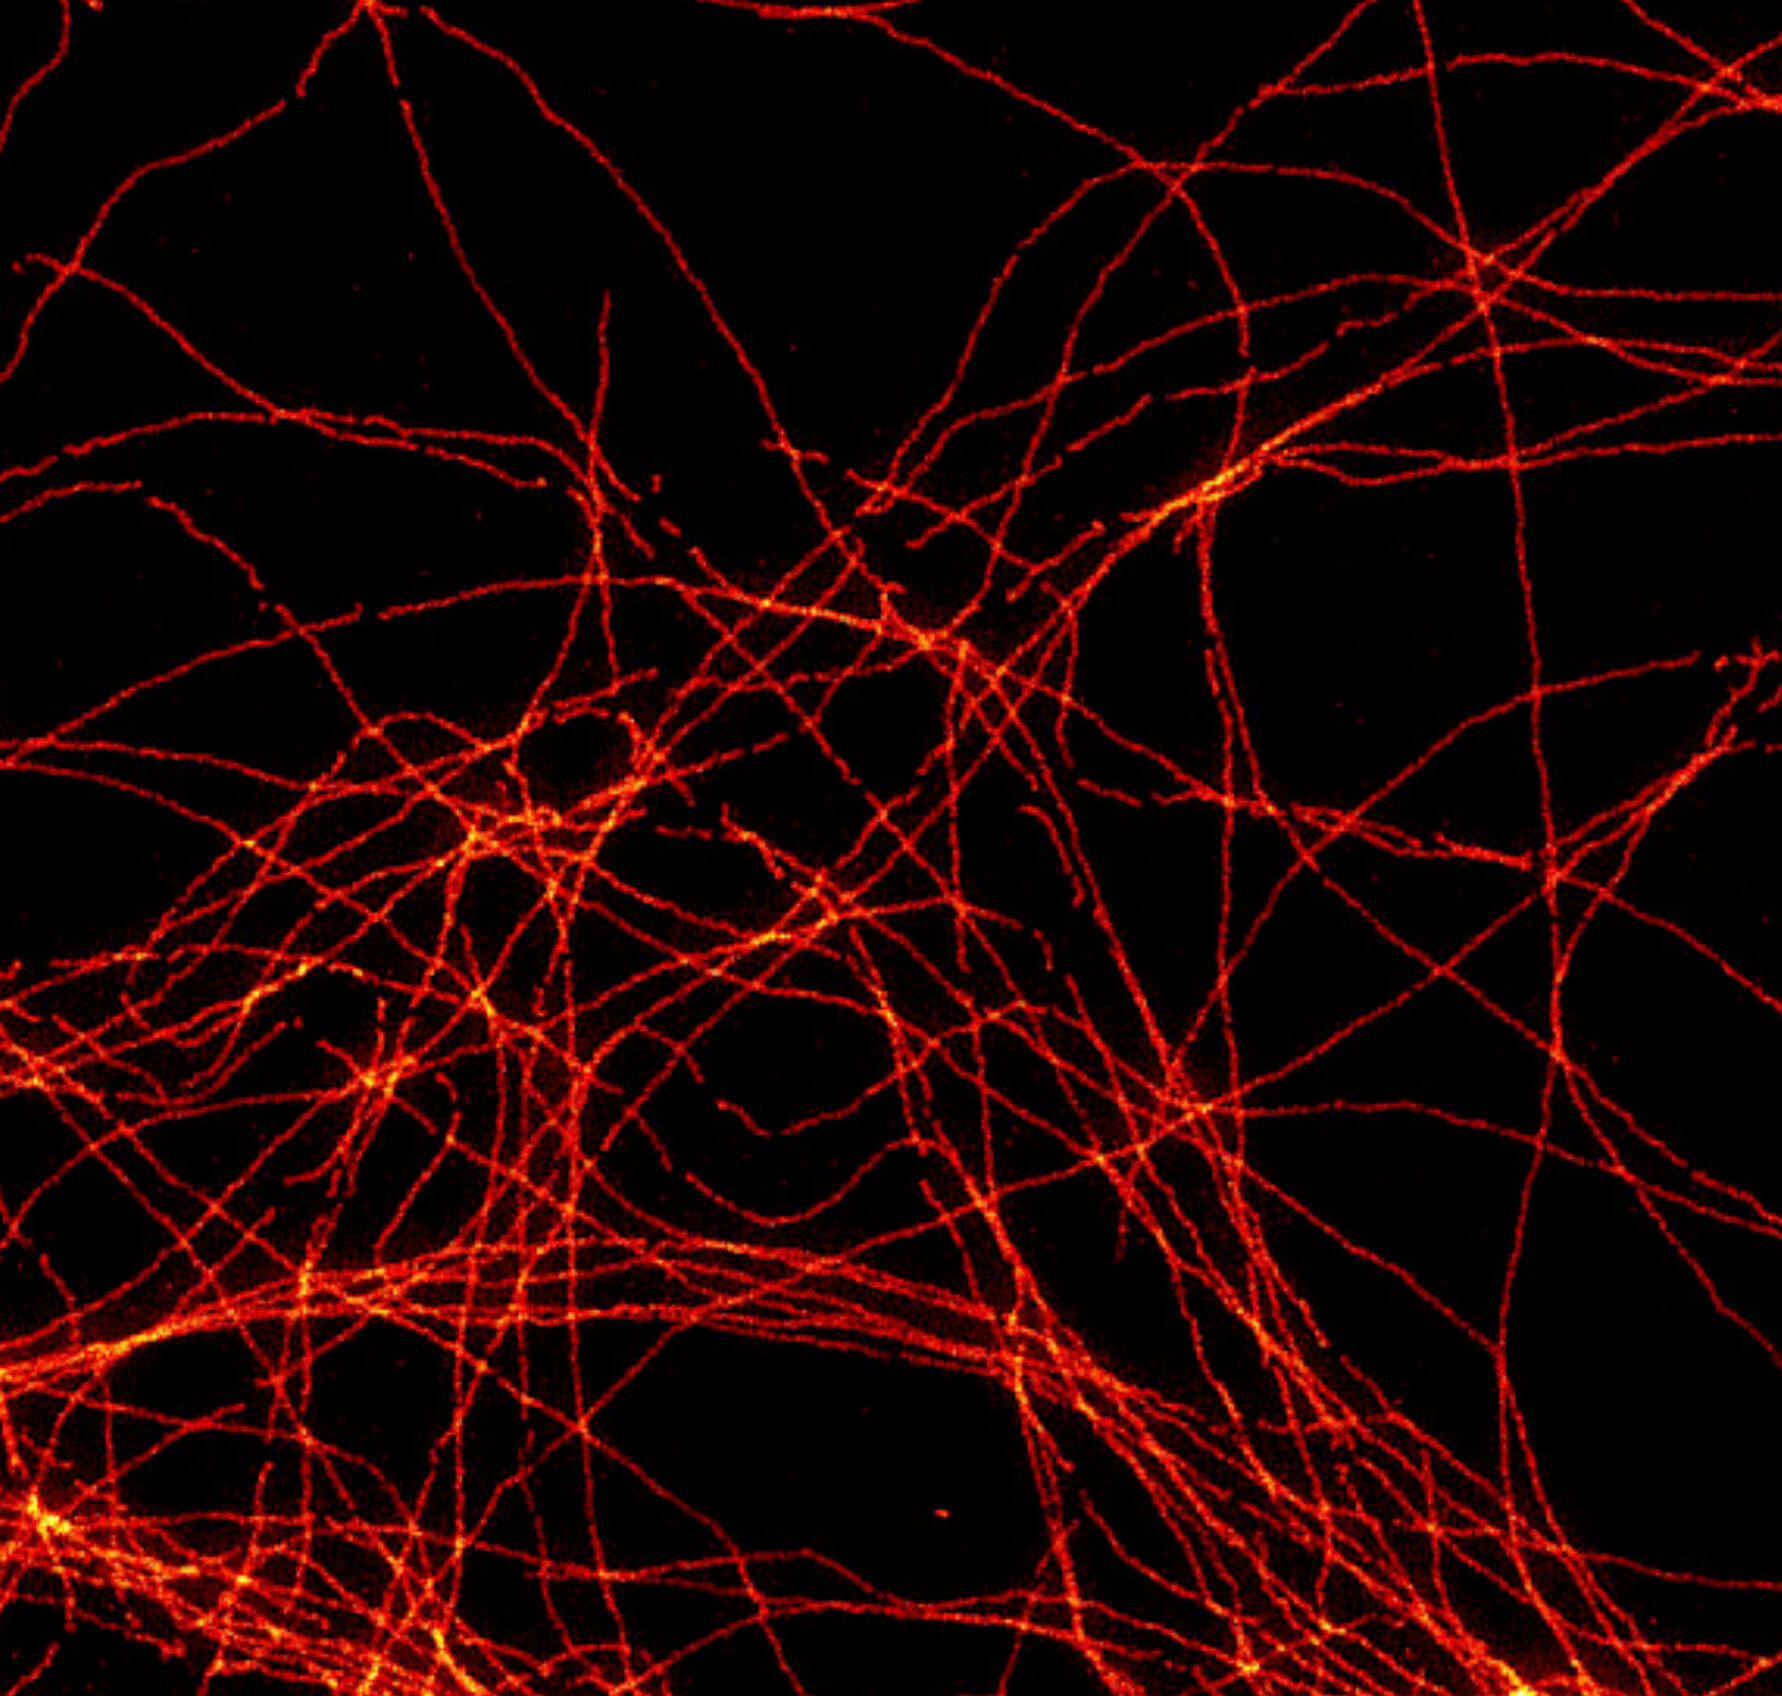
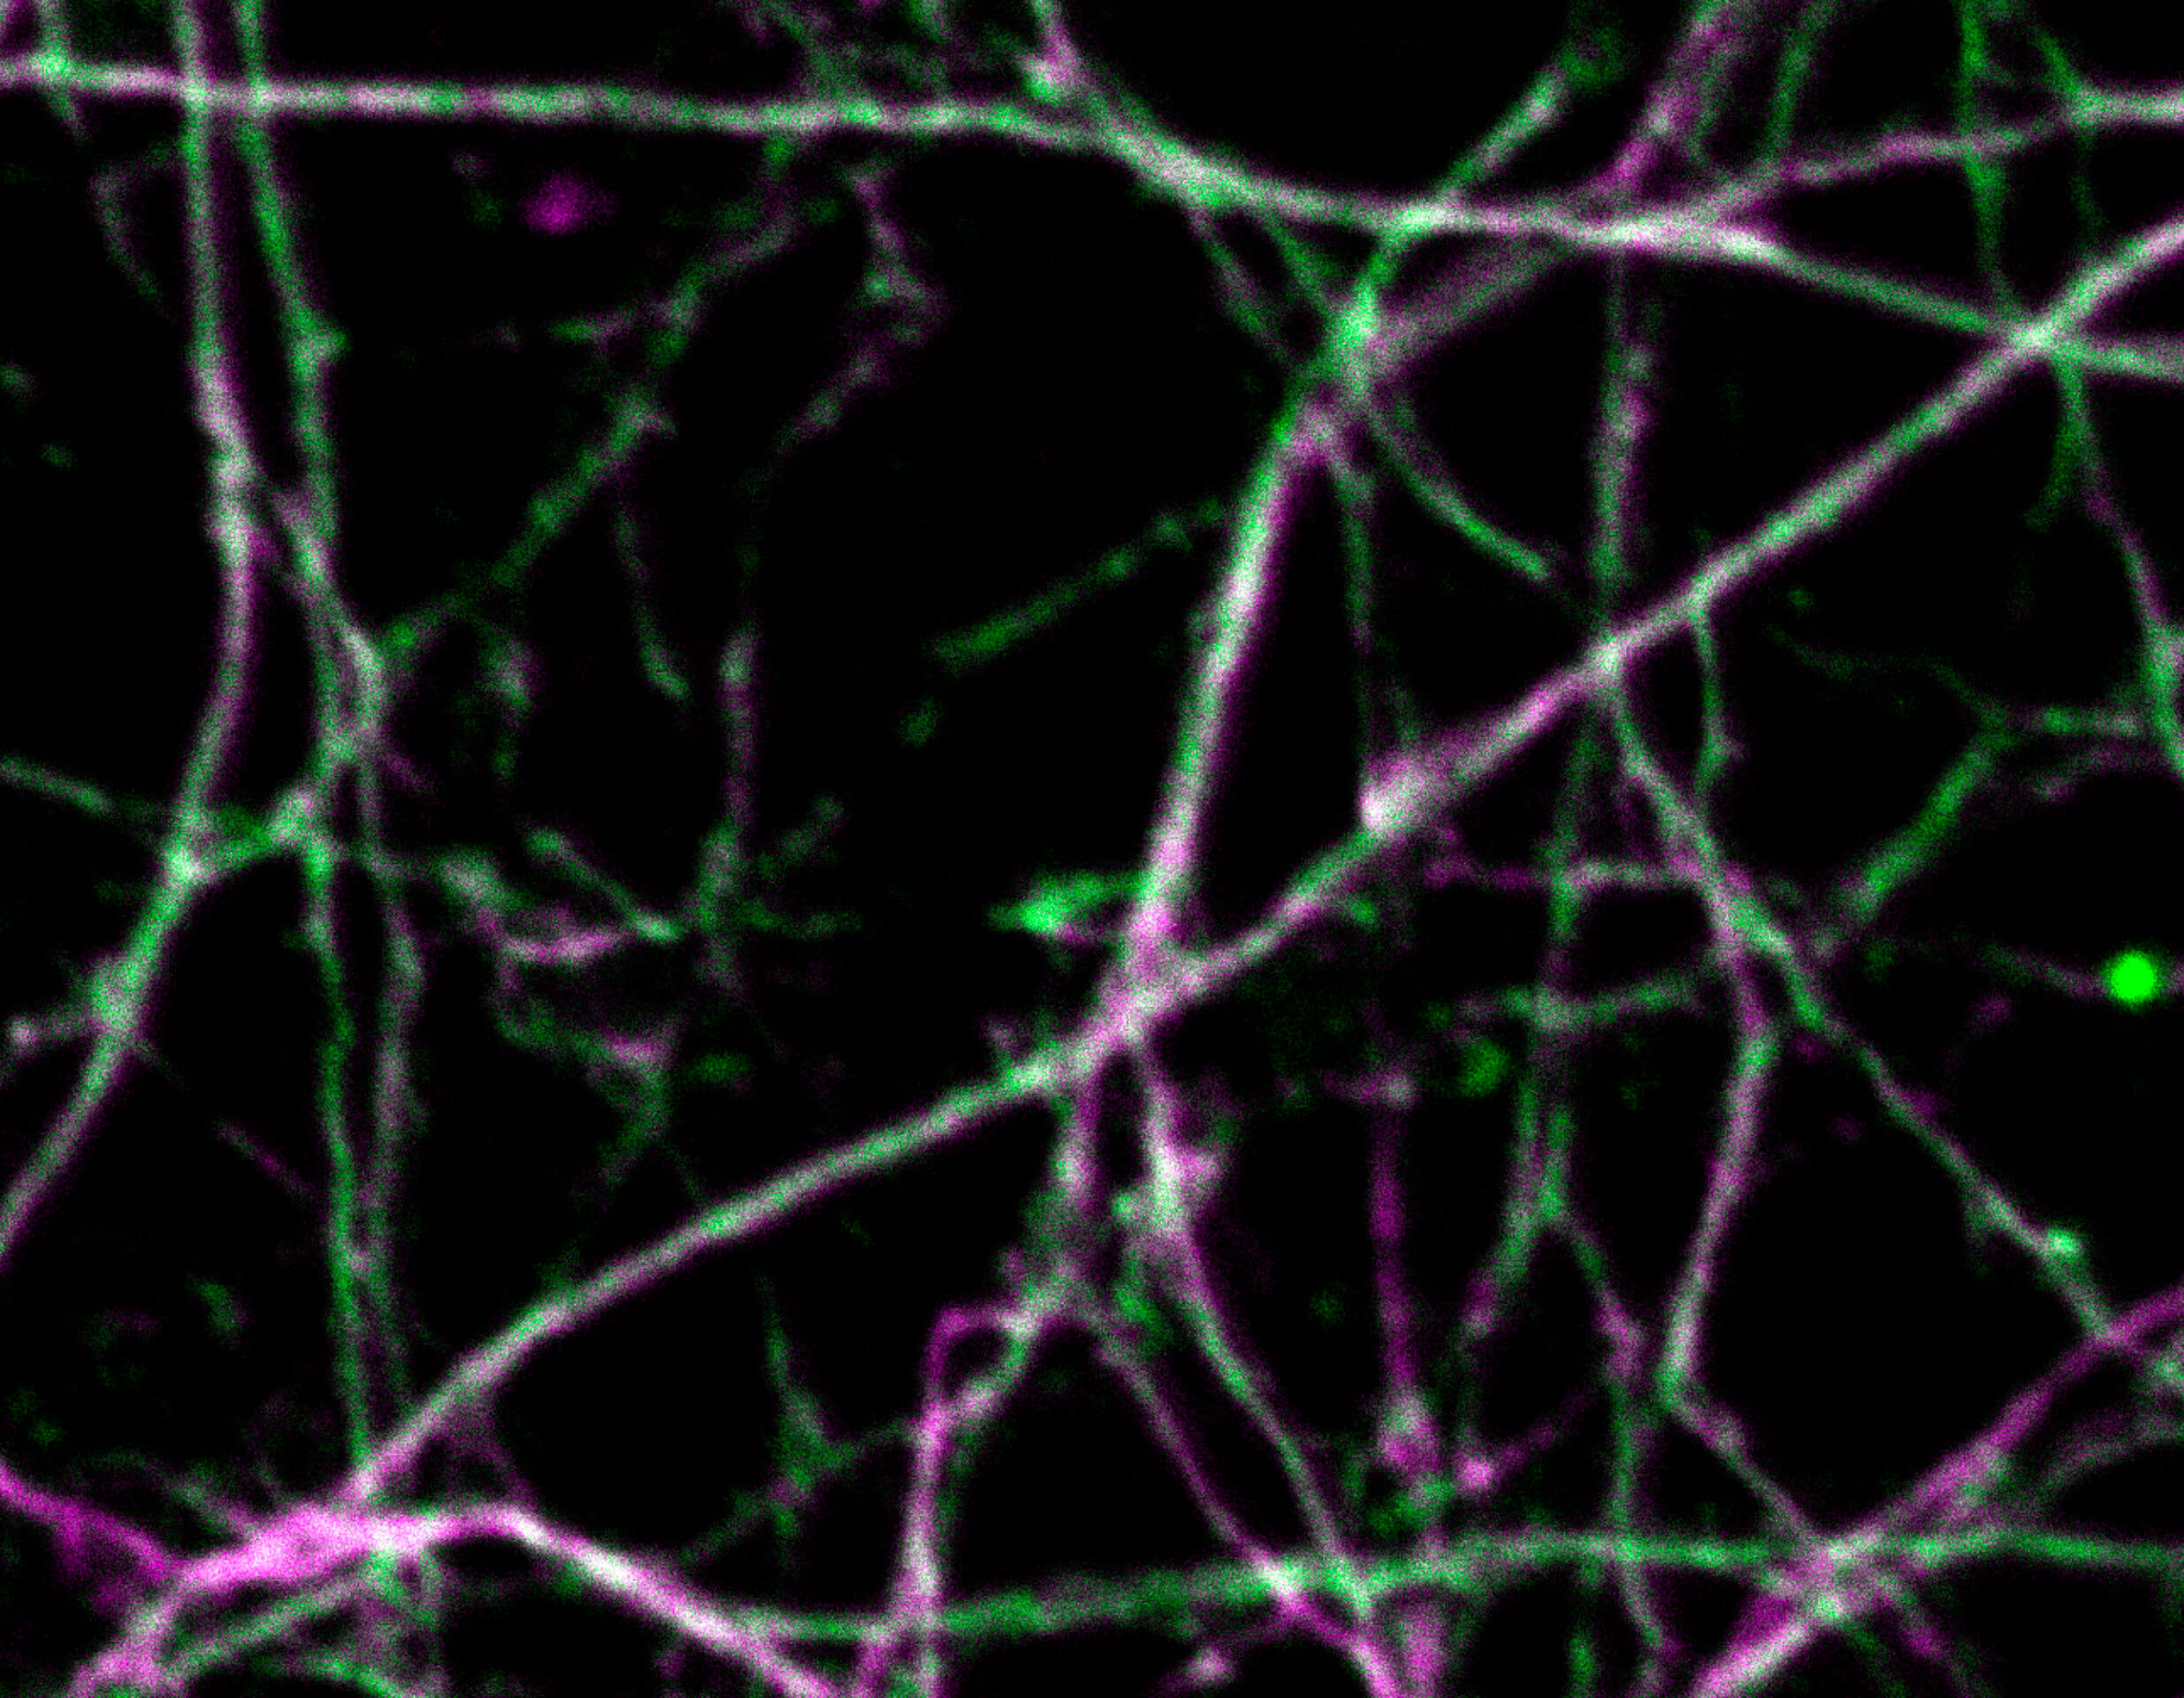
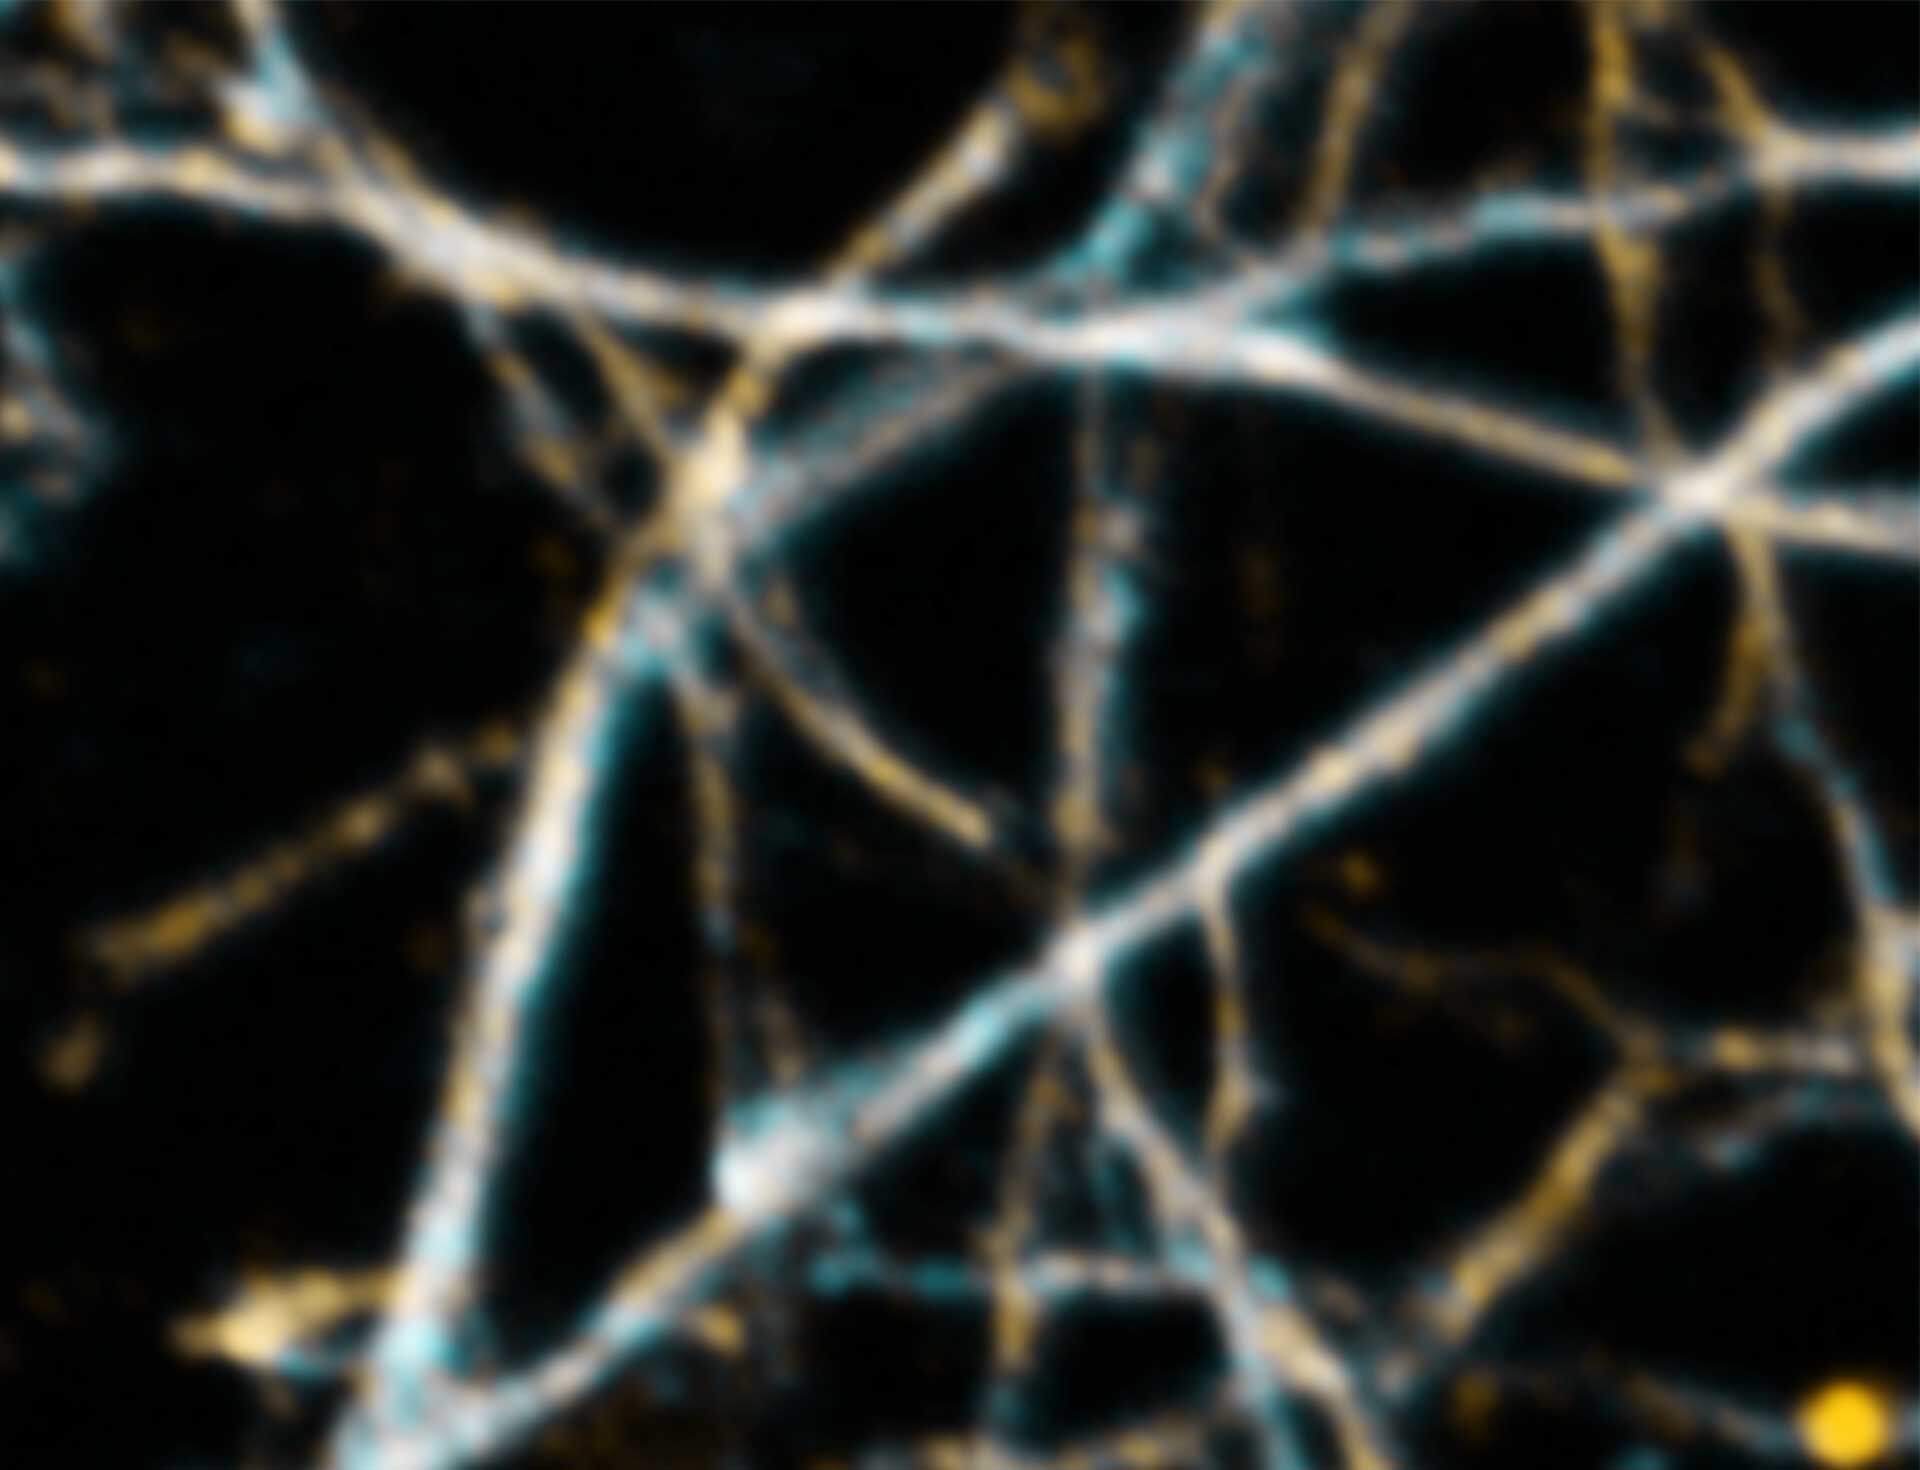
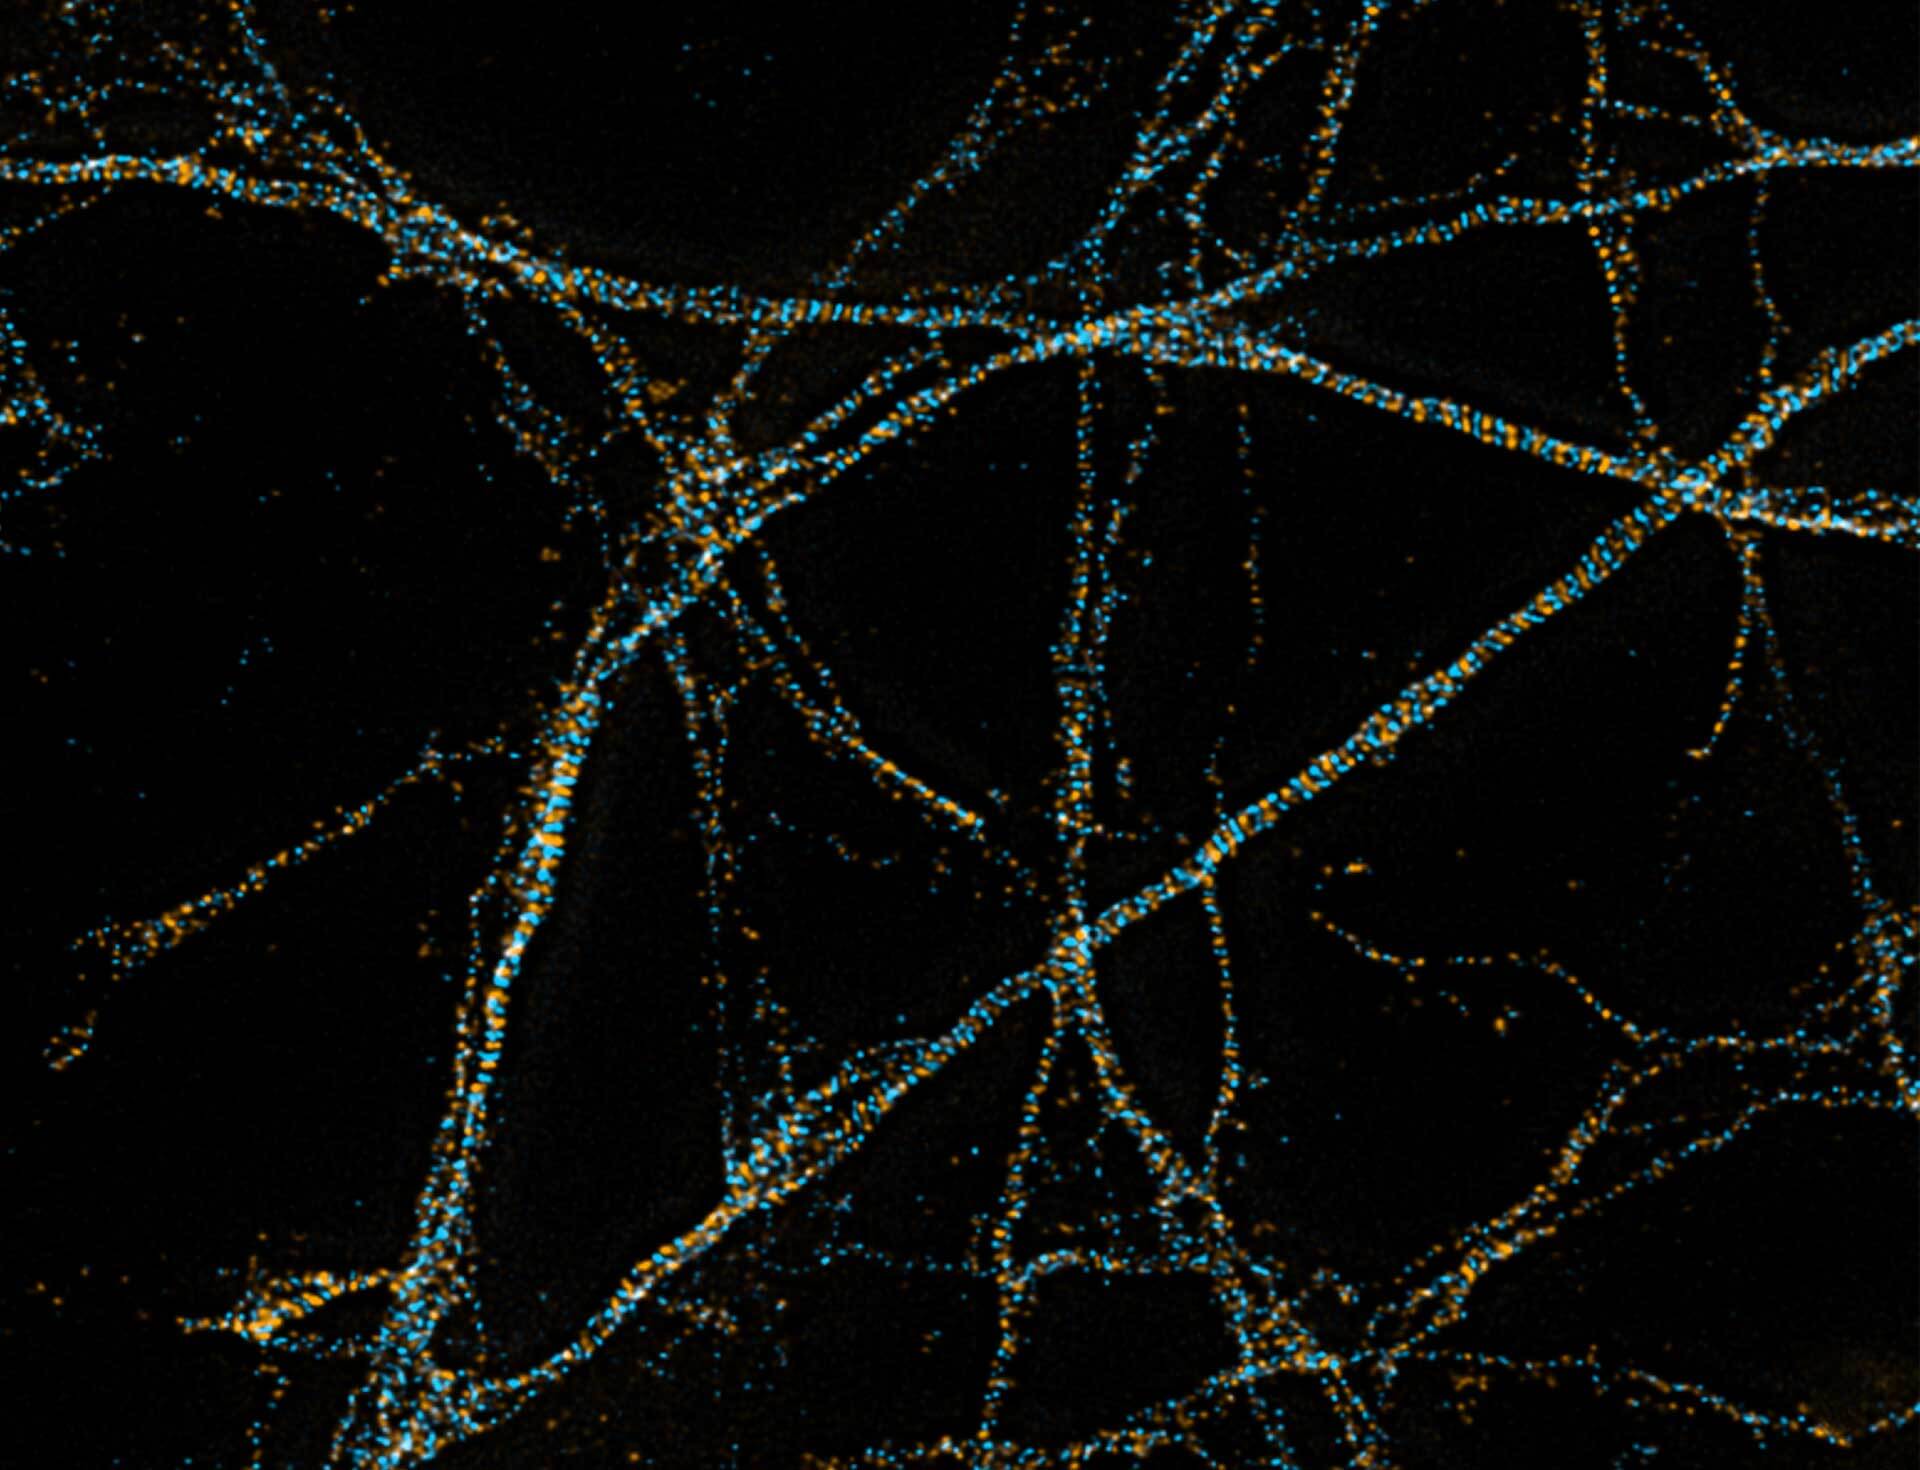
2D MINFLUX imaging of the cytoskeletal protein vimentin. Vimentin was labeled with Alexa Fluor 647 in fixed mammalian cells using indirect immunofluorescence. Note the individual filaments at intersections are invisible in the confocal image.
Description
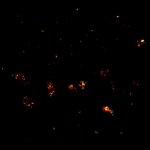
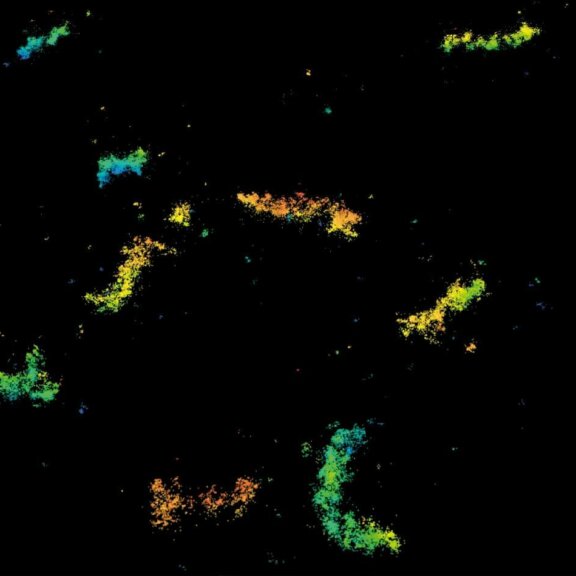
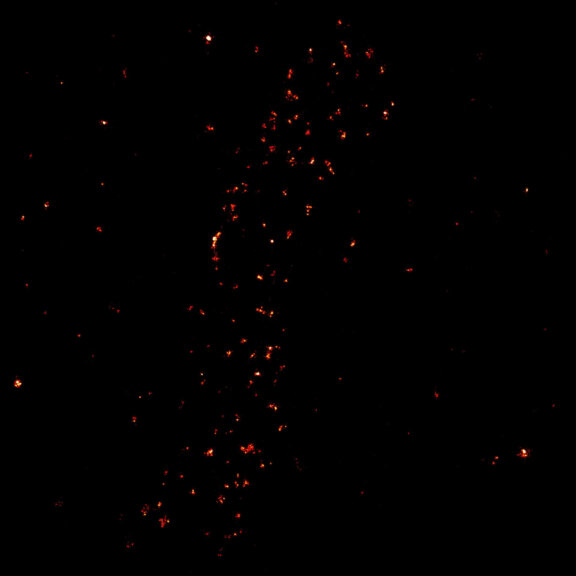
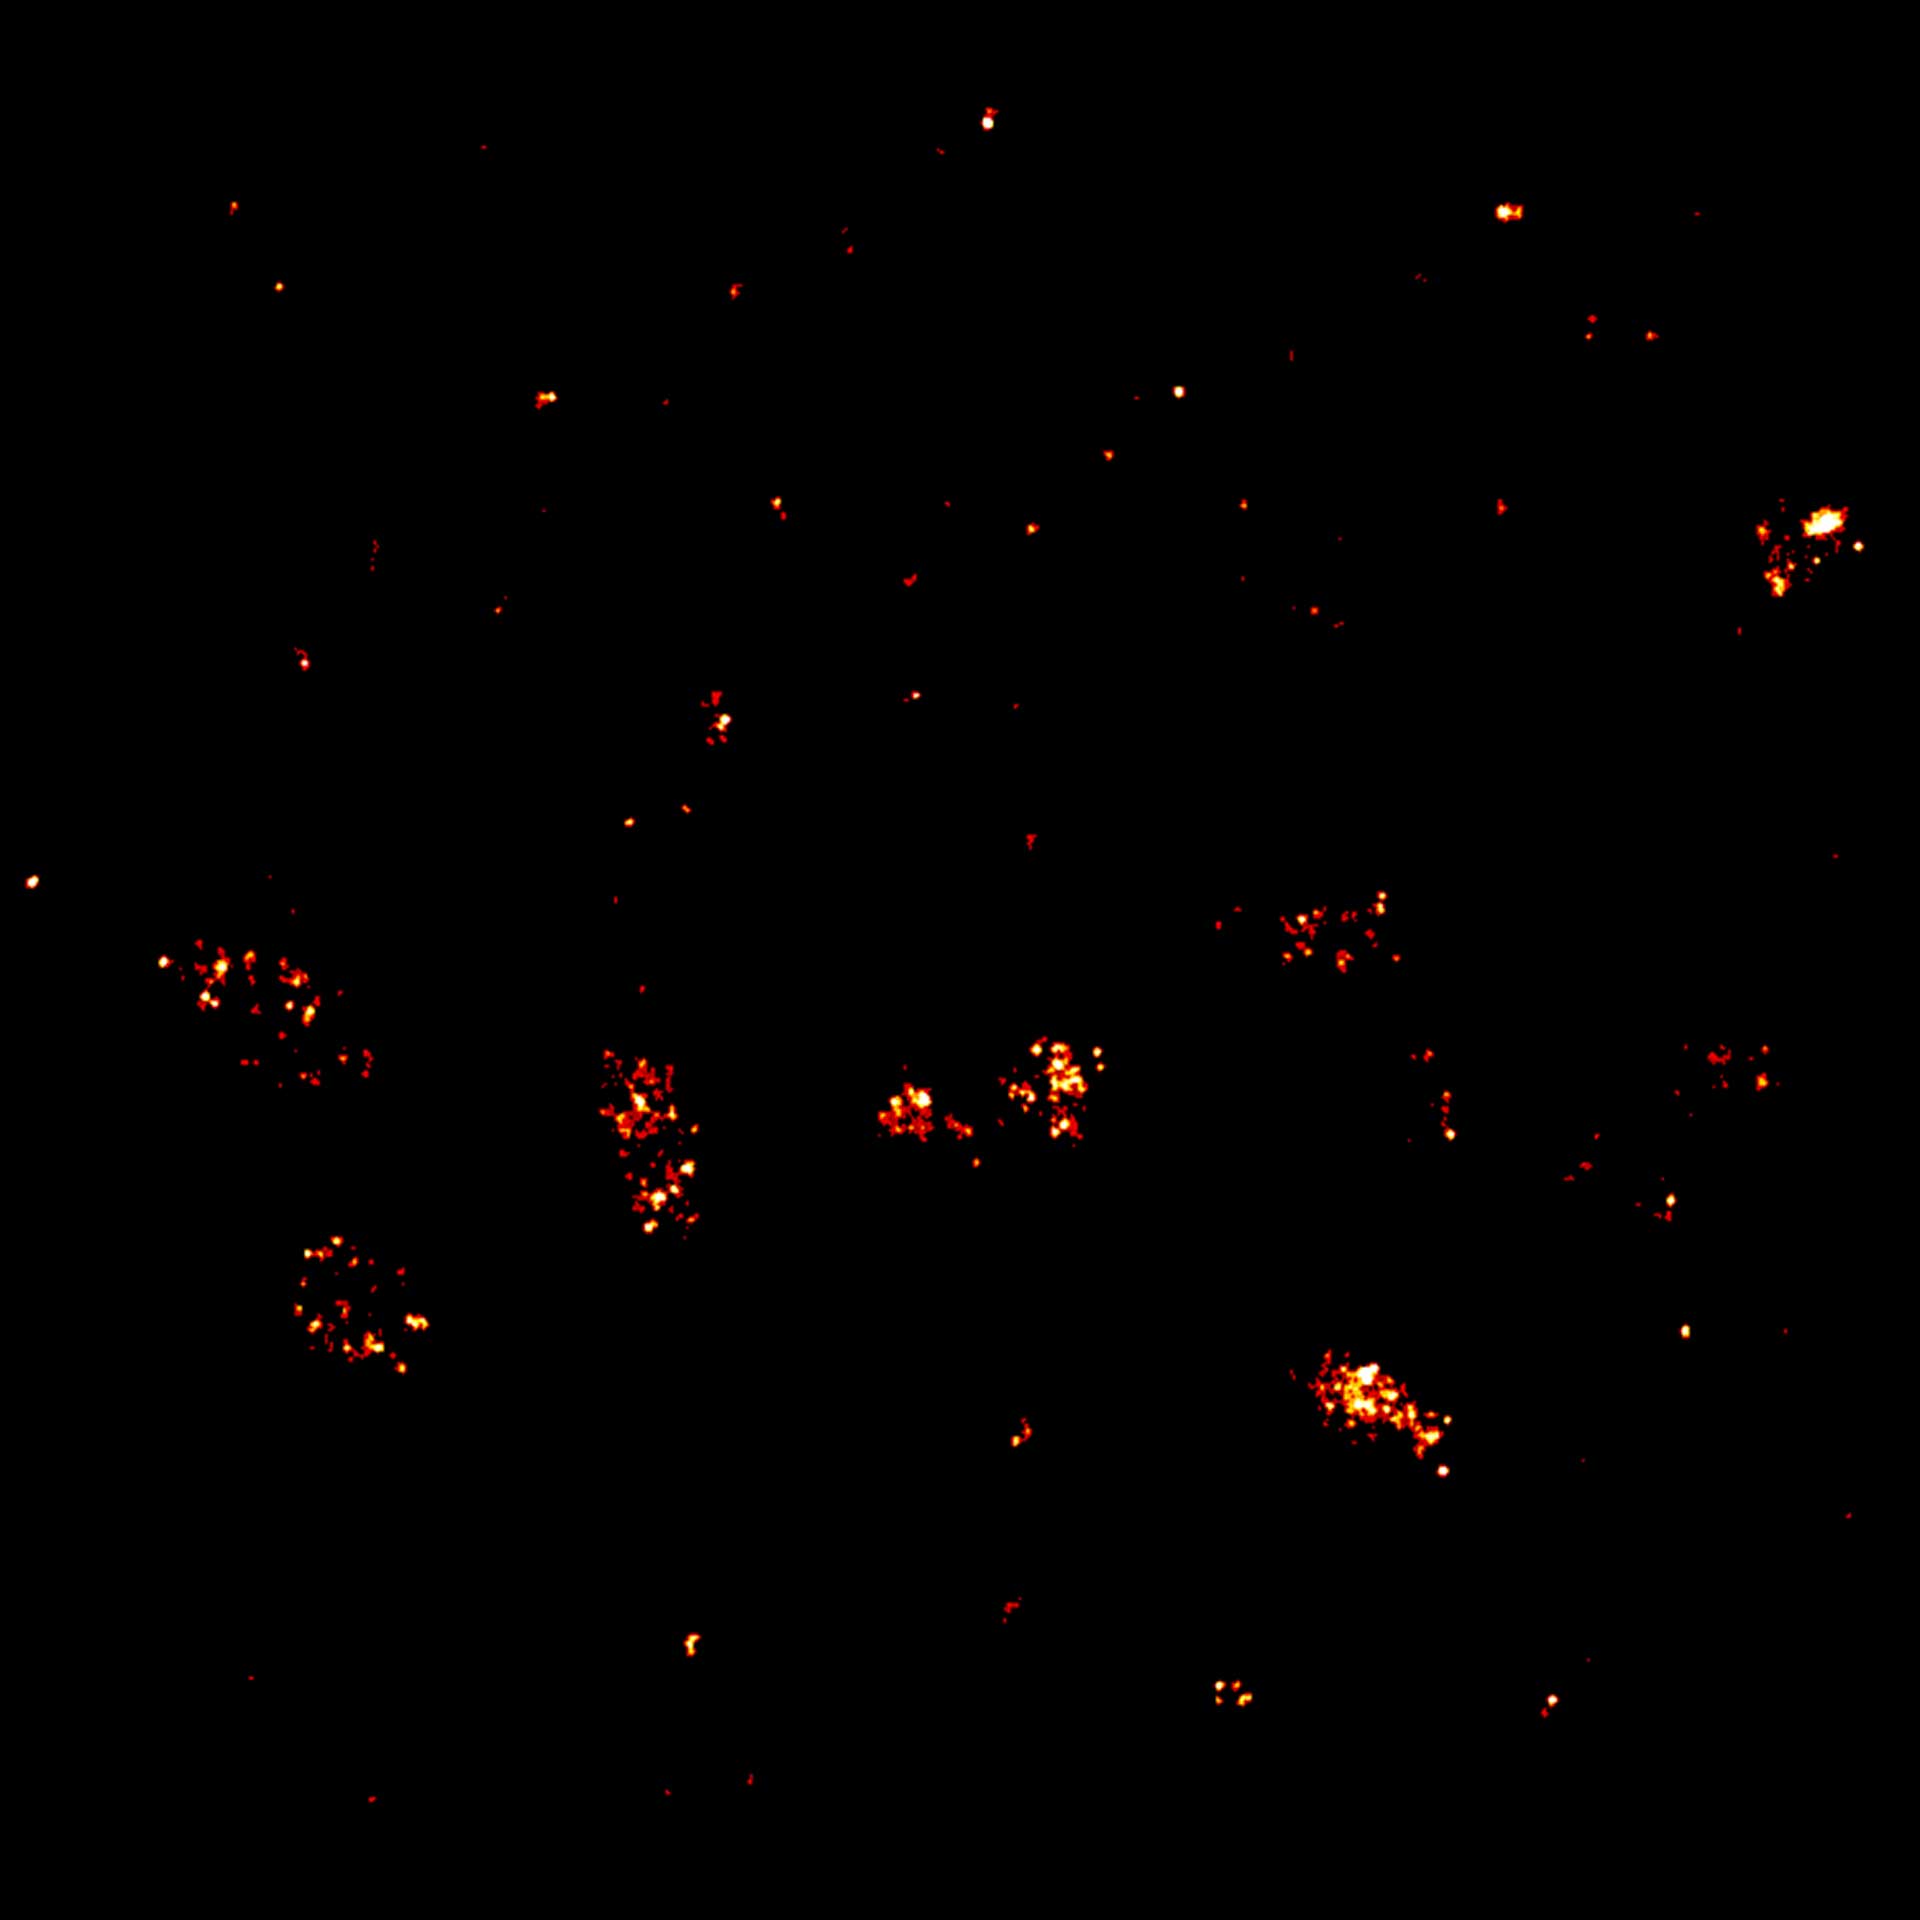
2D MINFLUX imaging of the peroxisomal membrane protein PMP70 labeled with Alexa Fluor 647 in fixed mammalian cells using indirect immunofluorescence
Description
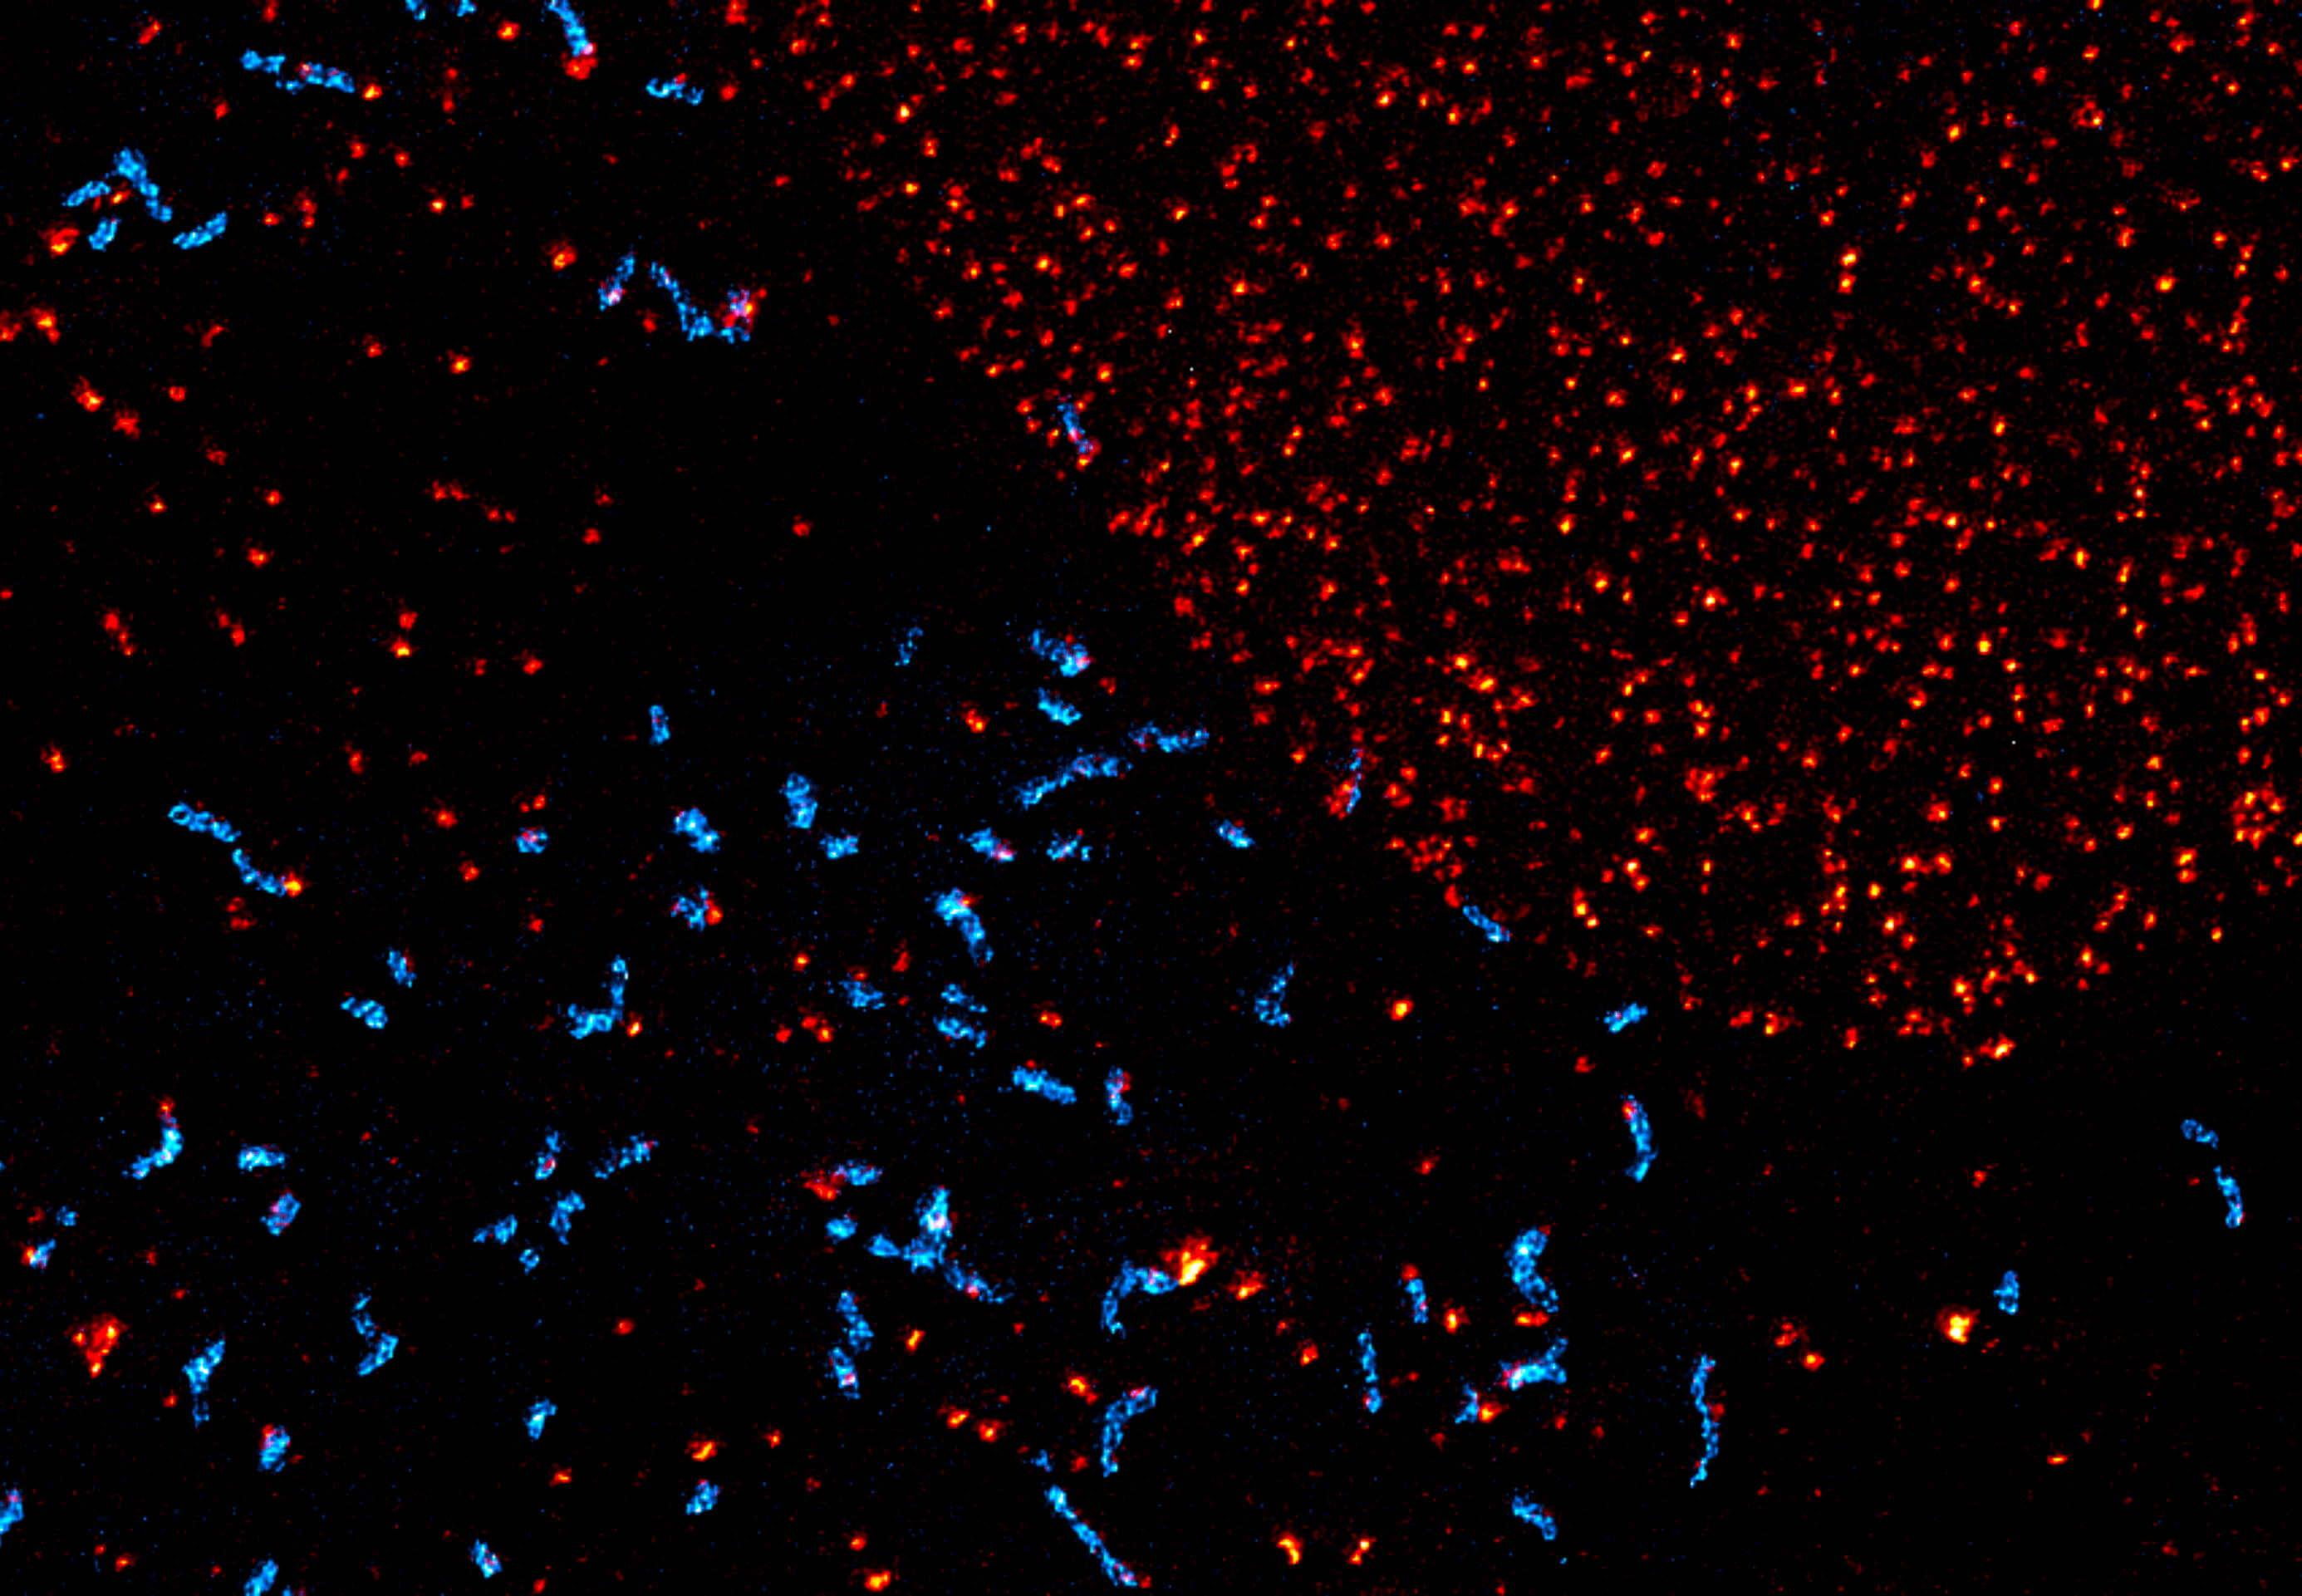
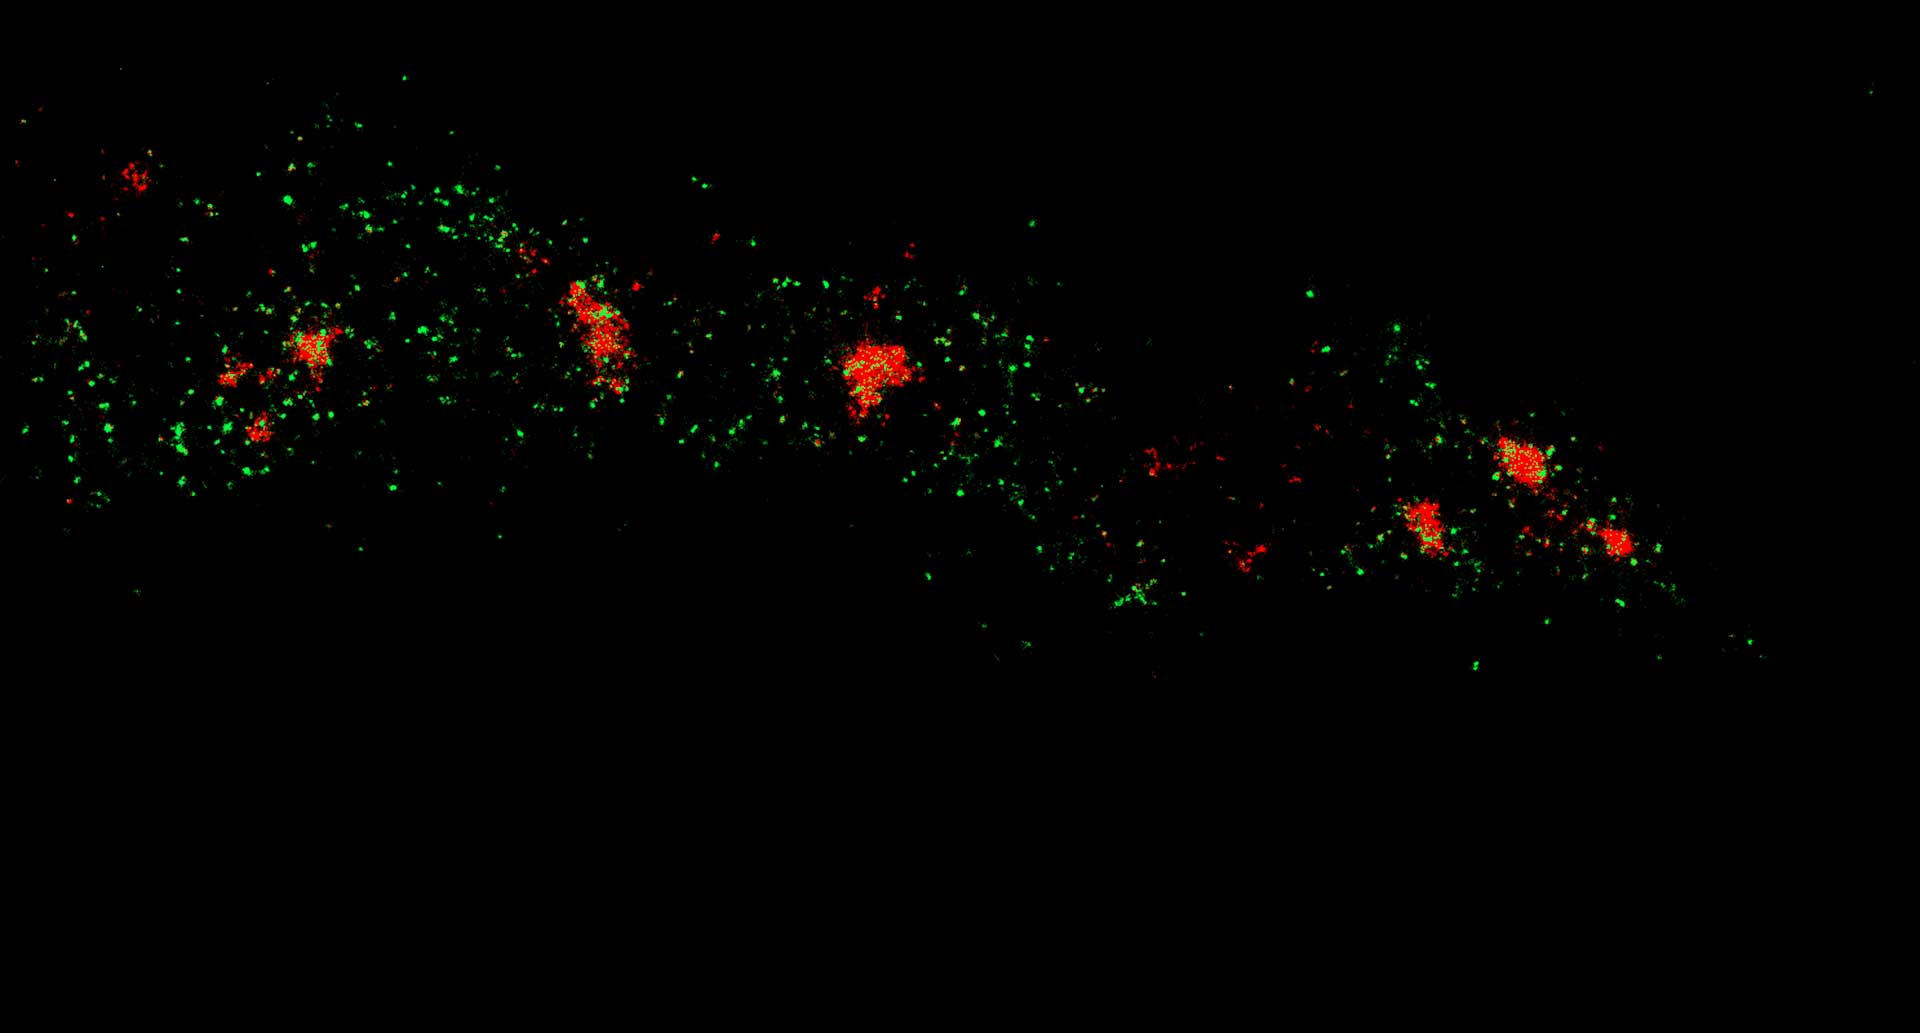
Two-color confocal and MINFLUX images of Tom20 (green) and mitochondrial DNA (red) stained with sCy5 and CF680 in mammalian cells using indirect immunolabeling. The two fluorophores were distinguished by ratiometric detection strategy. Note the dissimilar labeling density of the two imaged structures.
Description
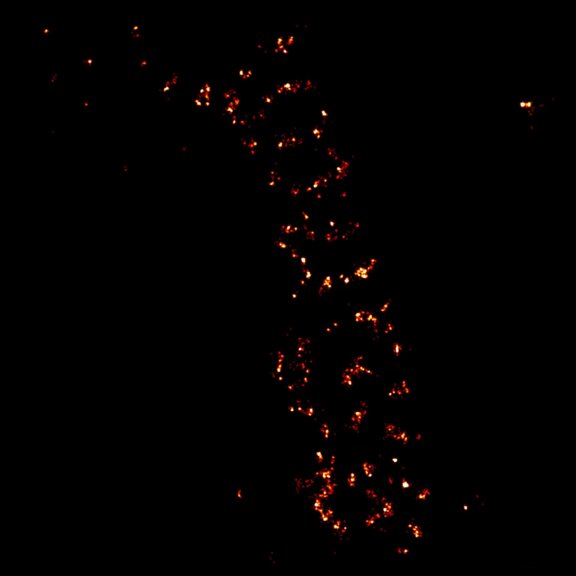
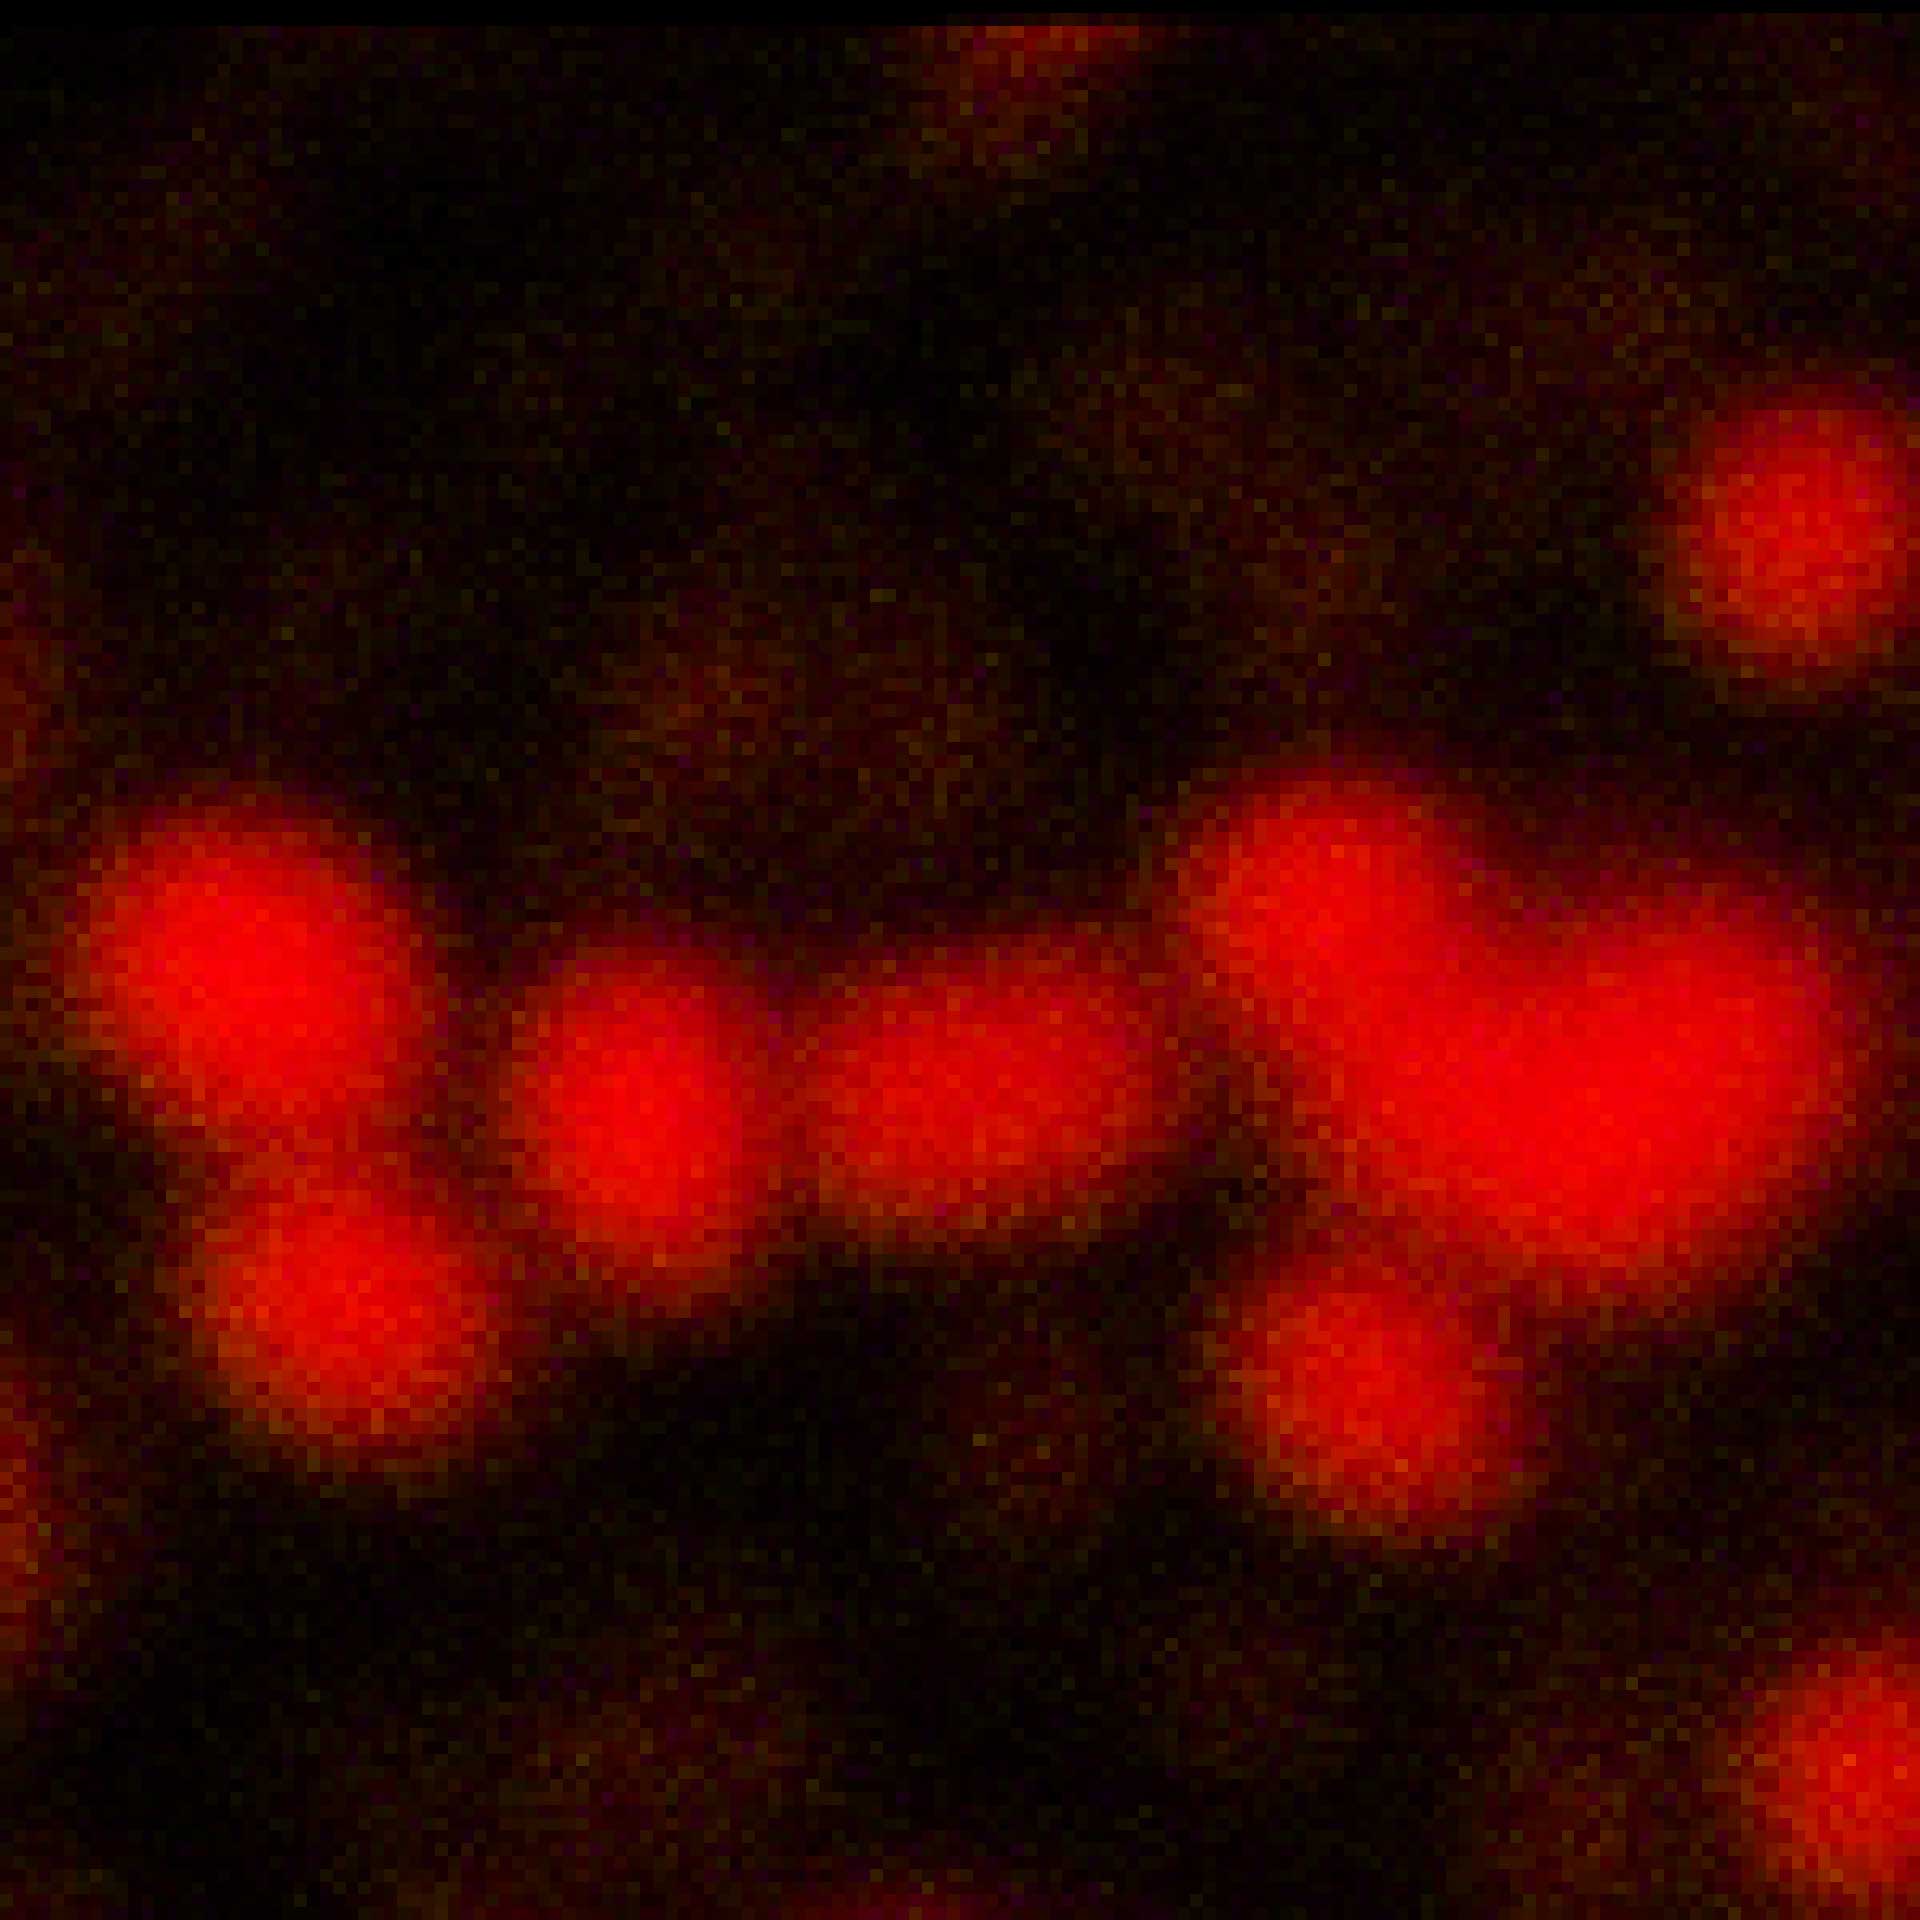
2D MINFLUX image of the mitochondrial import receptor Tom20 labeled with Alexa Fluor 647 in fixed mammalian cells using indirect immunolabeling.

Description
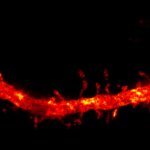
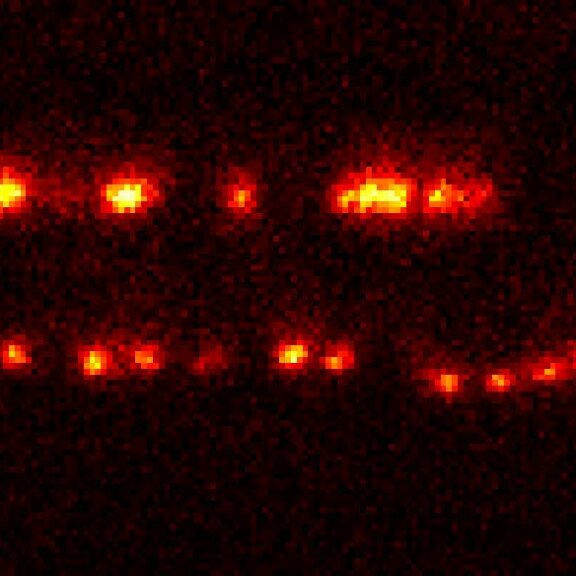
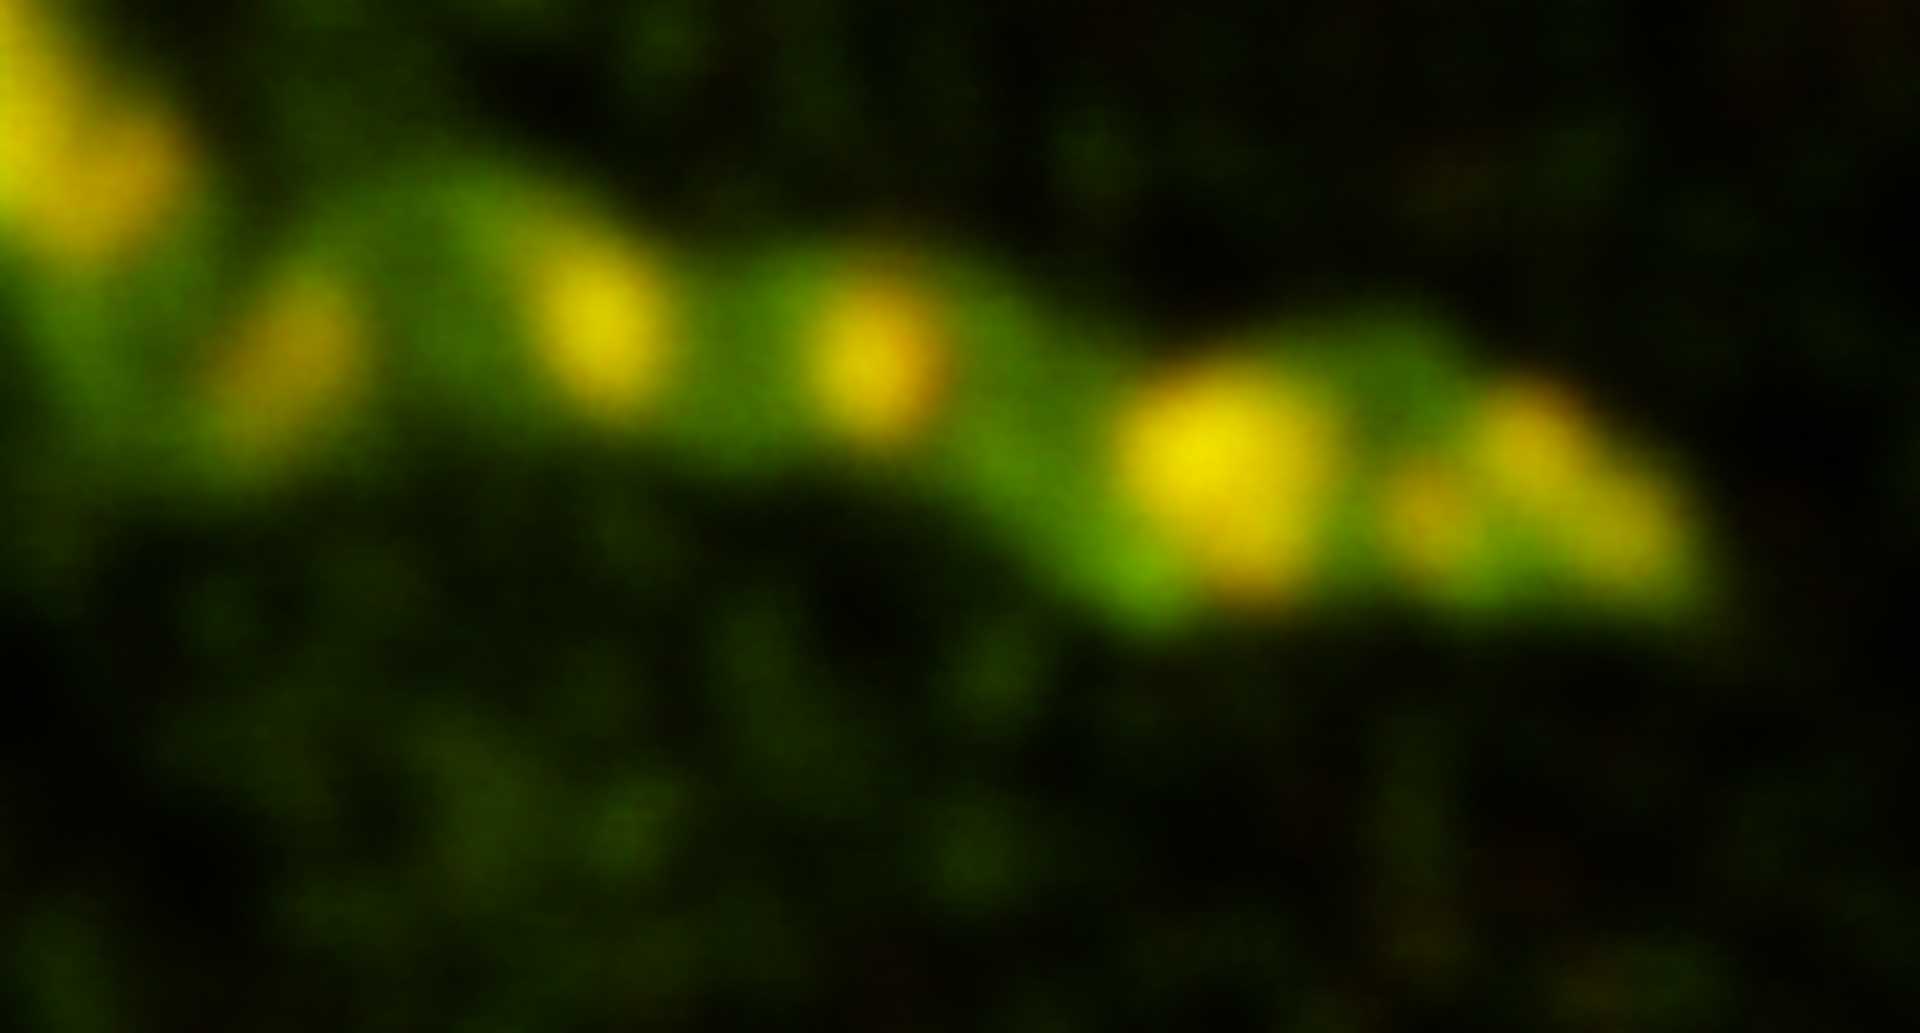
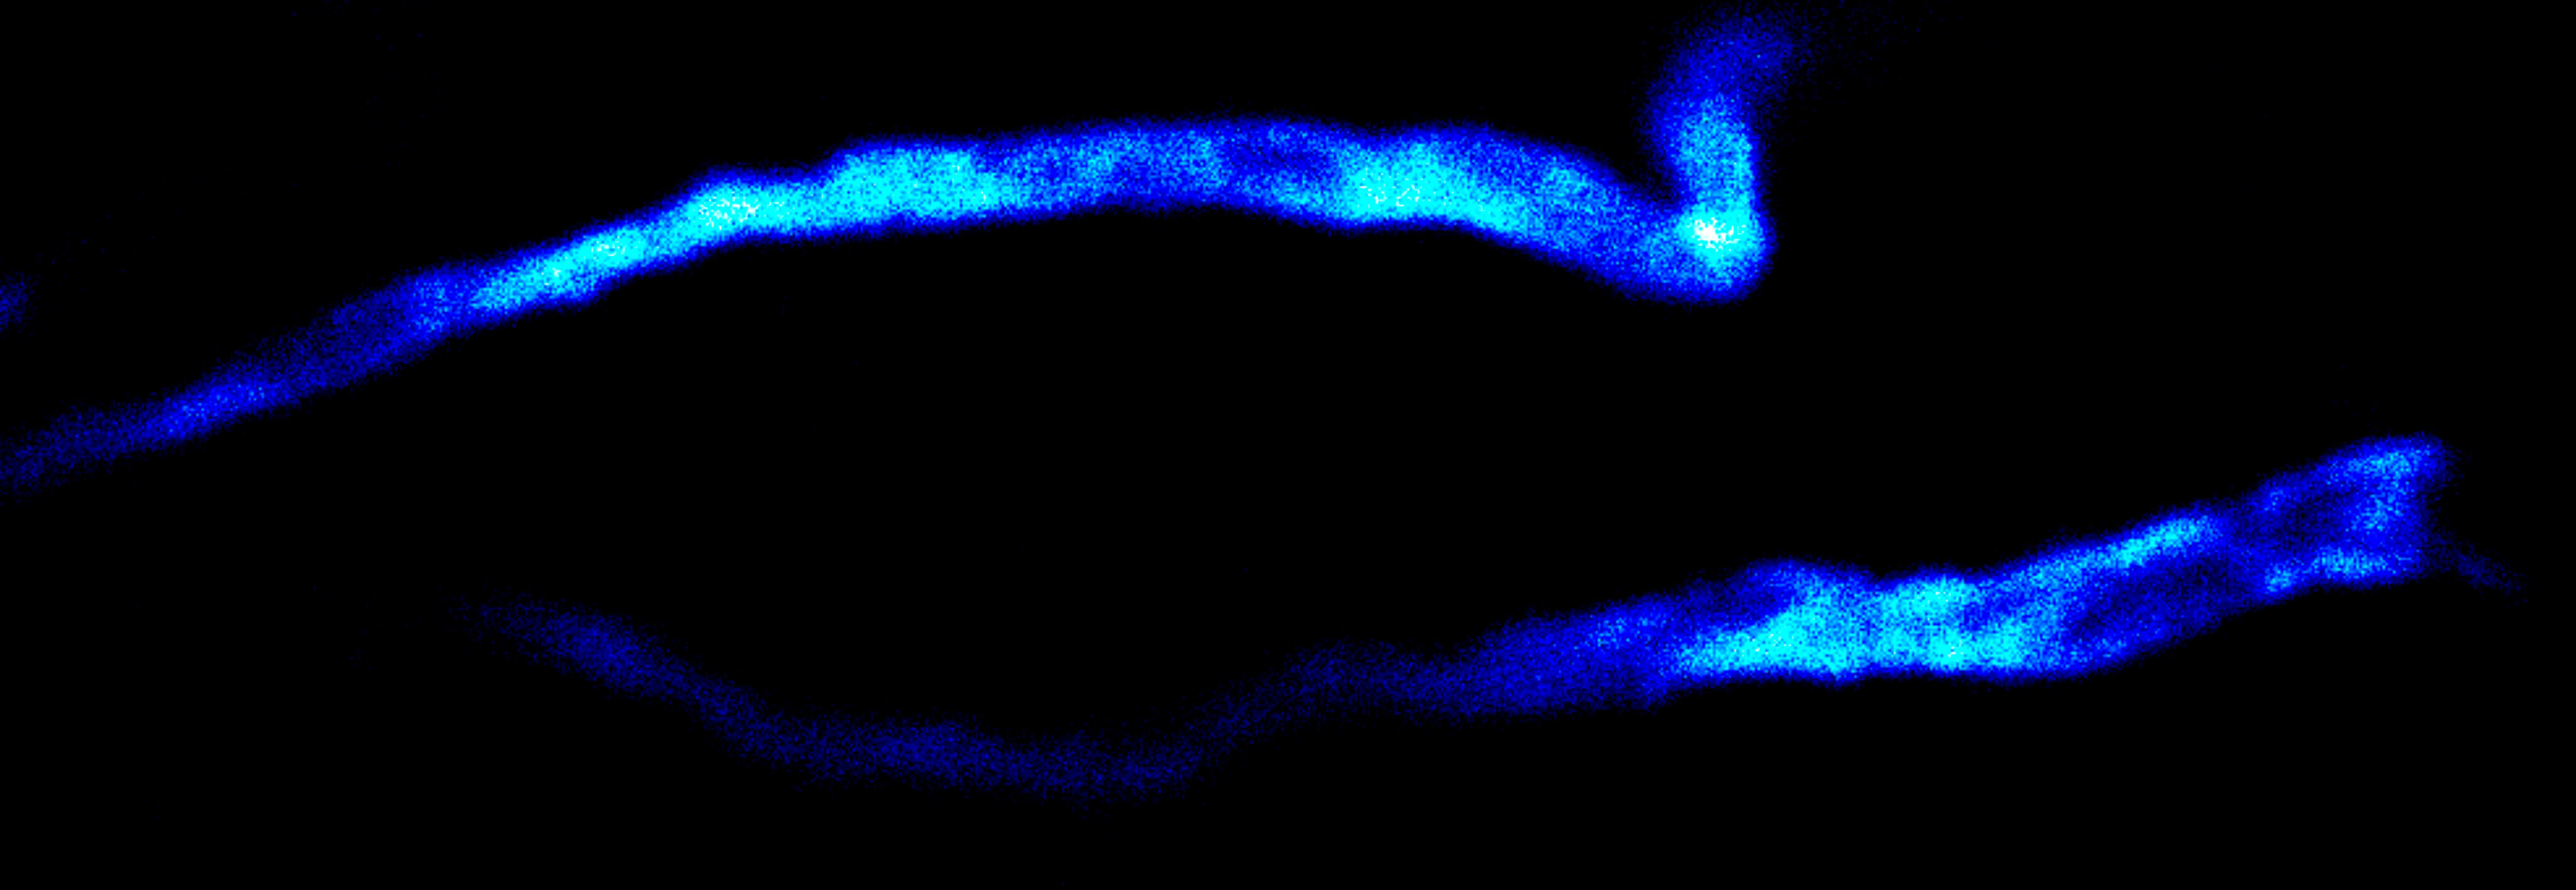
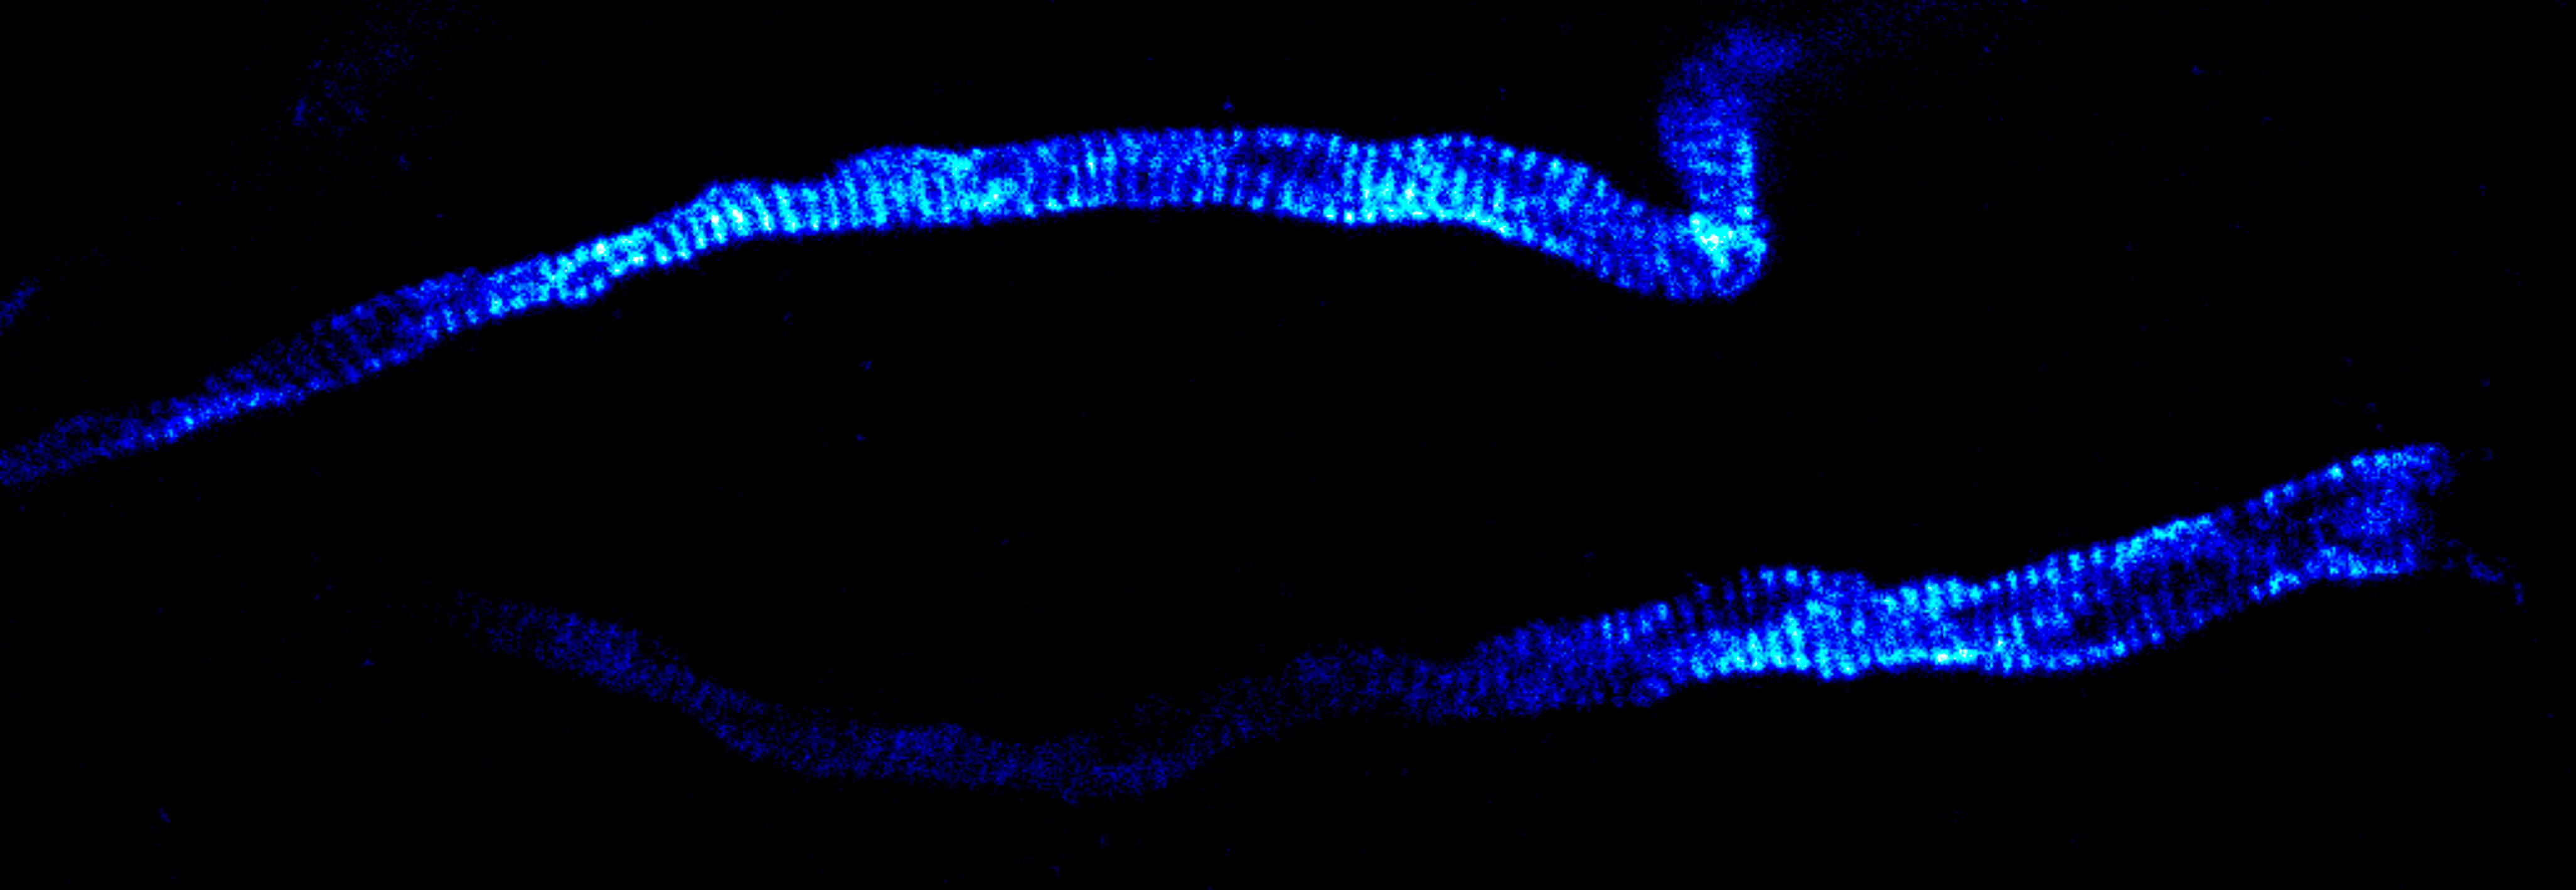
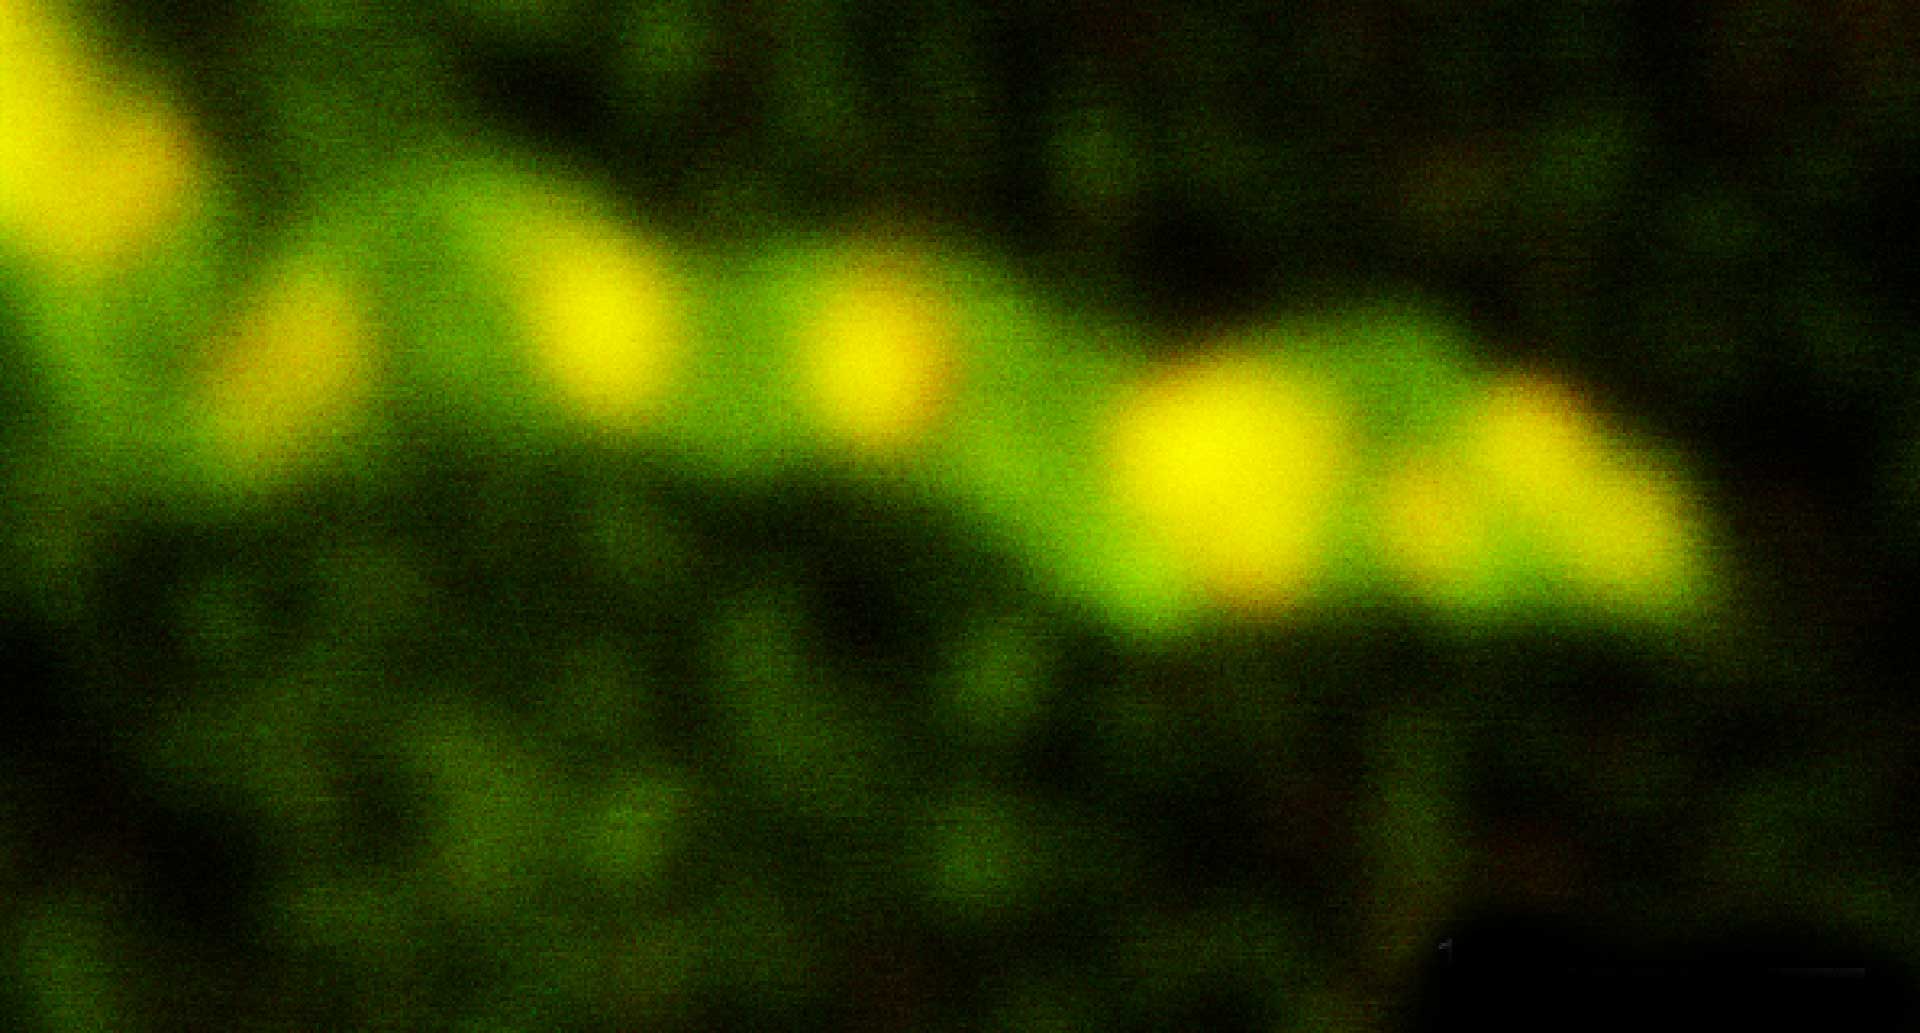
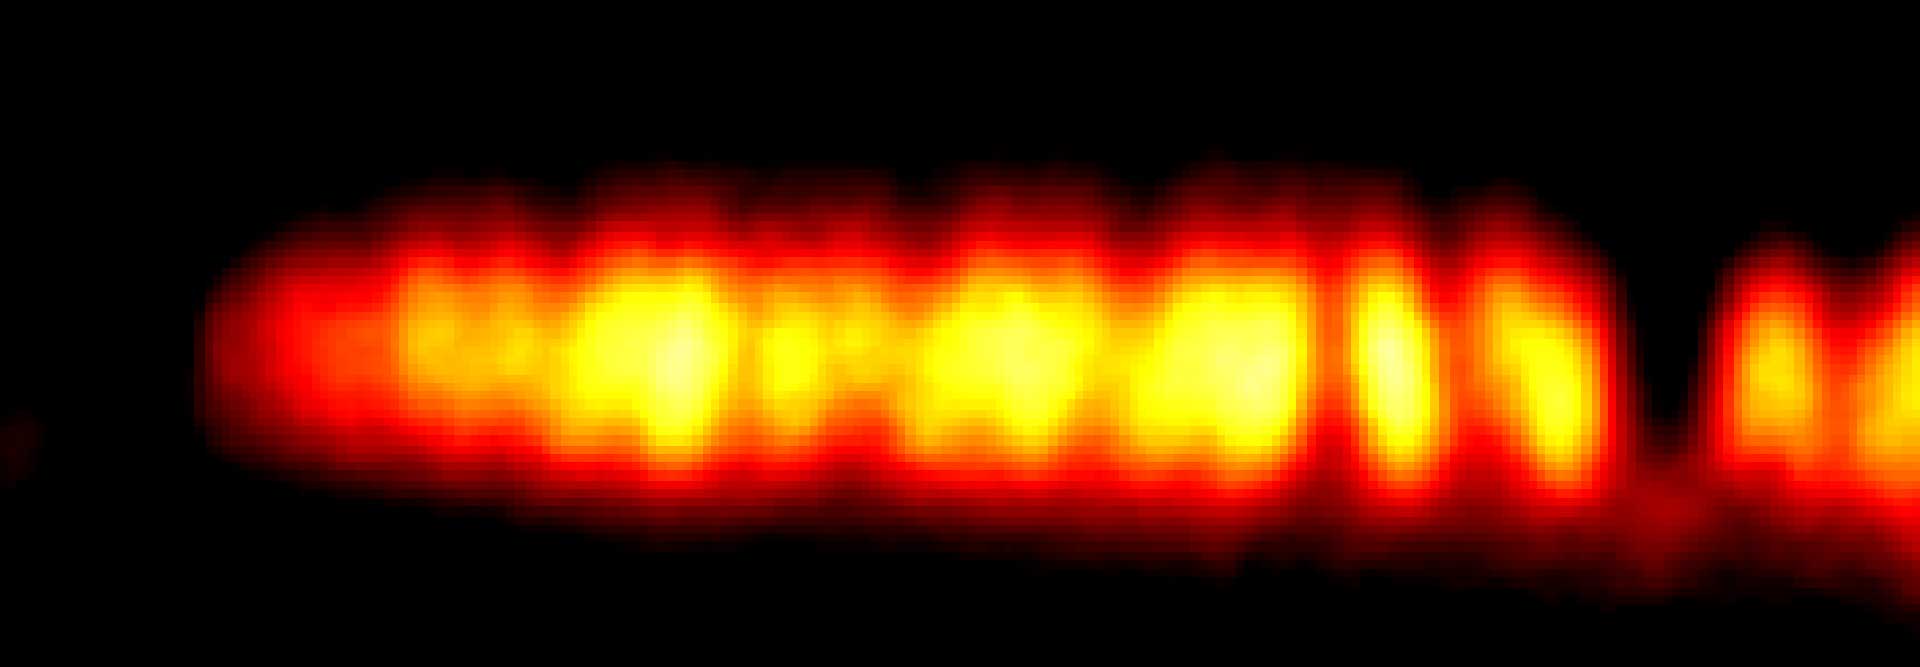
MINFLUX image of axonal bII spectrin in primary hippocampal neurons with < 2 nm resolution. Note the periodic arrangement of spectrin along the axon, and the absence of any details in the confocal counterpart image.
Description
Description
Modules:
Description

Description
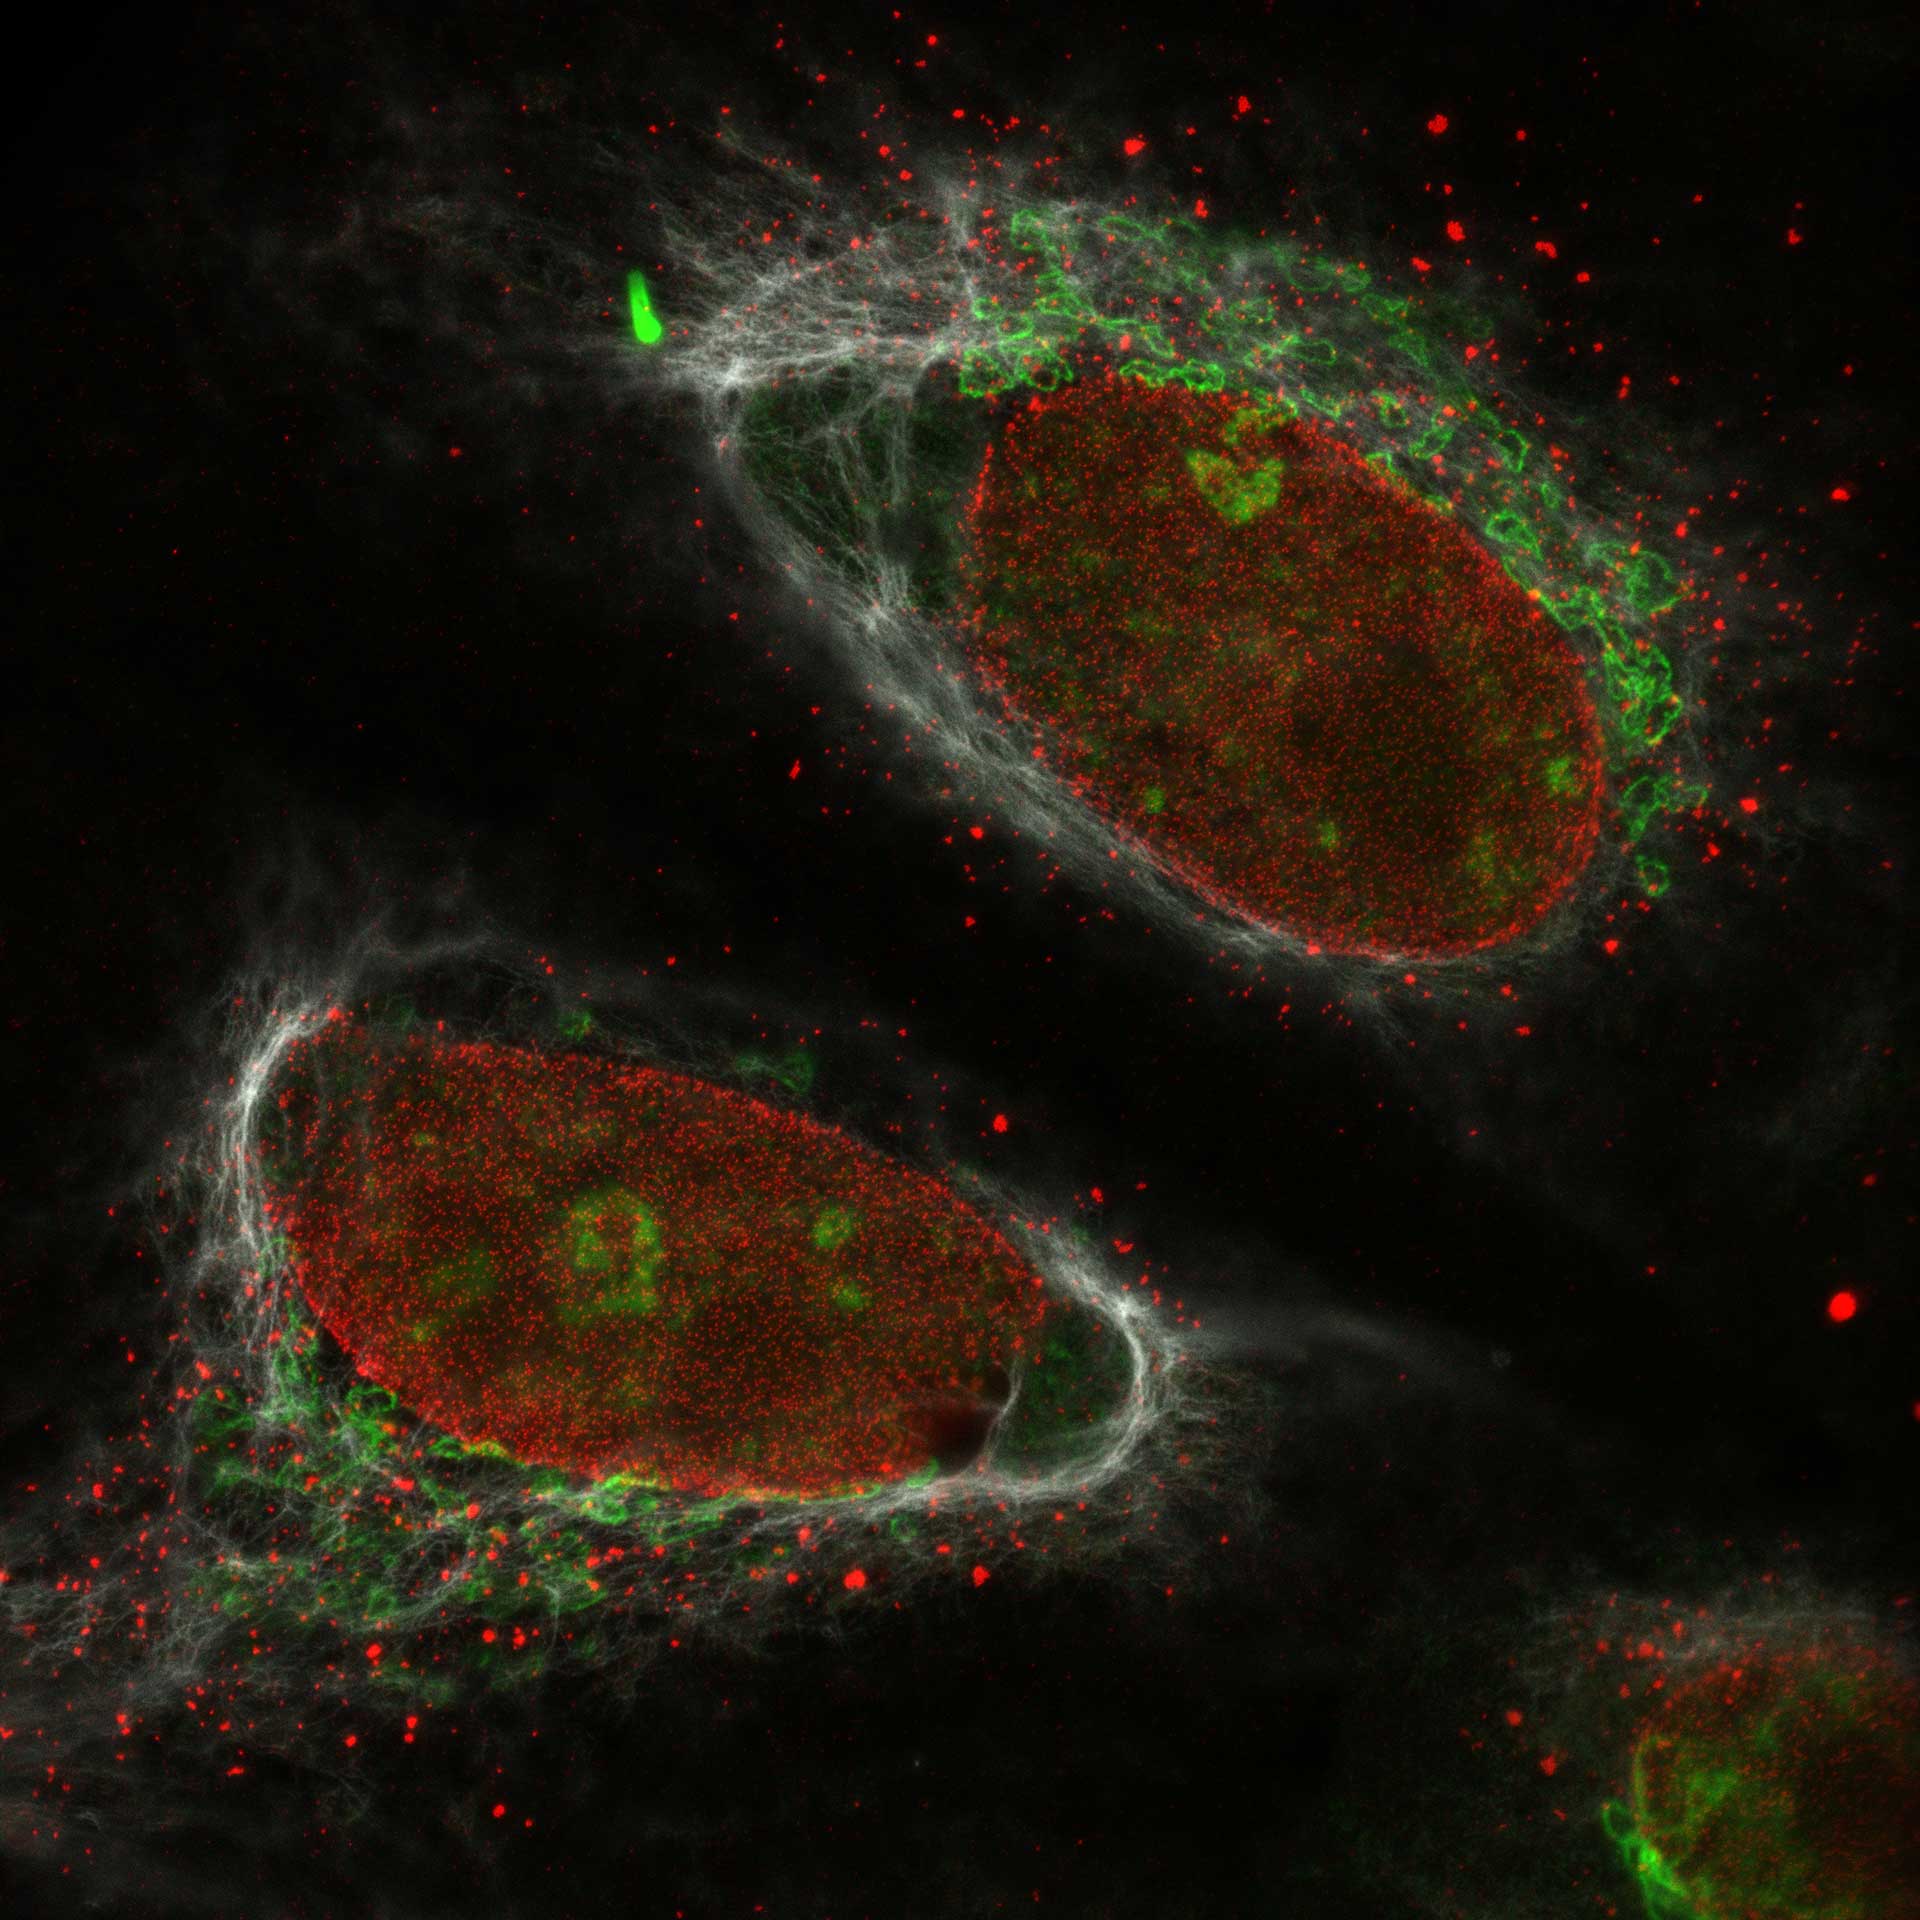
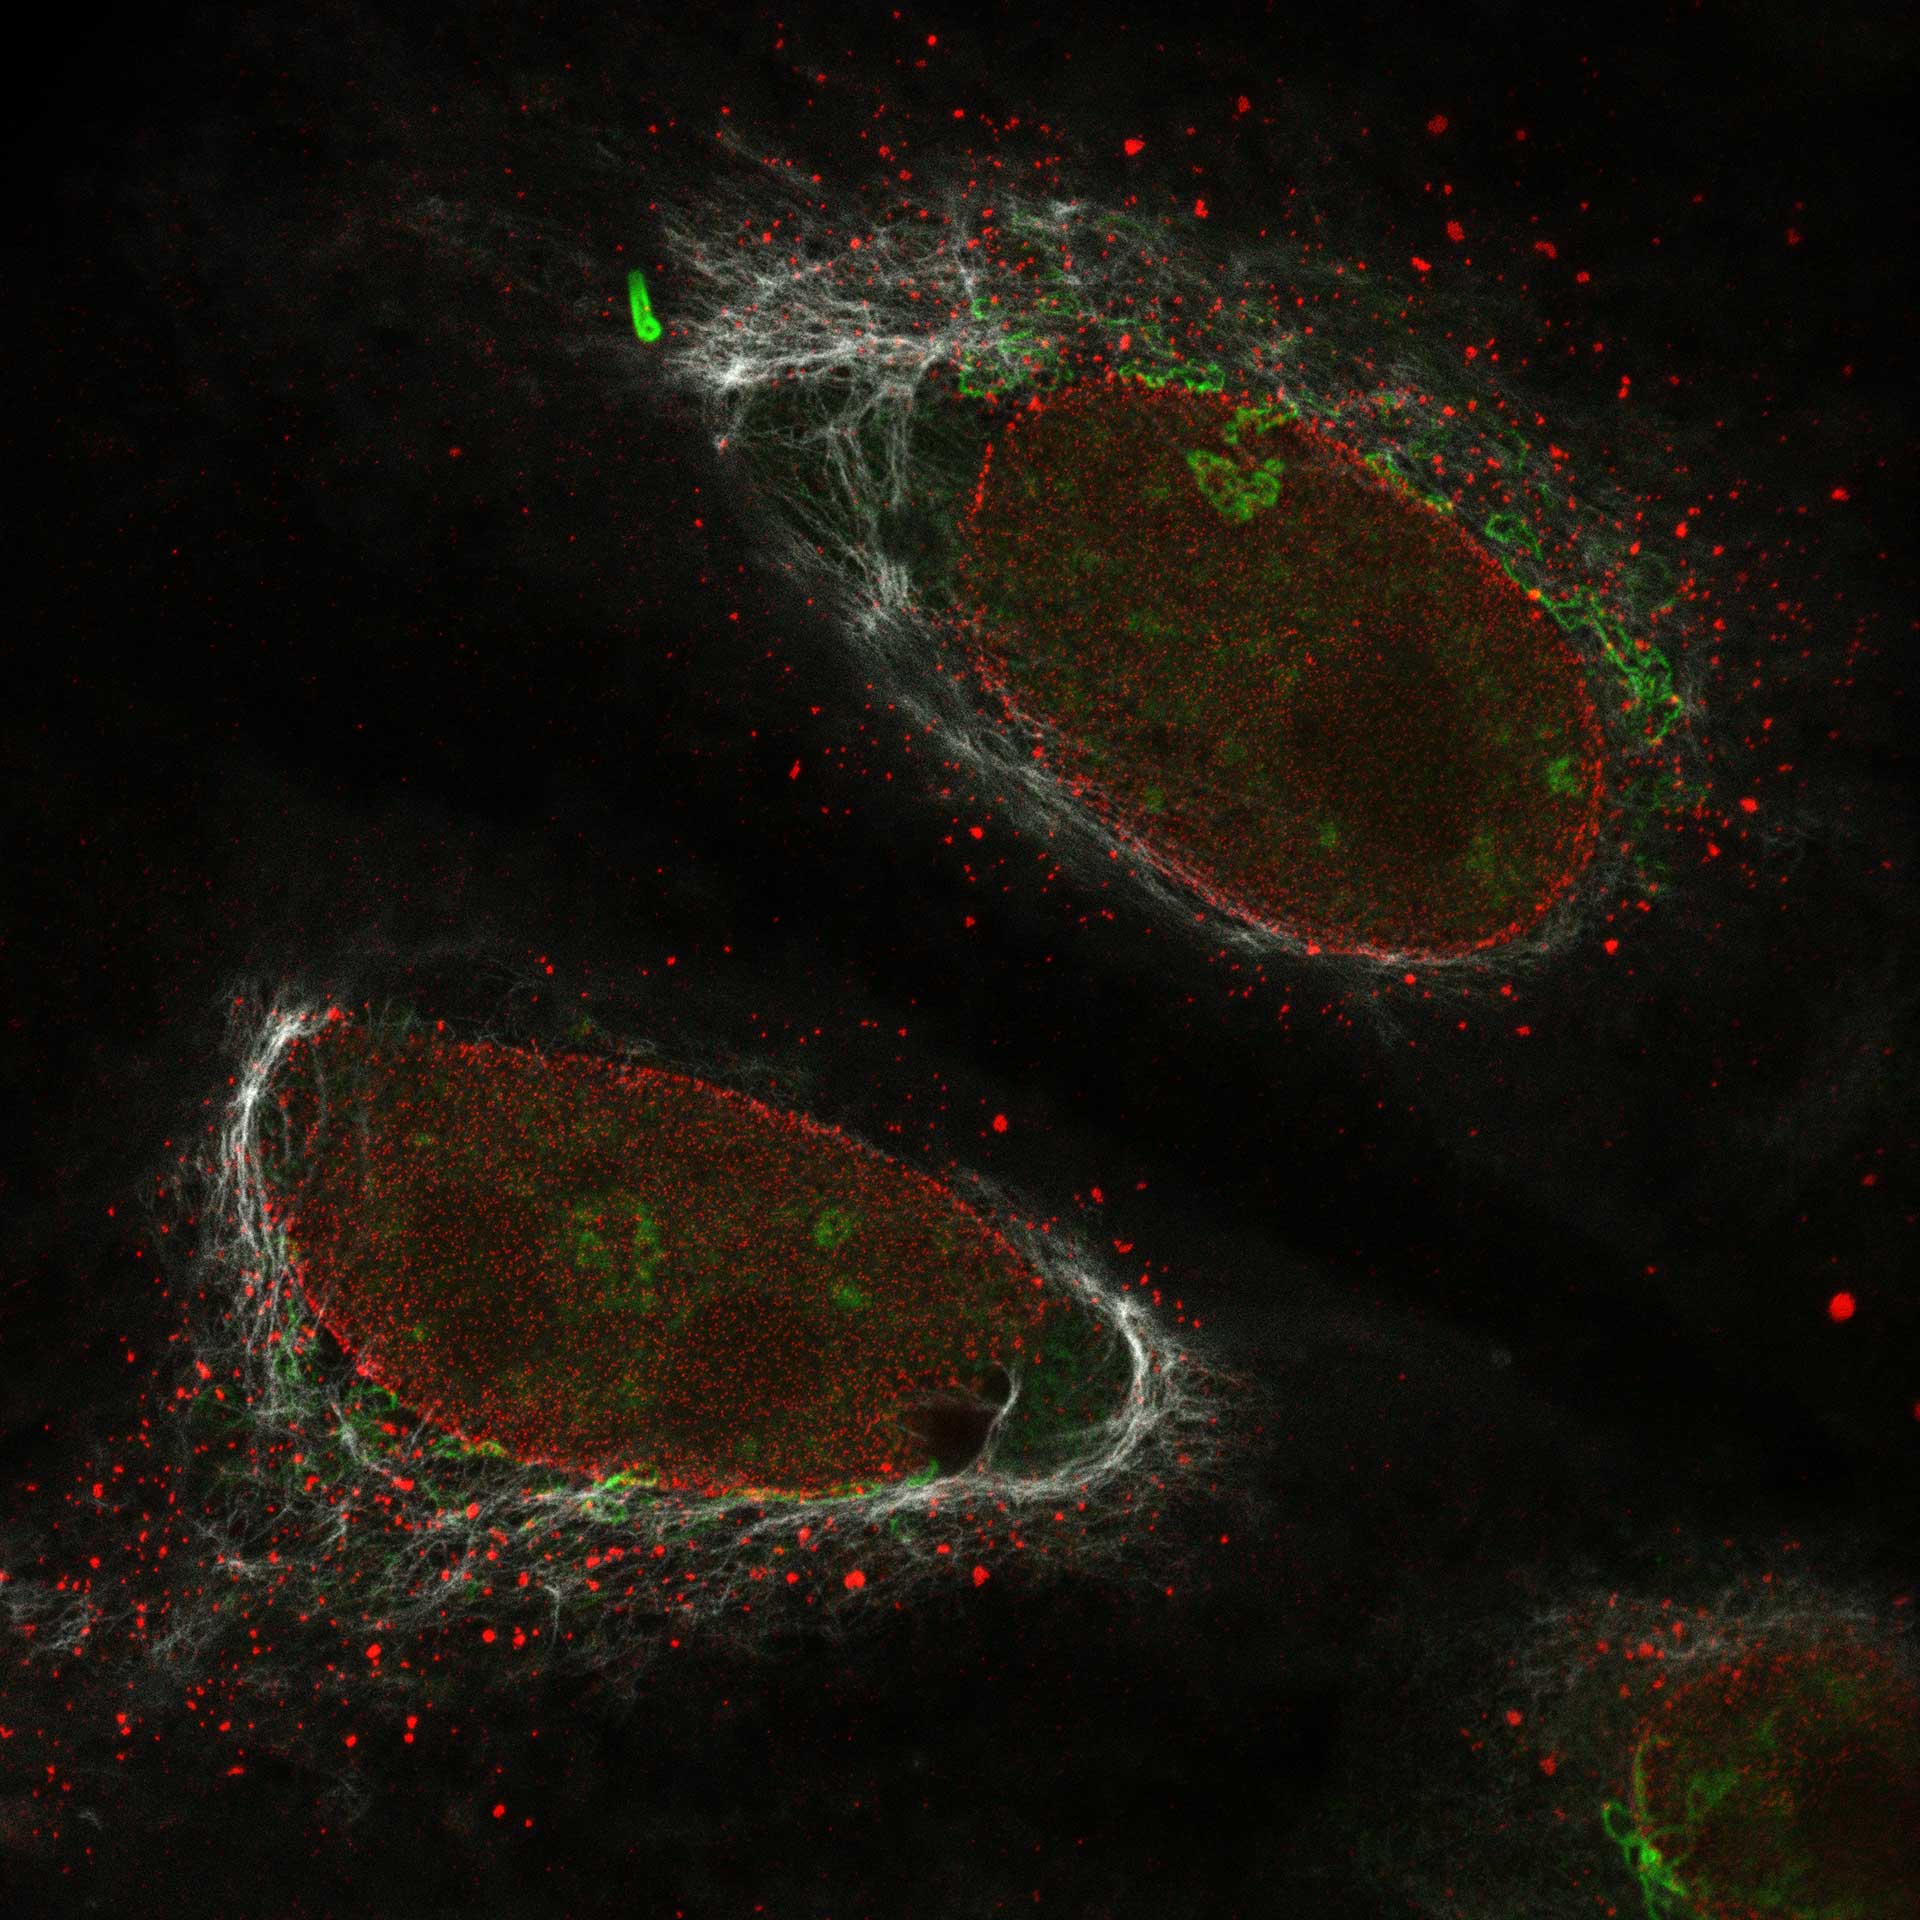
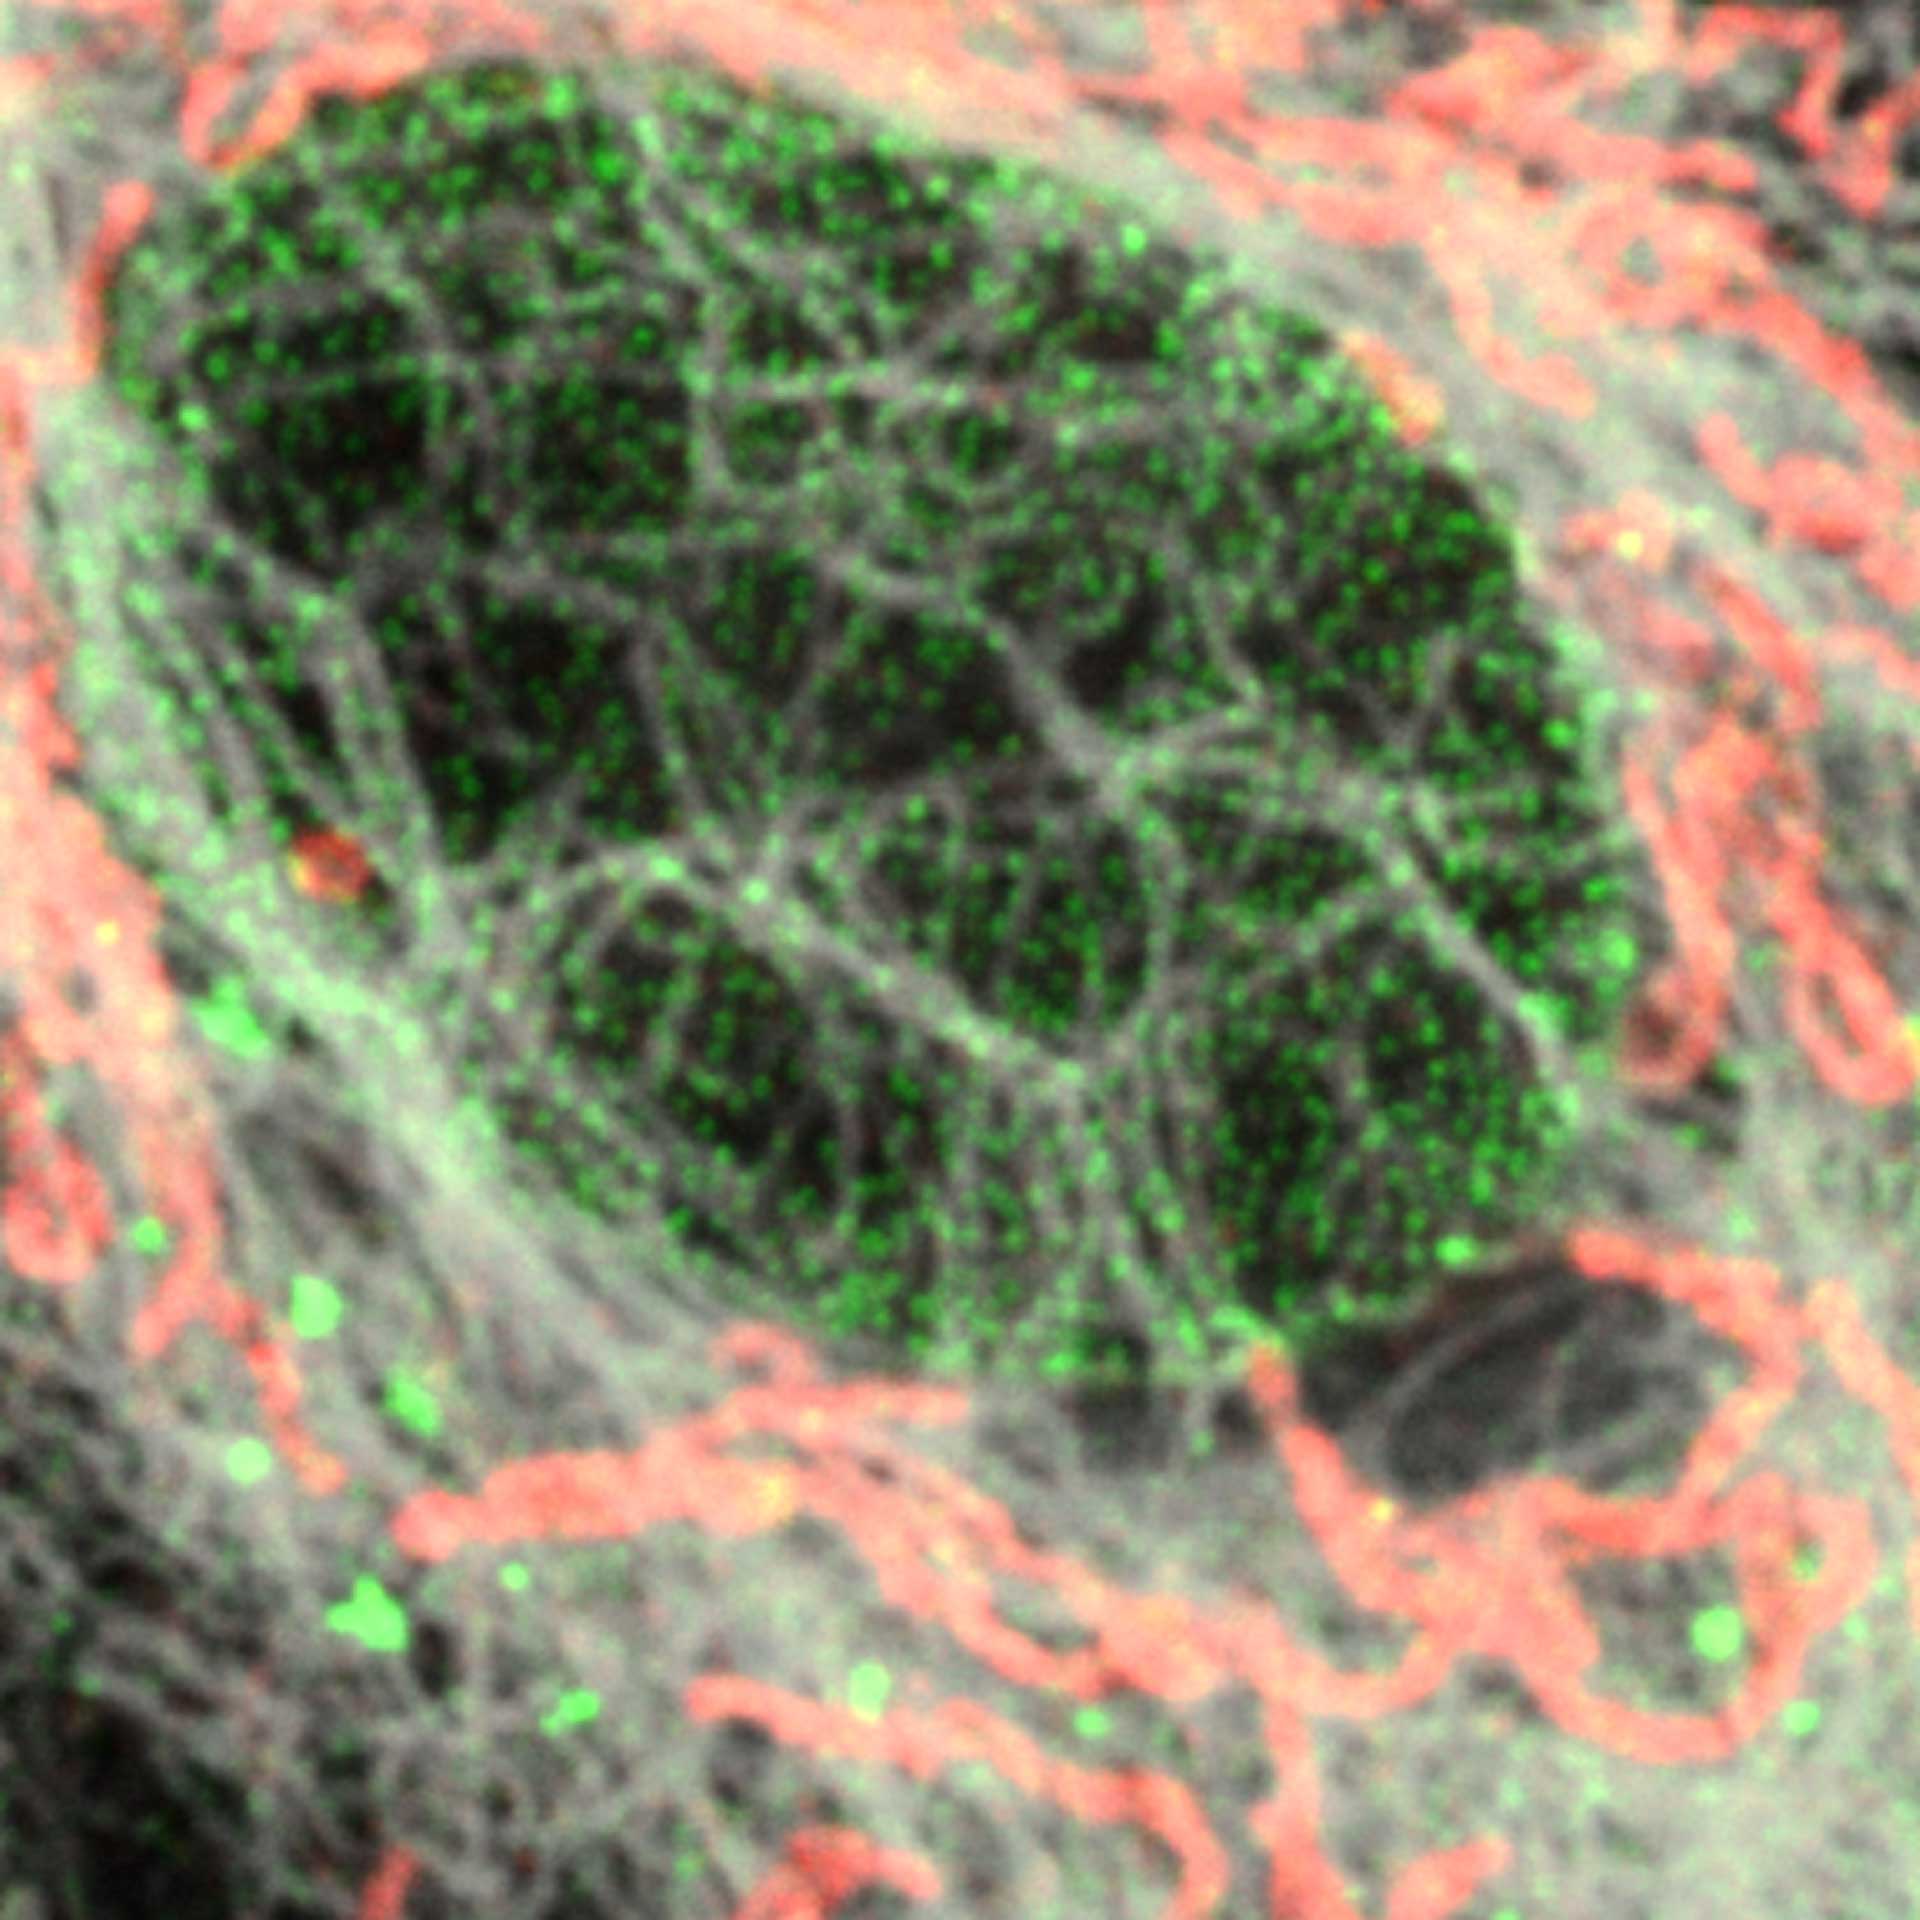
Nuclear pore complex (green), Tom20 (red), and vimentin (white) in cultured mammalian cells.
Modules:
Description
Actin stain of mouse inner ear hair cells using abberior STAR RED phalloidin.
Samples were prepared by Dr. Christian Vogl, InnerEarLab, UMG Göttingen, Germany.