

Sample gallery
Fluorescence imaging, whether at confocal, STED or MINFLUX resolution, guarantees unique insights into the function and structure of life at the molecular level. Besides the scientific information content, some sample portraits provide simply beautiful images. Enjoy browsing our sample gallery.
the fine art of science
Description
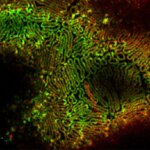
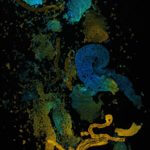
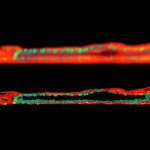
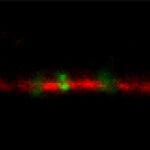
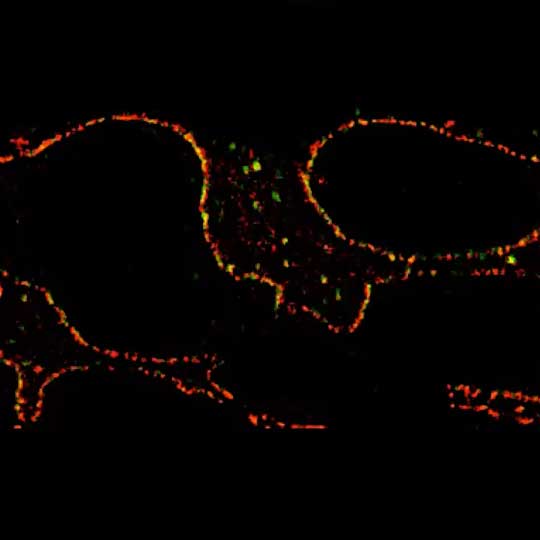
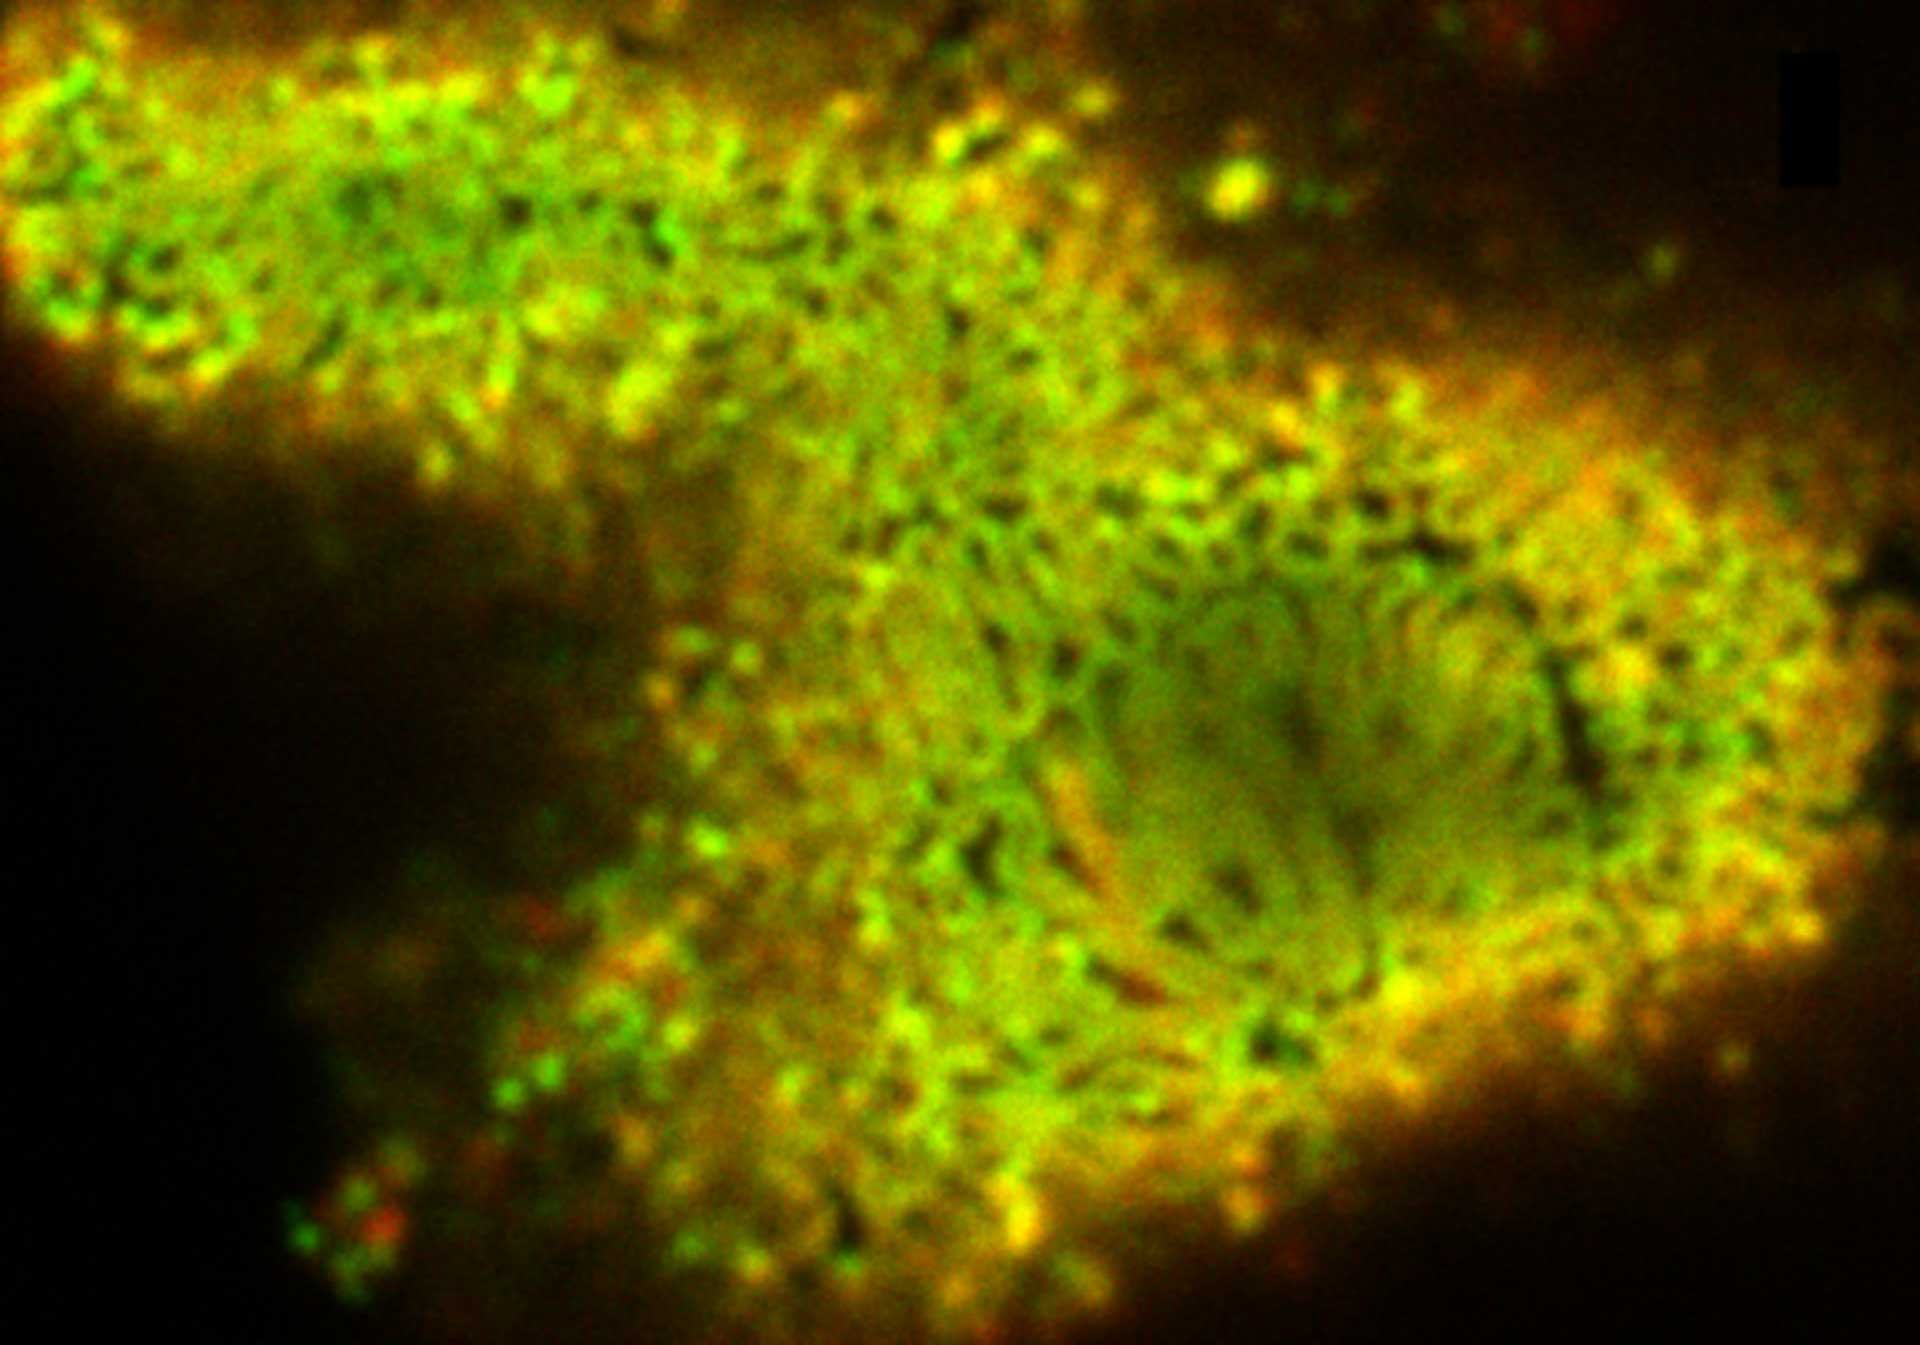
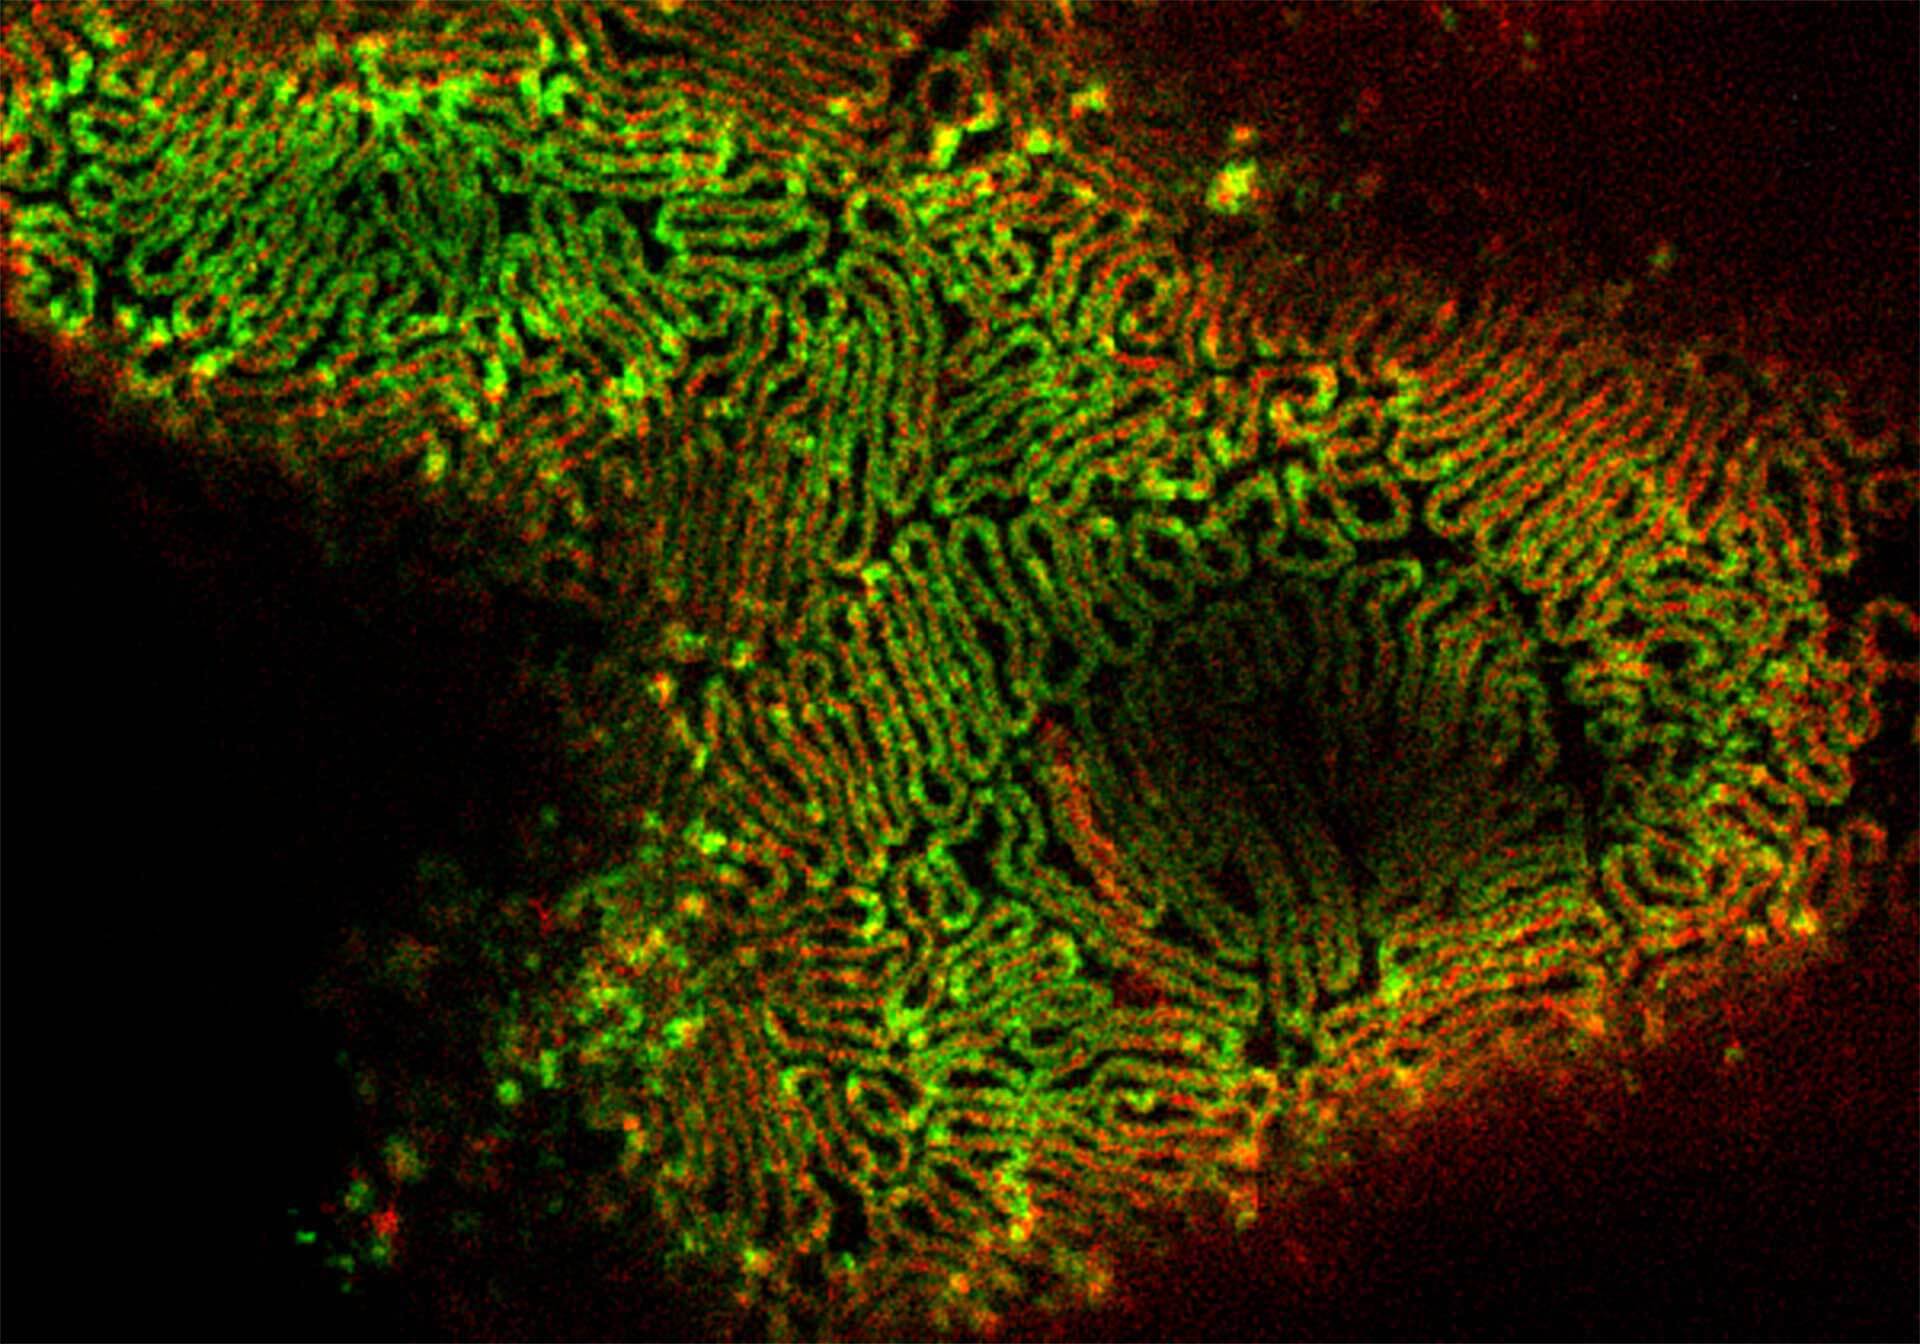
2-color 2D STED image of a cleared adult kidney sample of a rat. Shown is an image of a renal corpuscle showing Nephrin (red, abberior STAR 635P) structures inbetween the Podocin slits (green, AlexaFluor594).
Sample was prepared by D. Unnersjö Jess and H.G. Blom @ KTH Stockholm, Sweden.
Description
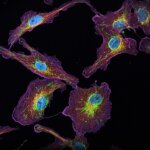
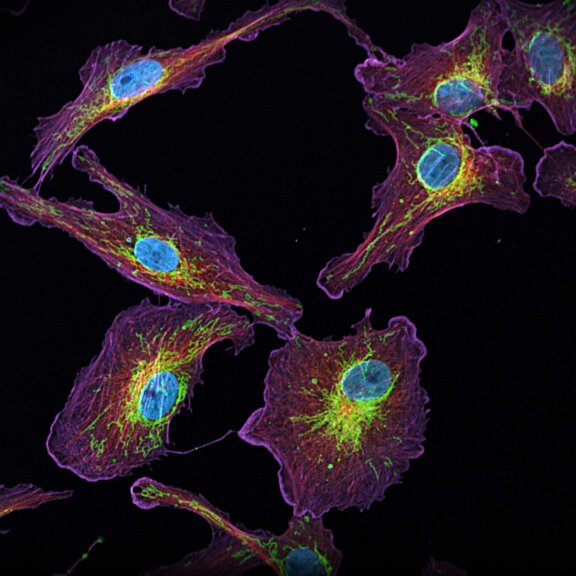
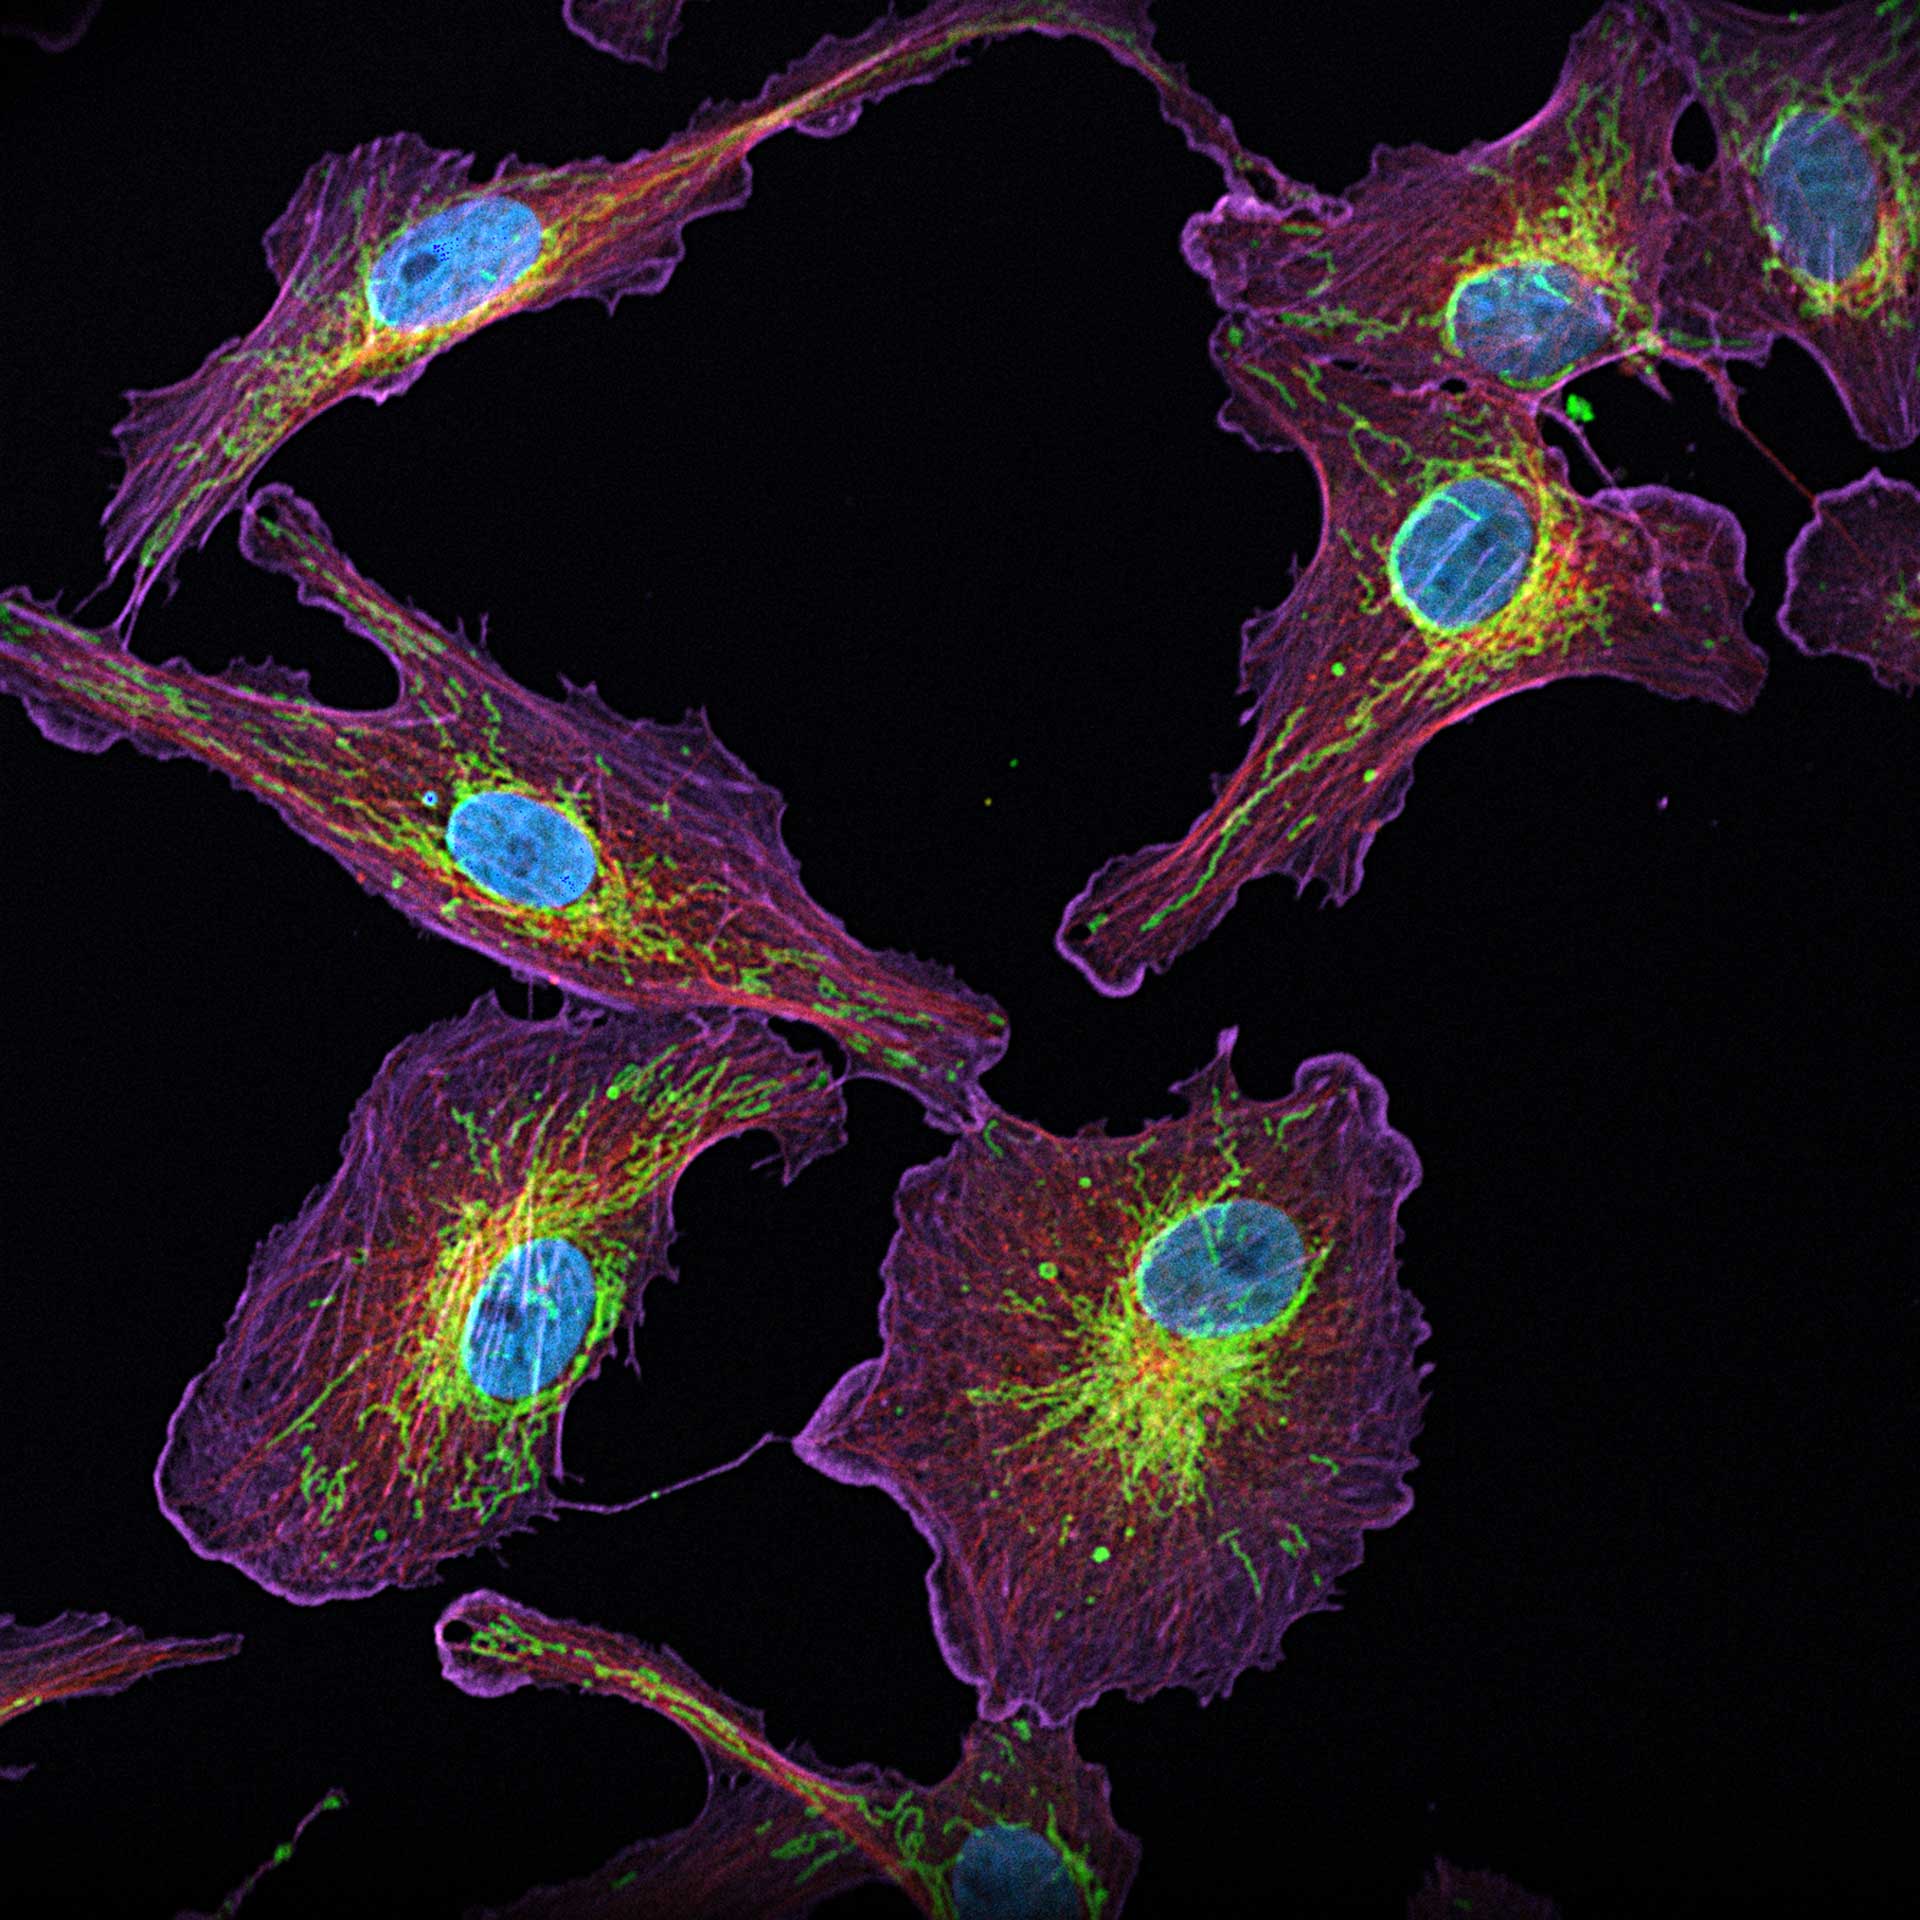
4-color confocal image of mammalian cells (DAPI, Phalloidin, Tubulin, Tom20).
Modules:
Description
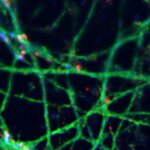
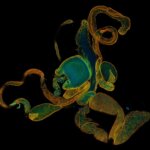
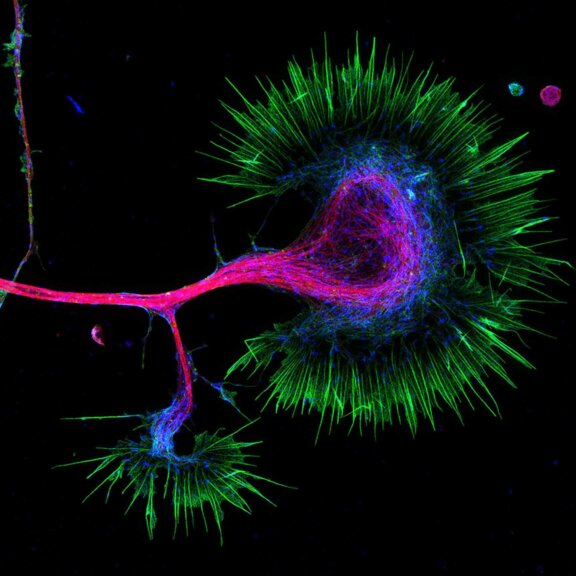
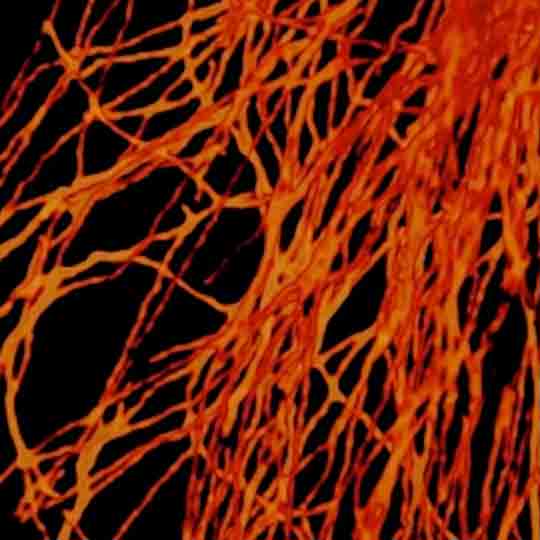
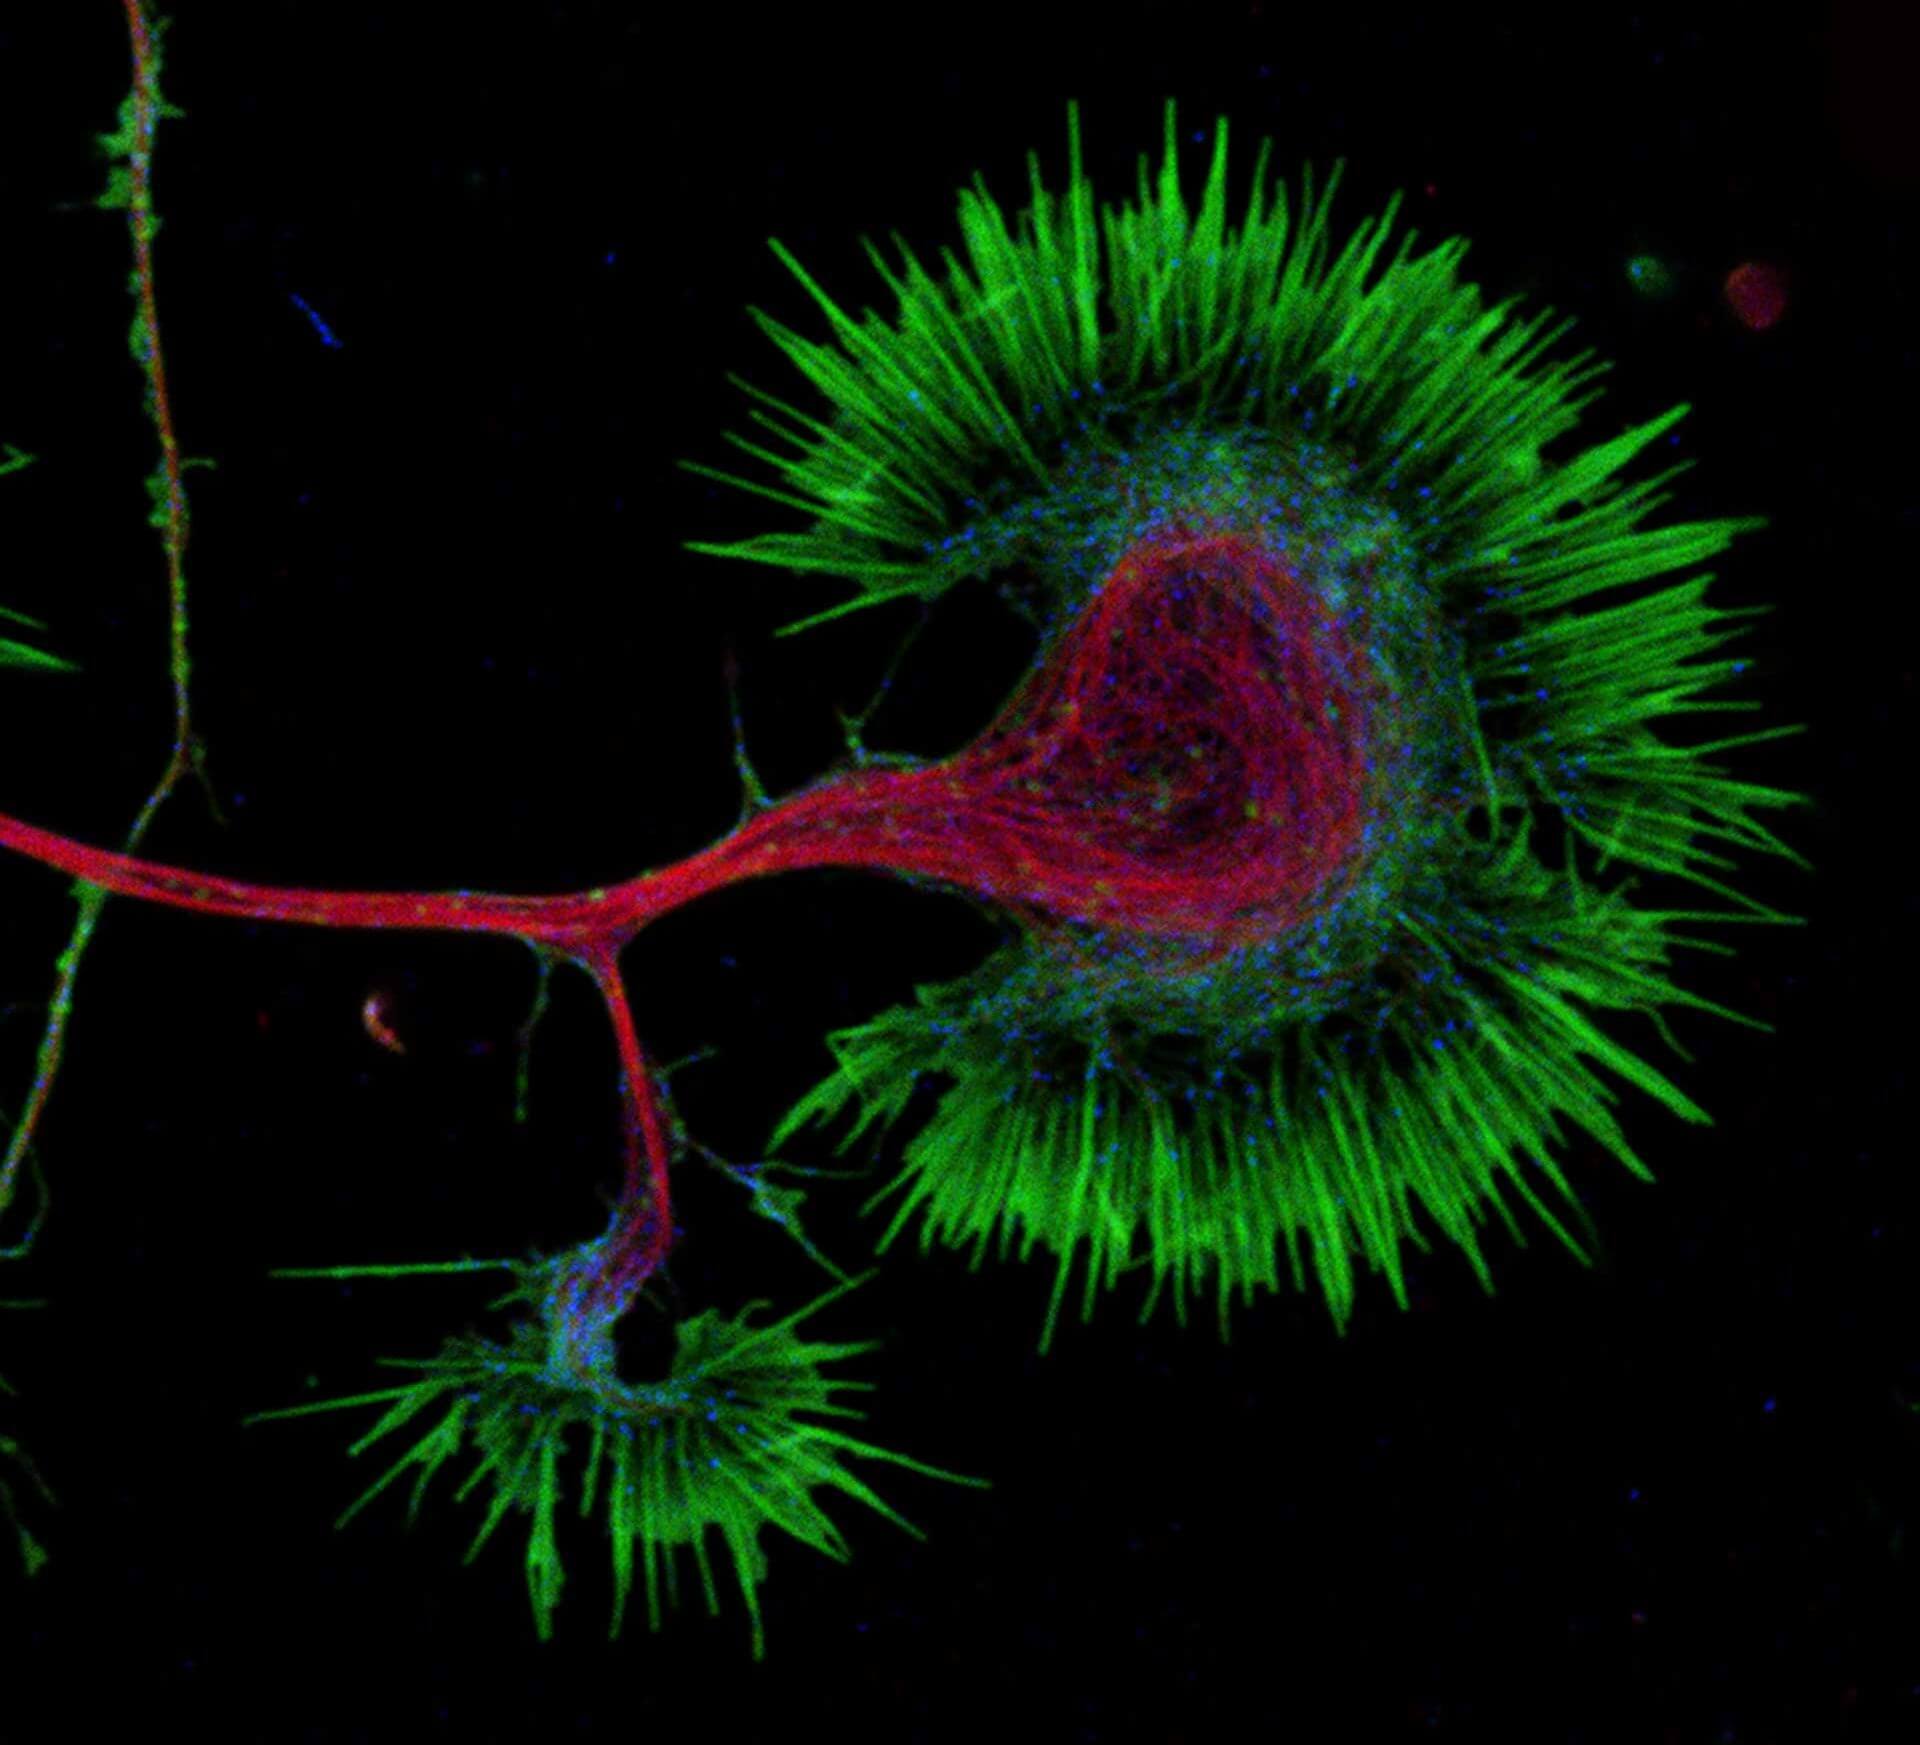
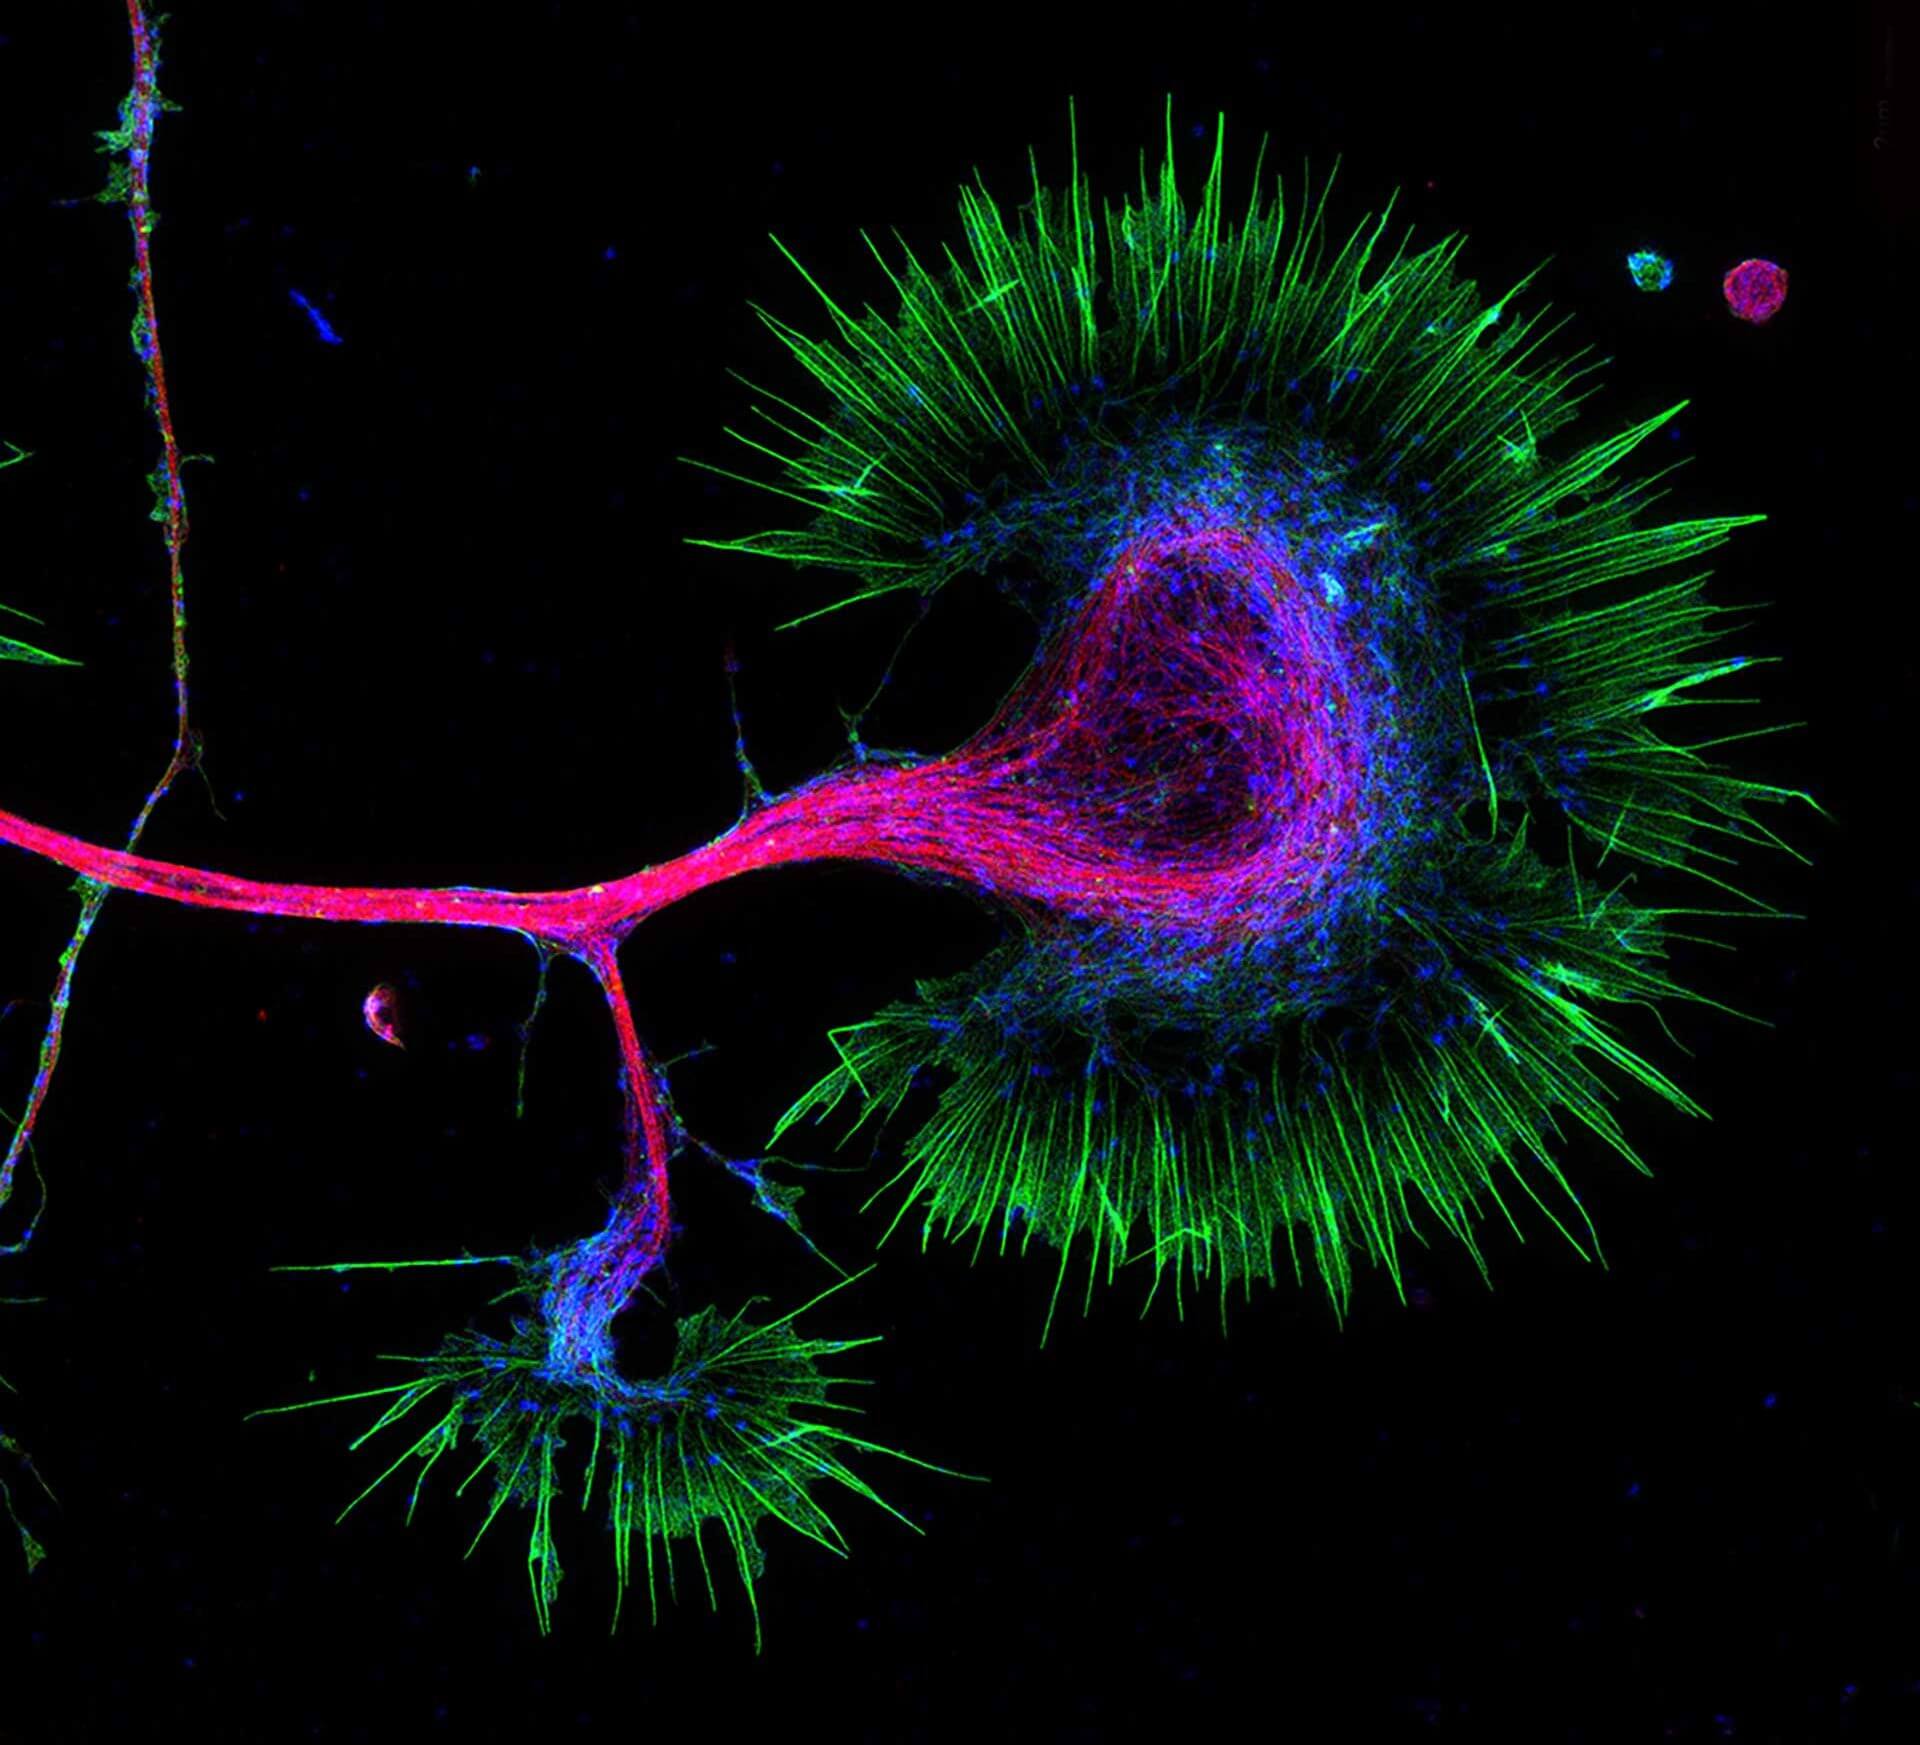
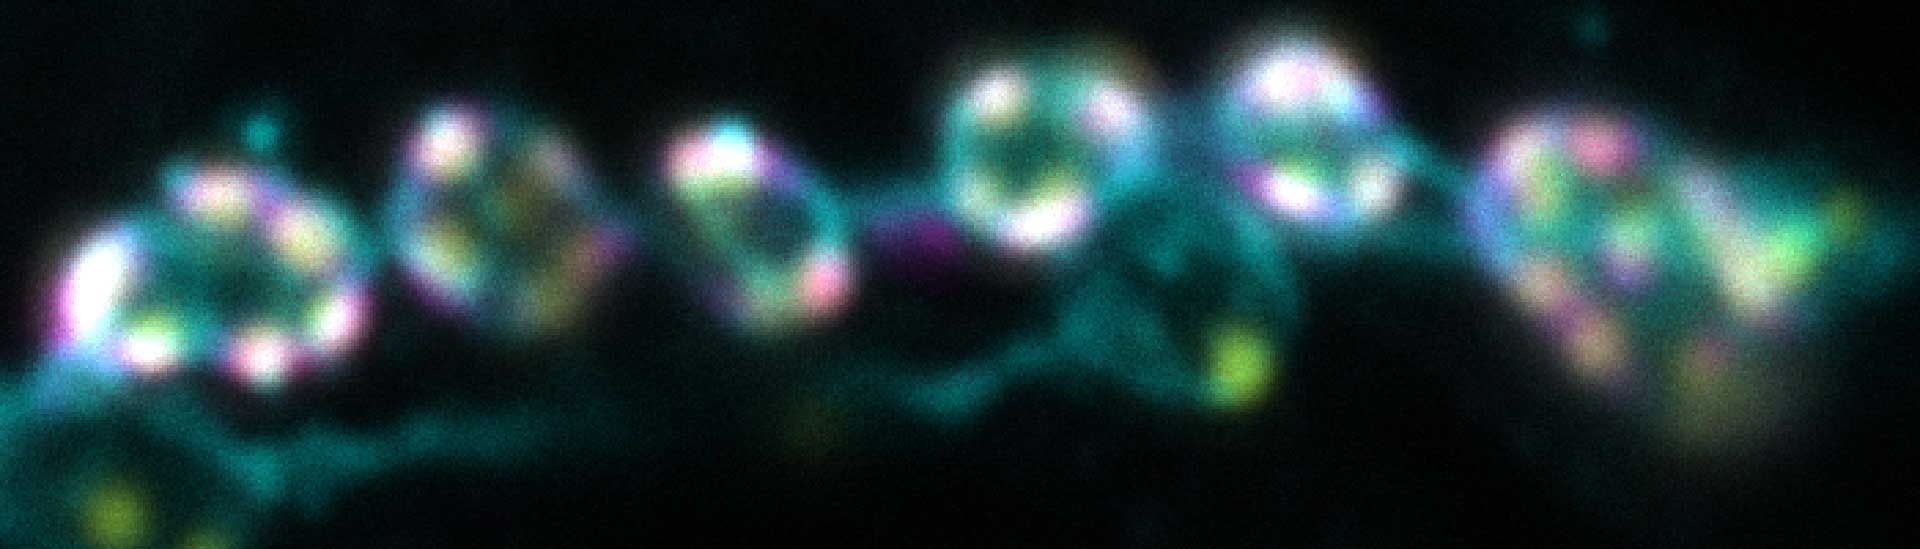
Growth cone at the tip of the axon of a primary hippocampal neuron at 1 day in vitro. Microtubules (Tuj1, abberior STAR 580, red) are bundled in the central-domain suggesting a pausing state. The molecular motor myosin IIB (confocal, Alexa488, blue) is enriched at the transition-zone, along the F-actin arcs. In the peripheral domain actin forms bundles in the filopodia (Phalloidin, abberior STAR 635, green). Sample courtesy: Elisa D'Este, Max Planck Institute for Biophysical Chemistry, Göttingen, Germany.
Description
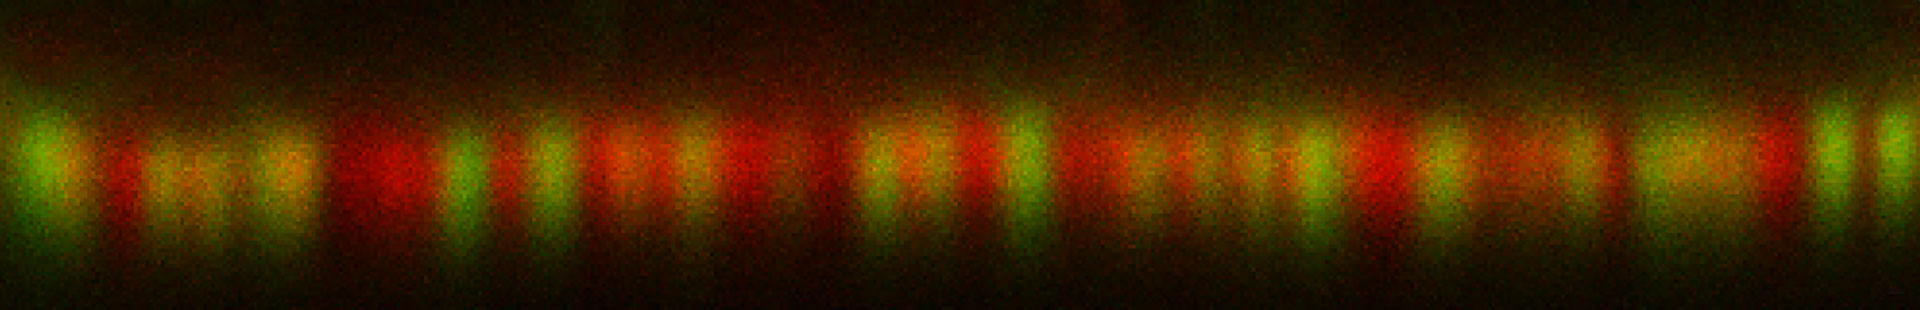
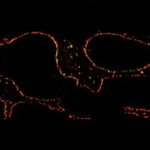
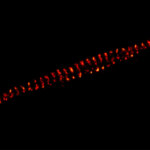
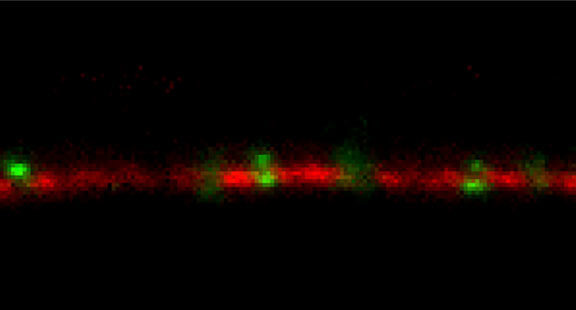
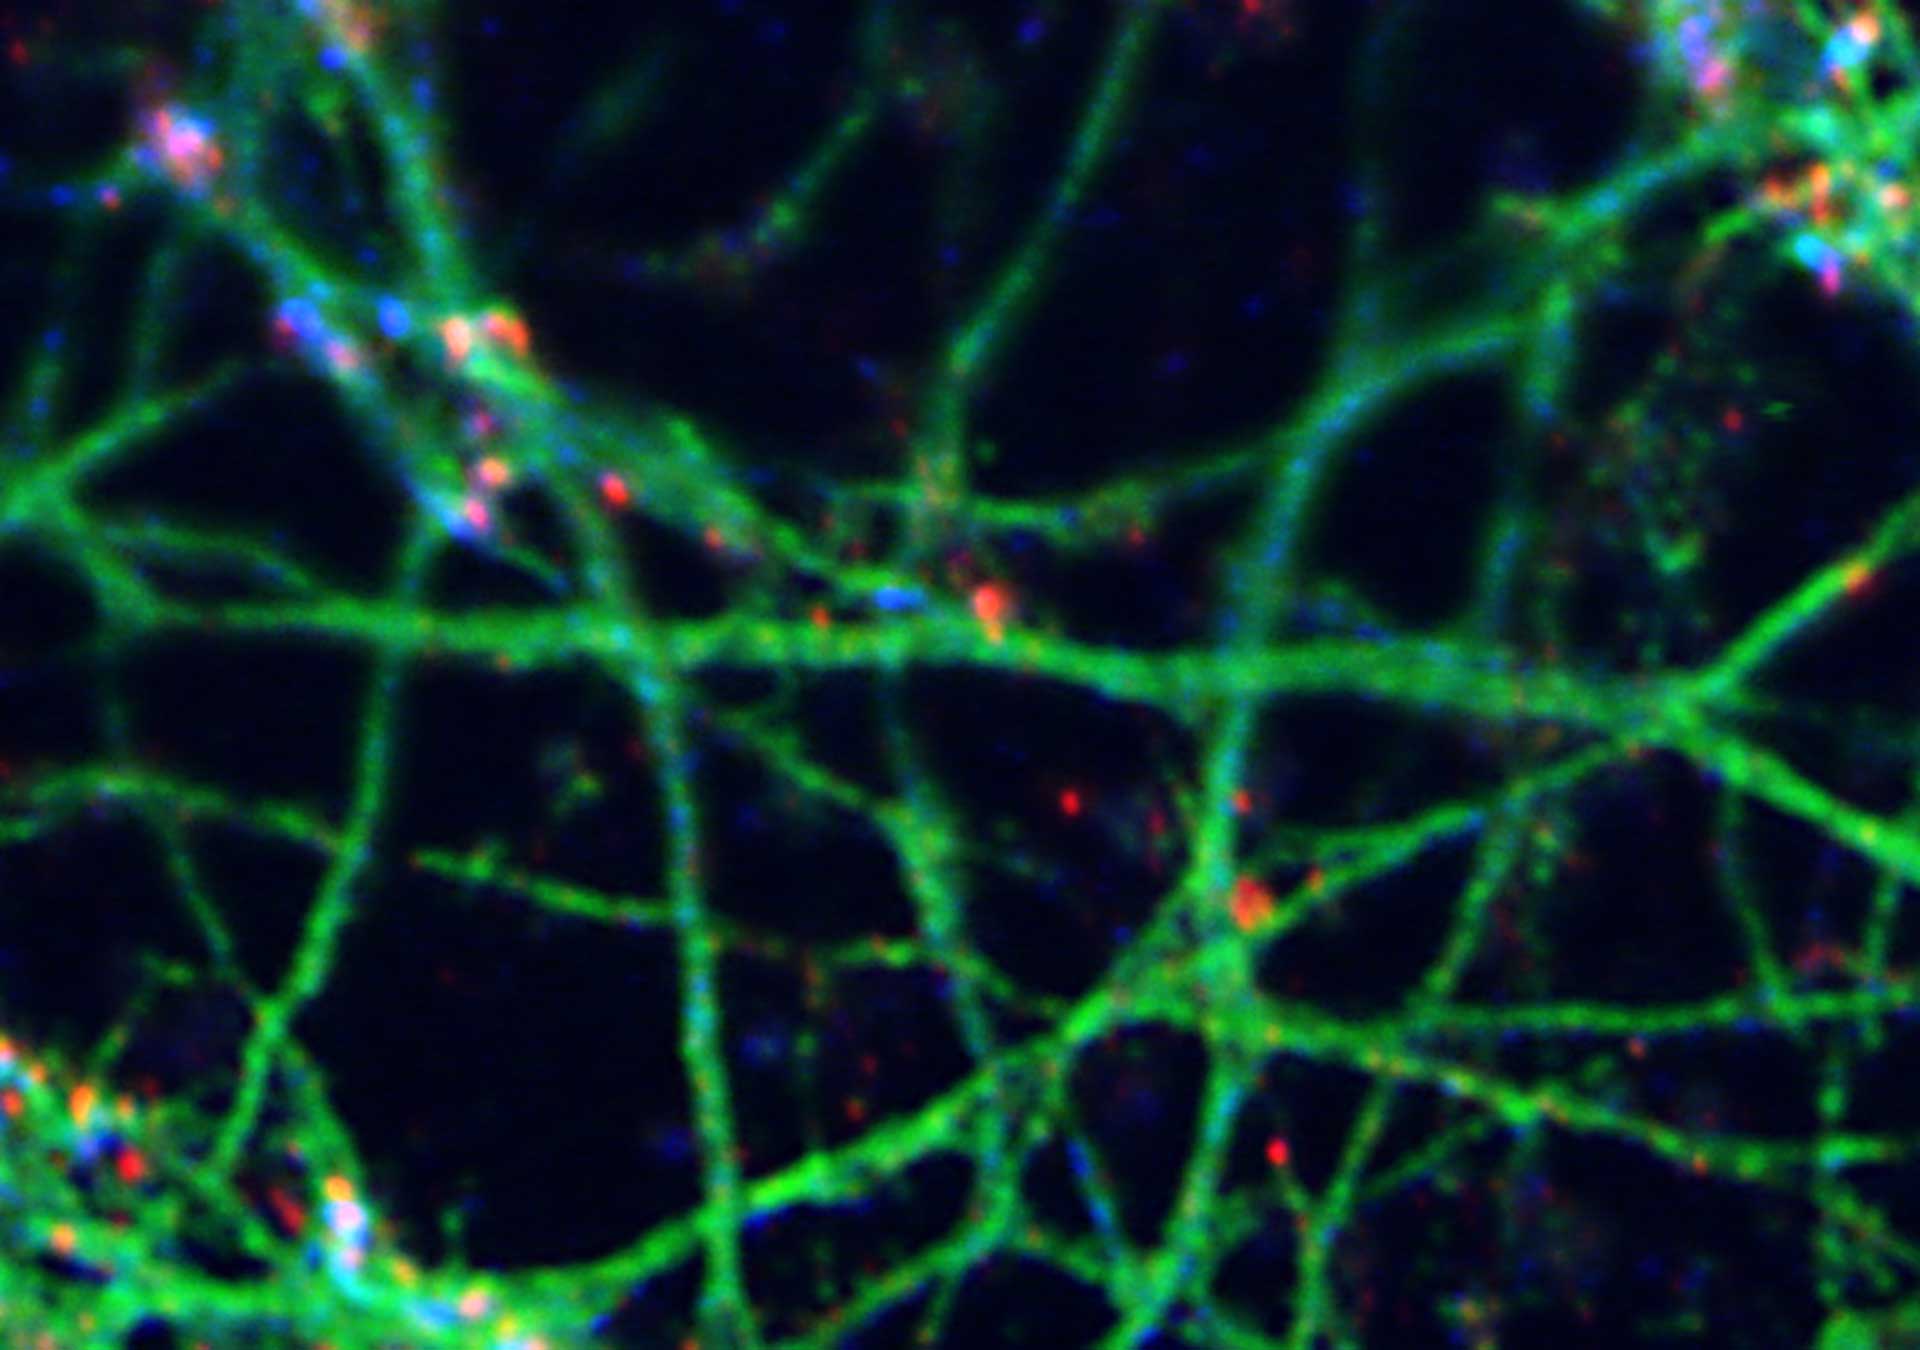
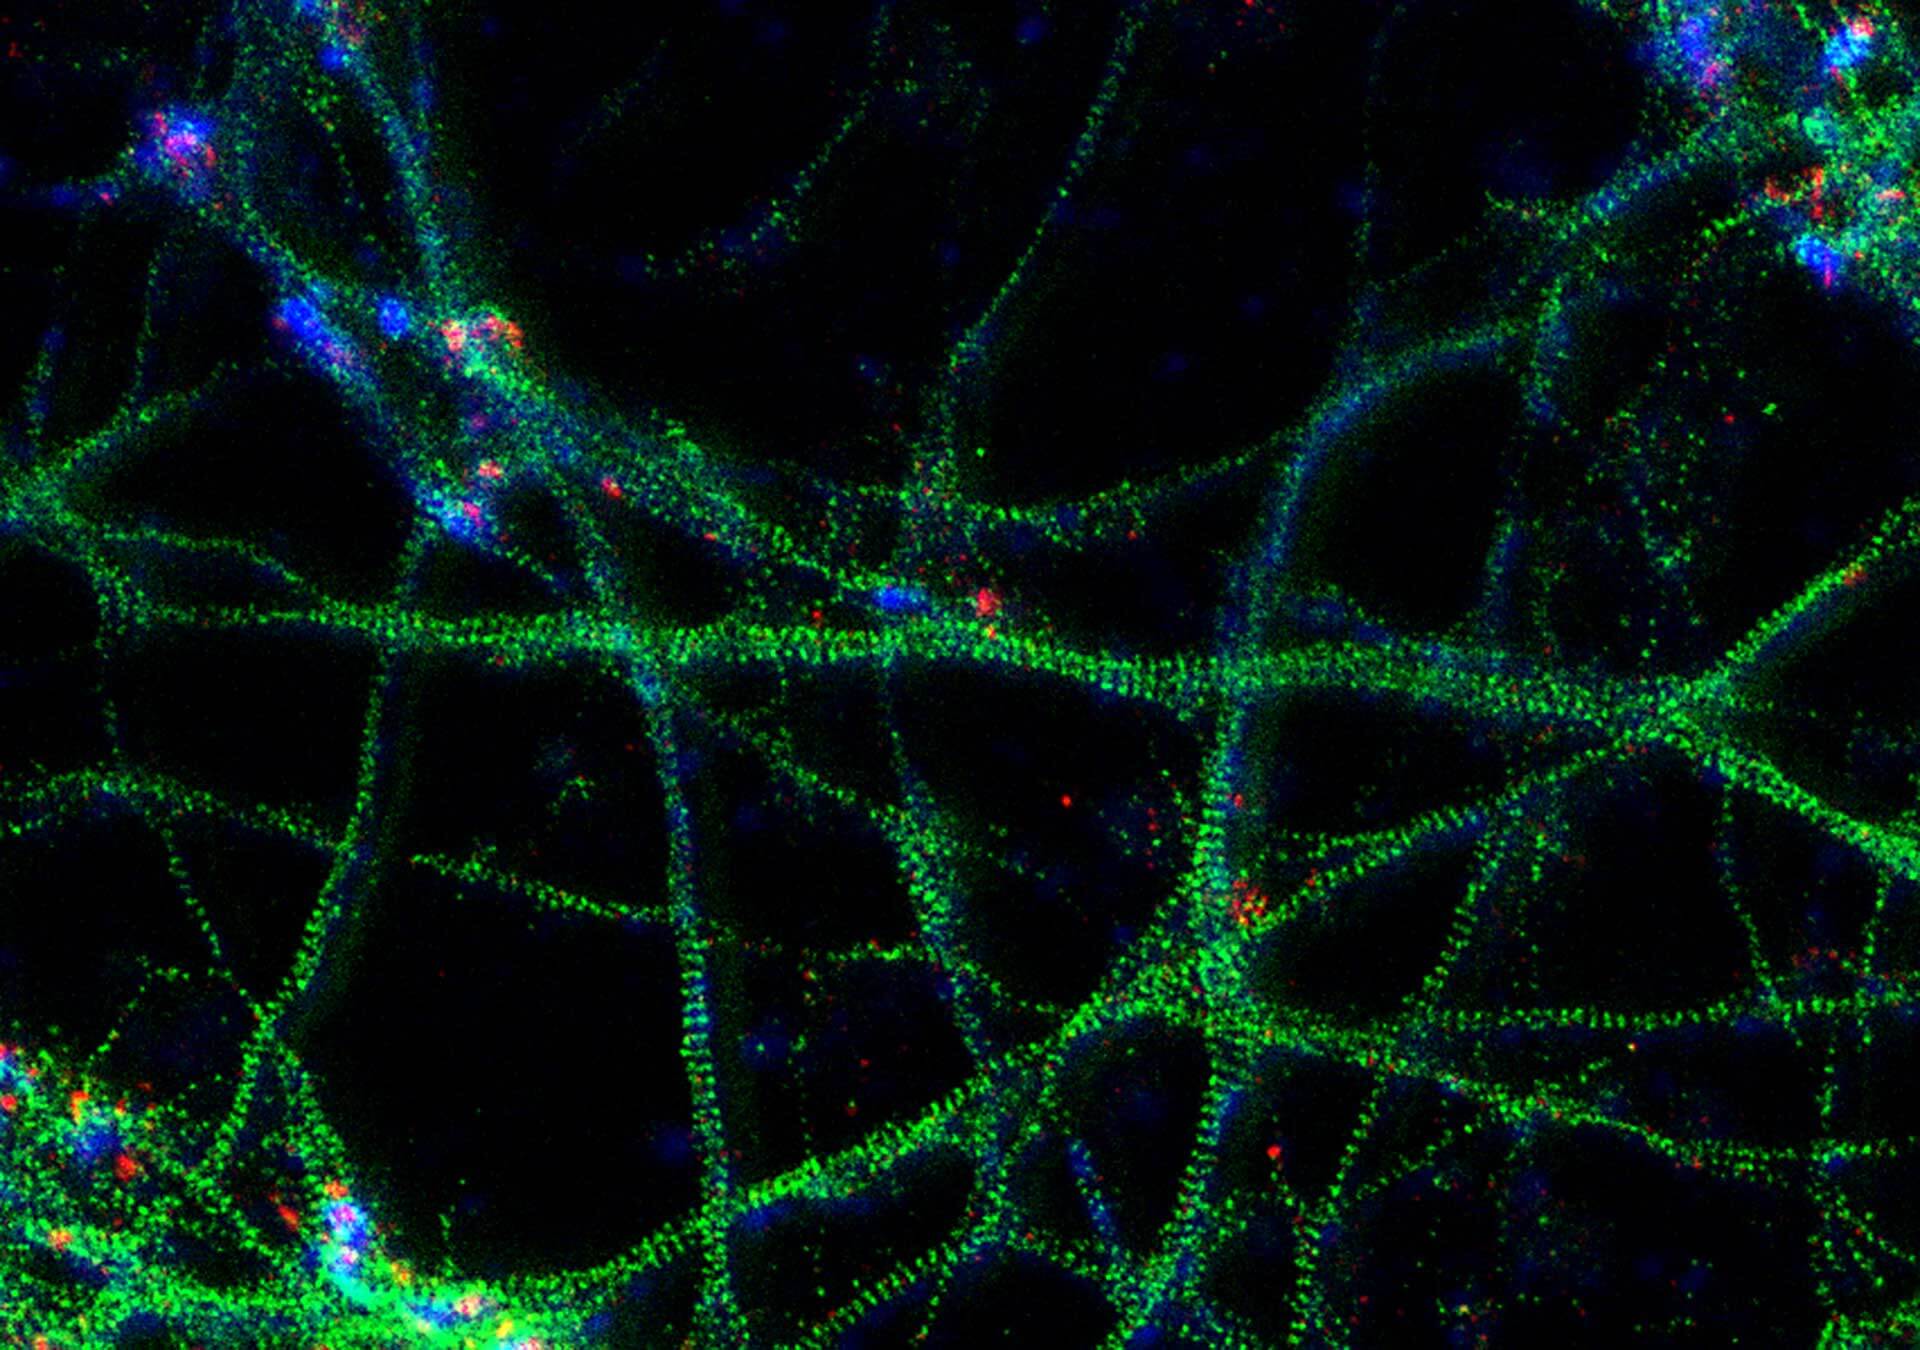
3-color STED image of primary hippocampal neurons. Please note the characteristic ~190 nm beta II spectrin periodicity along distal axons (green) which is only visible in the STED image. Labelled structures: beta II spectrin (green, abberior STAR 635P), Bassoon (red, abberior STAR 580), Actin cytoskeleton (blue, phalloidin, Oregon Green 488). Imaged with abberior Expert Line with 595nm and 775nm STED laser. Sample was prepared by Elisa D’Este @ MPIBPC, Göttingen.
Modules:
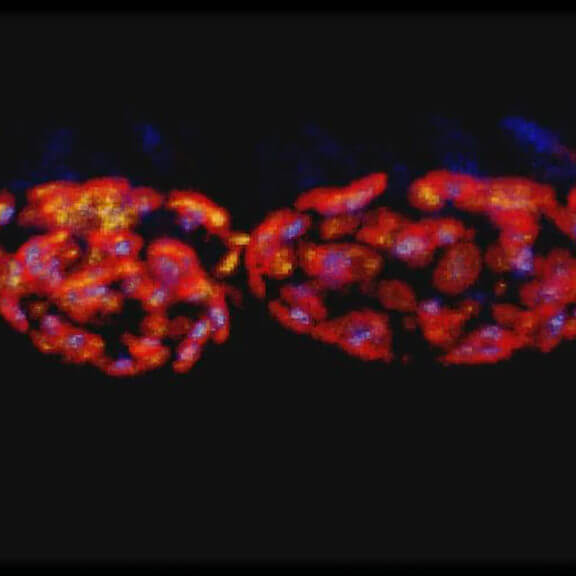
Description
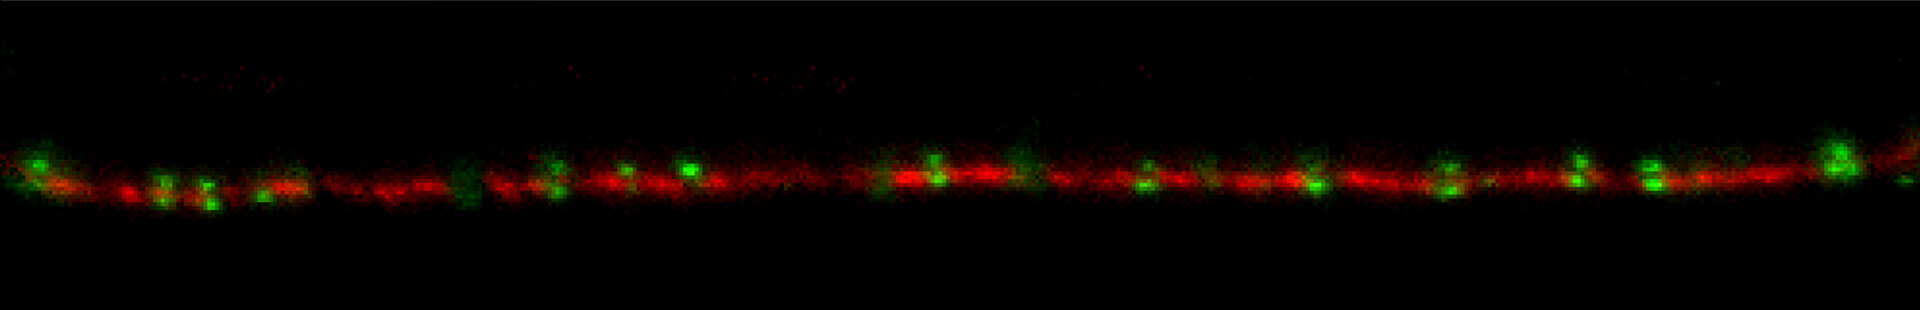
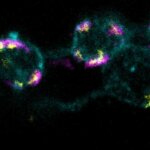
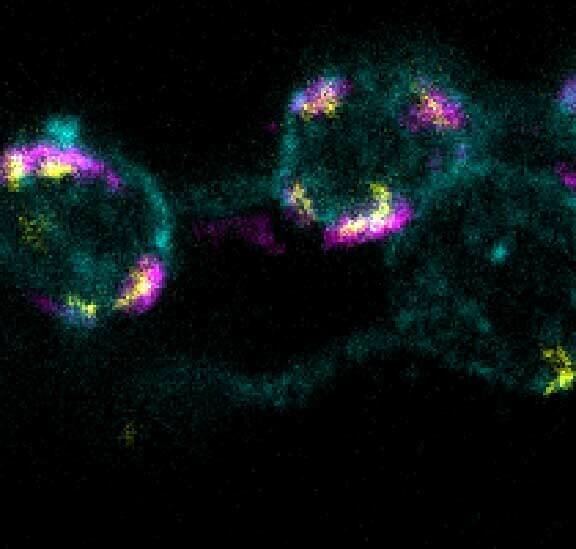
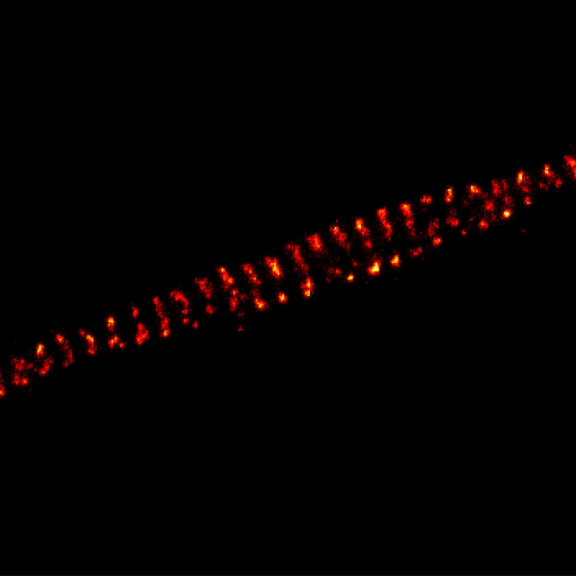
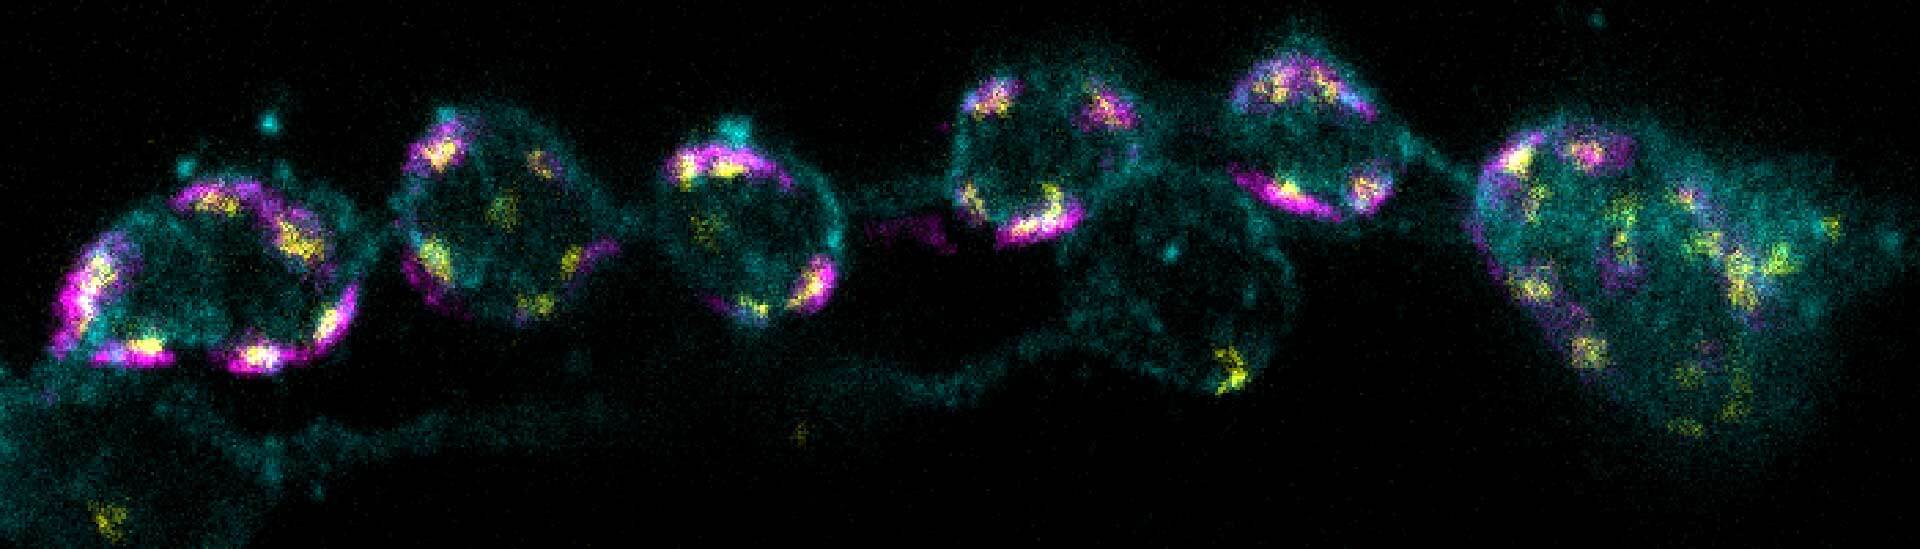
3-color STED imaging: active zones at the Drosophila larval neuromuscular junction immunostained for Bruchpilot and two other proteins.
Two superresolution channels (magenta, yellow) using a 775nm STED laser & one superresolution channel using a 595nm STED laser.
Samples by M. Lenz & M. Landgraf (University of Cambridge, UK).
Description
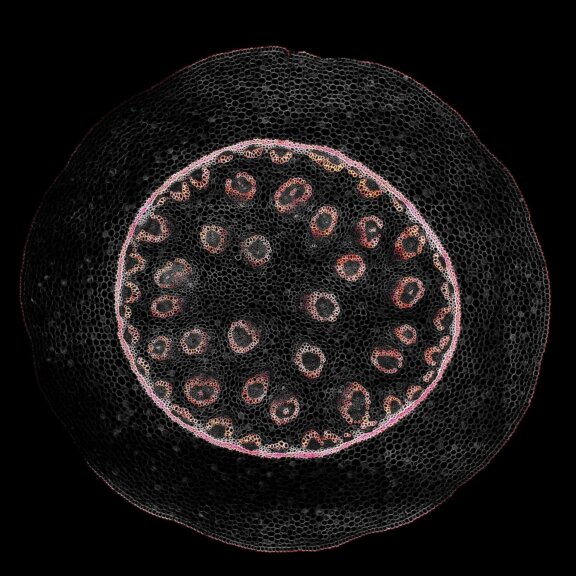
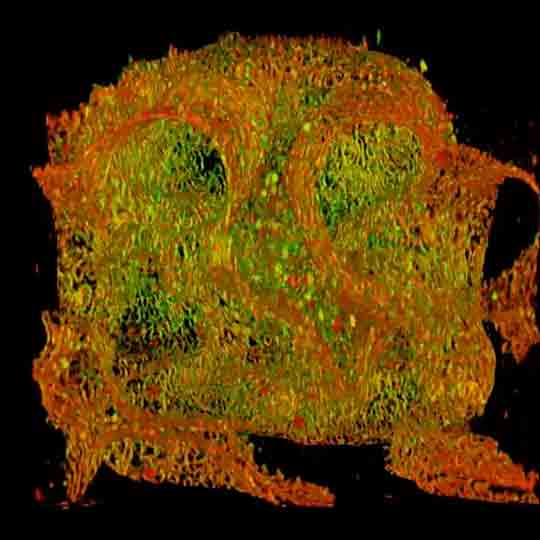
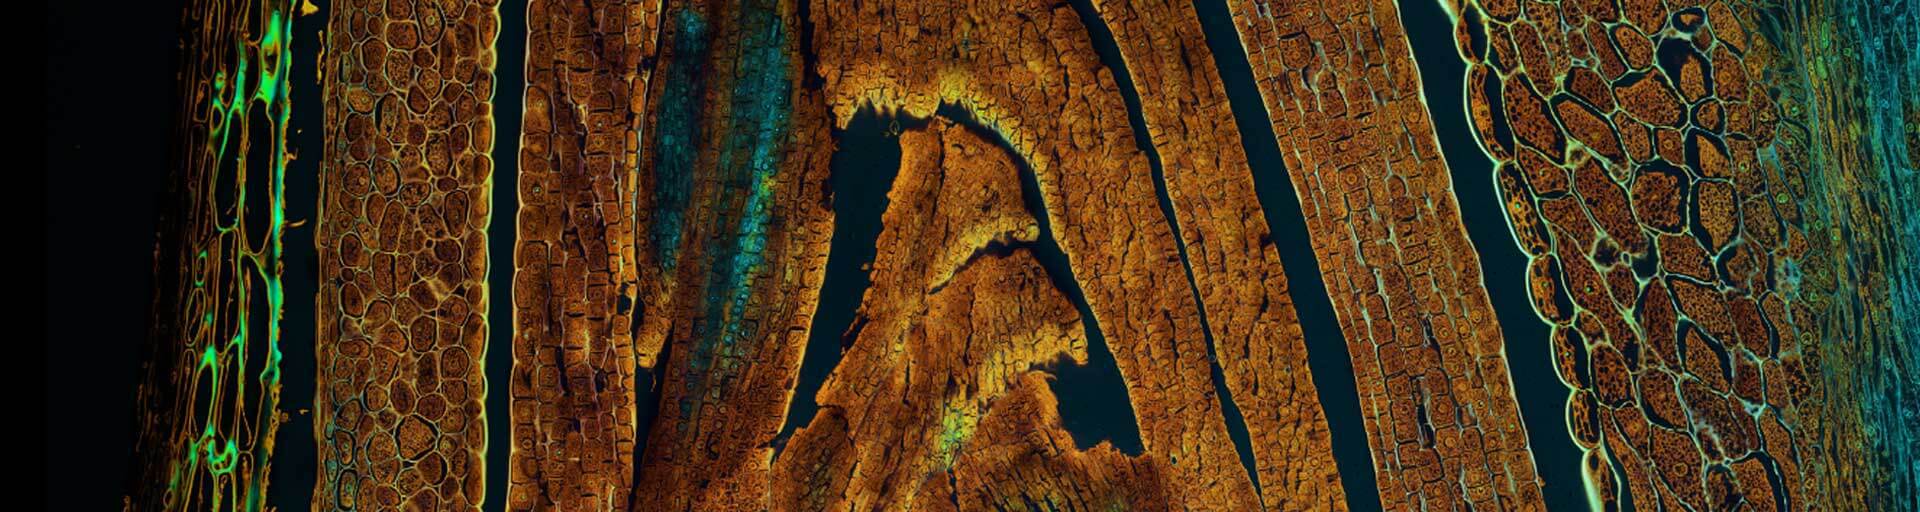
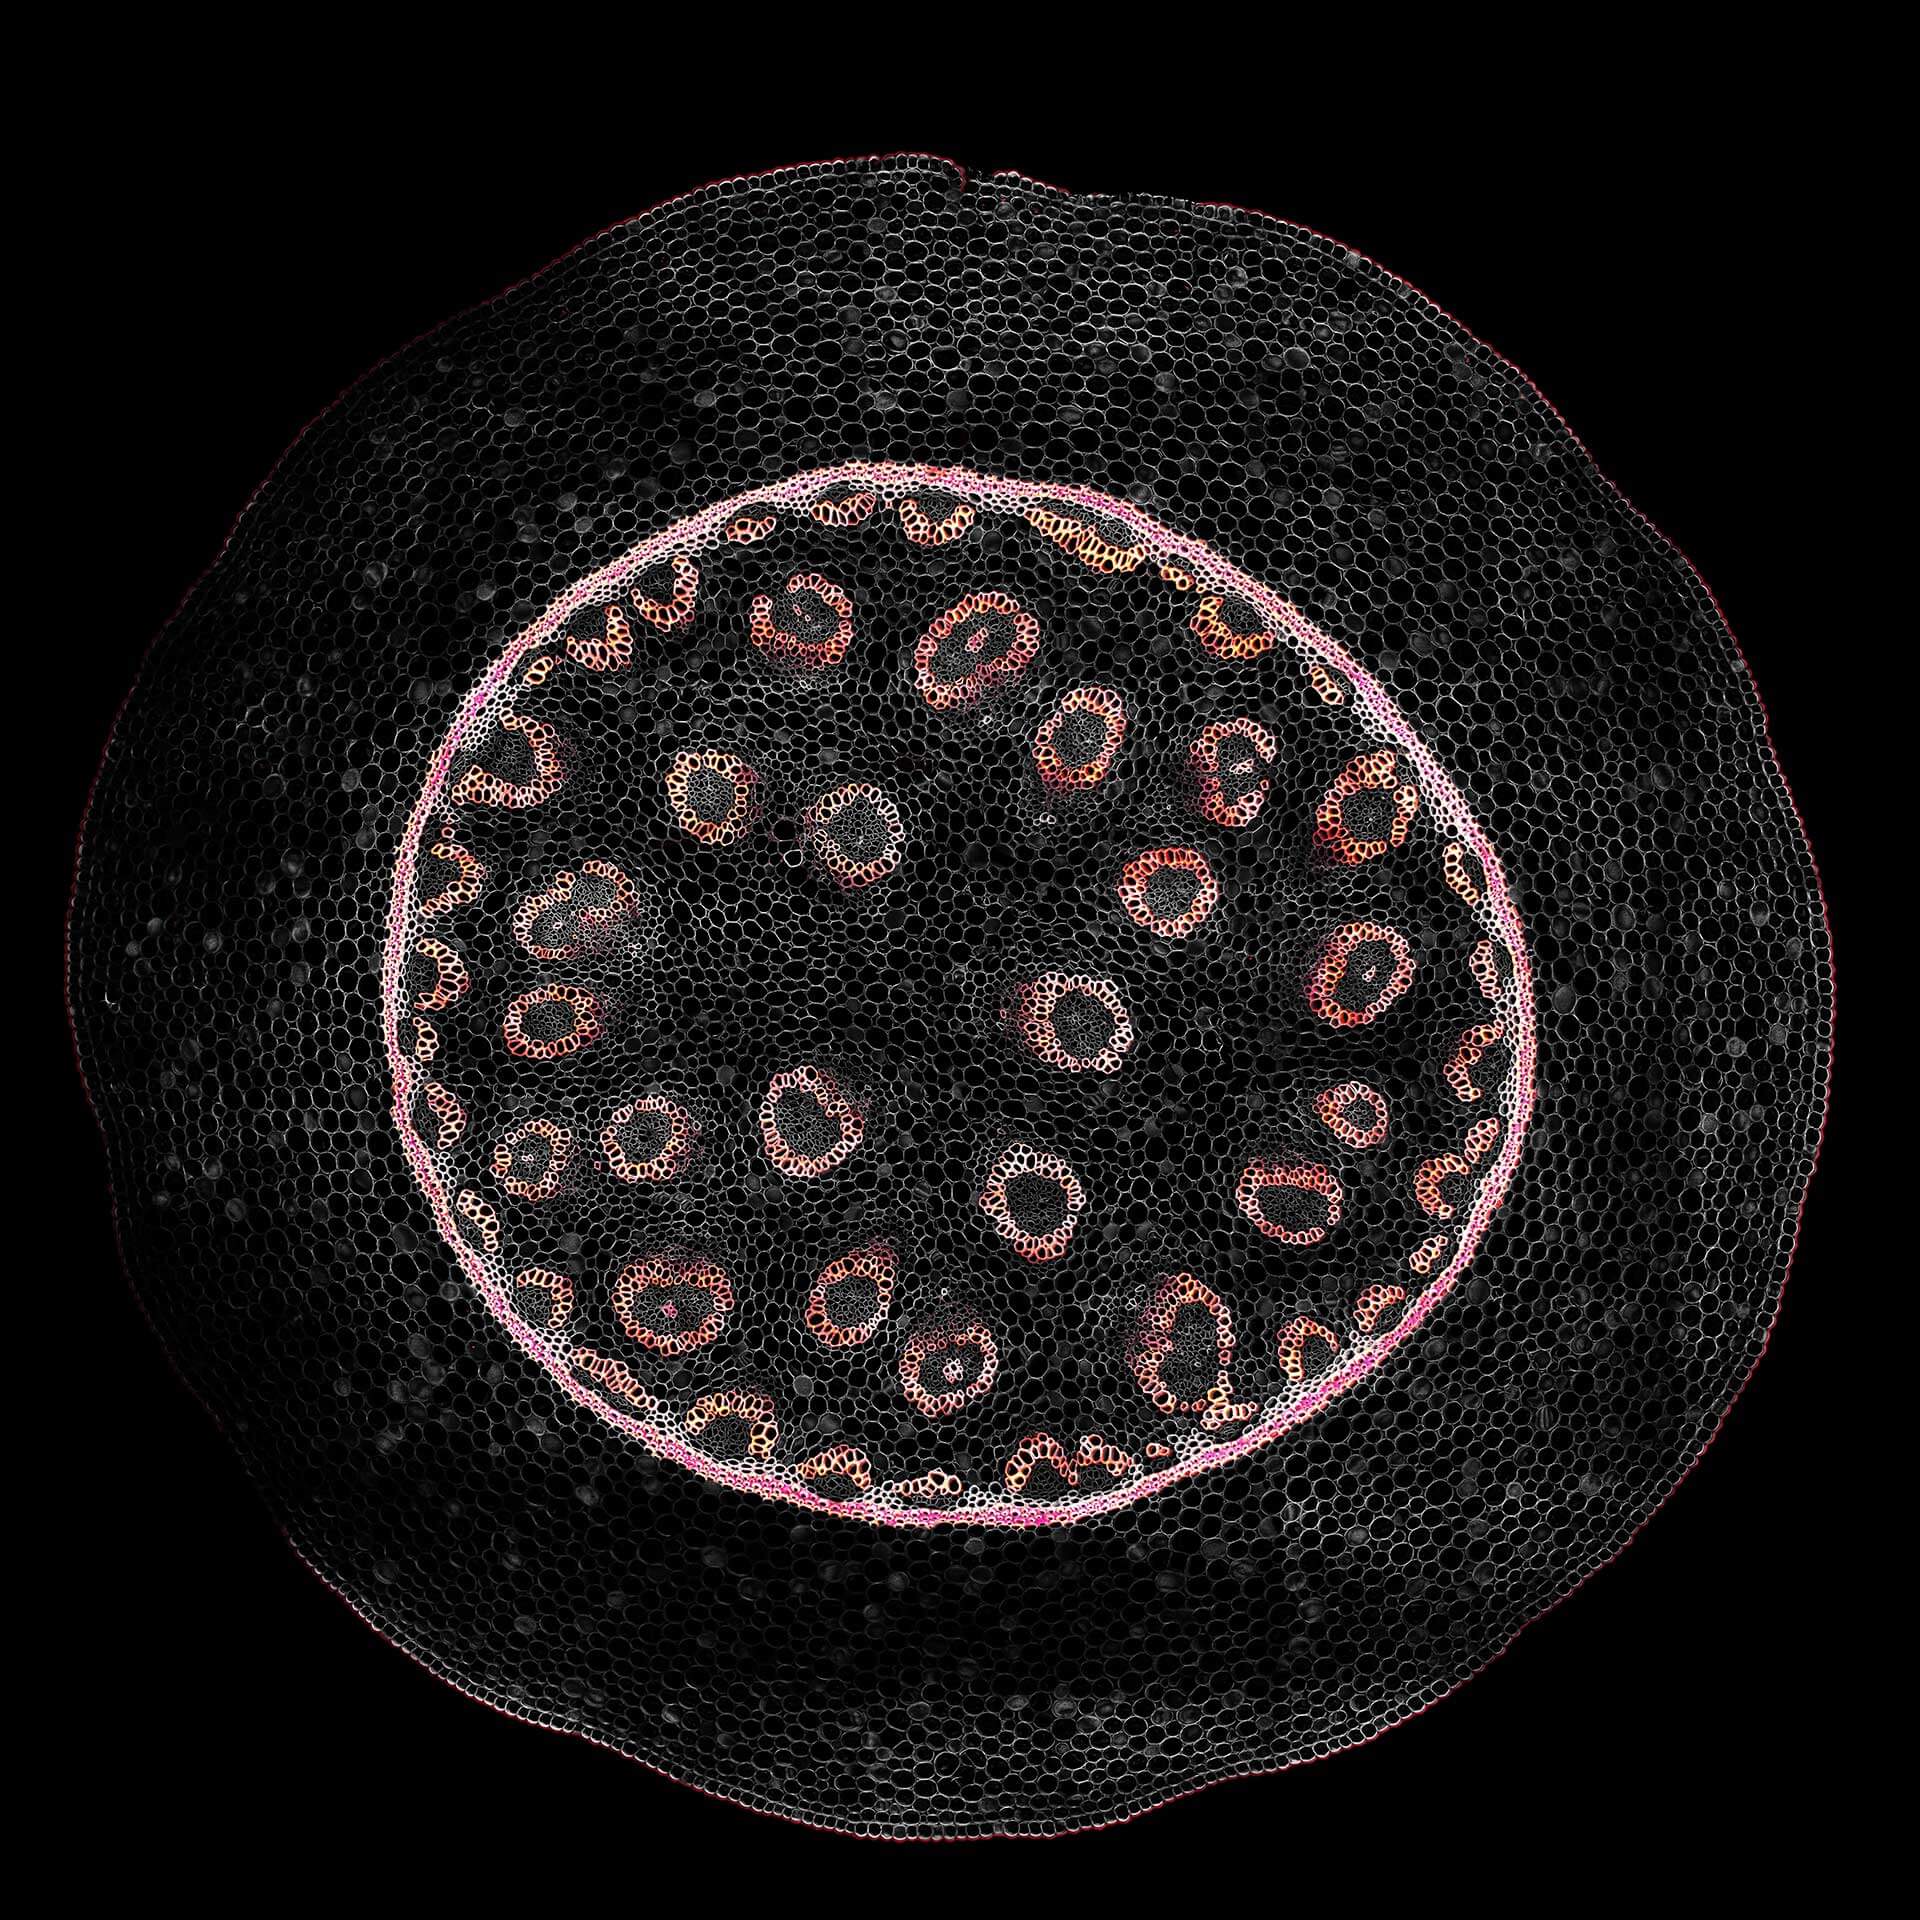
Confocal acquisition of Convallaria rhizome (cross-section) with a 20x oil objective; 3 channels, maximum intensity projection. The image consists of 14 z-planes in 9 by 9 tile pattern comprising a total area of 3.2 mm x 3.2 mm, stitched using SVI Huygens. Shown is a maximum intensity projection.
Description
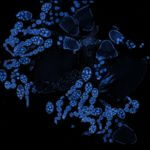
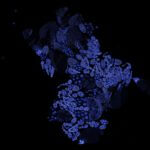
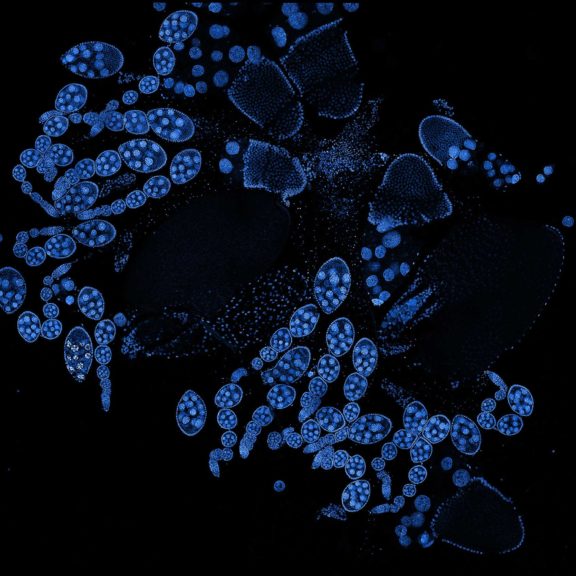
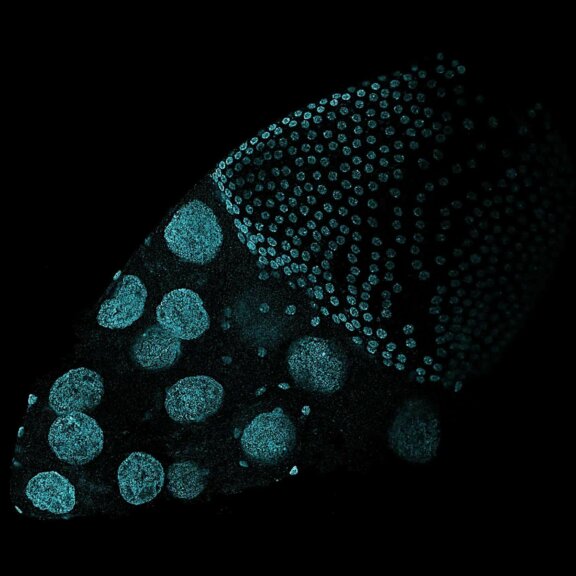
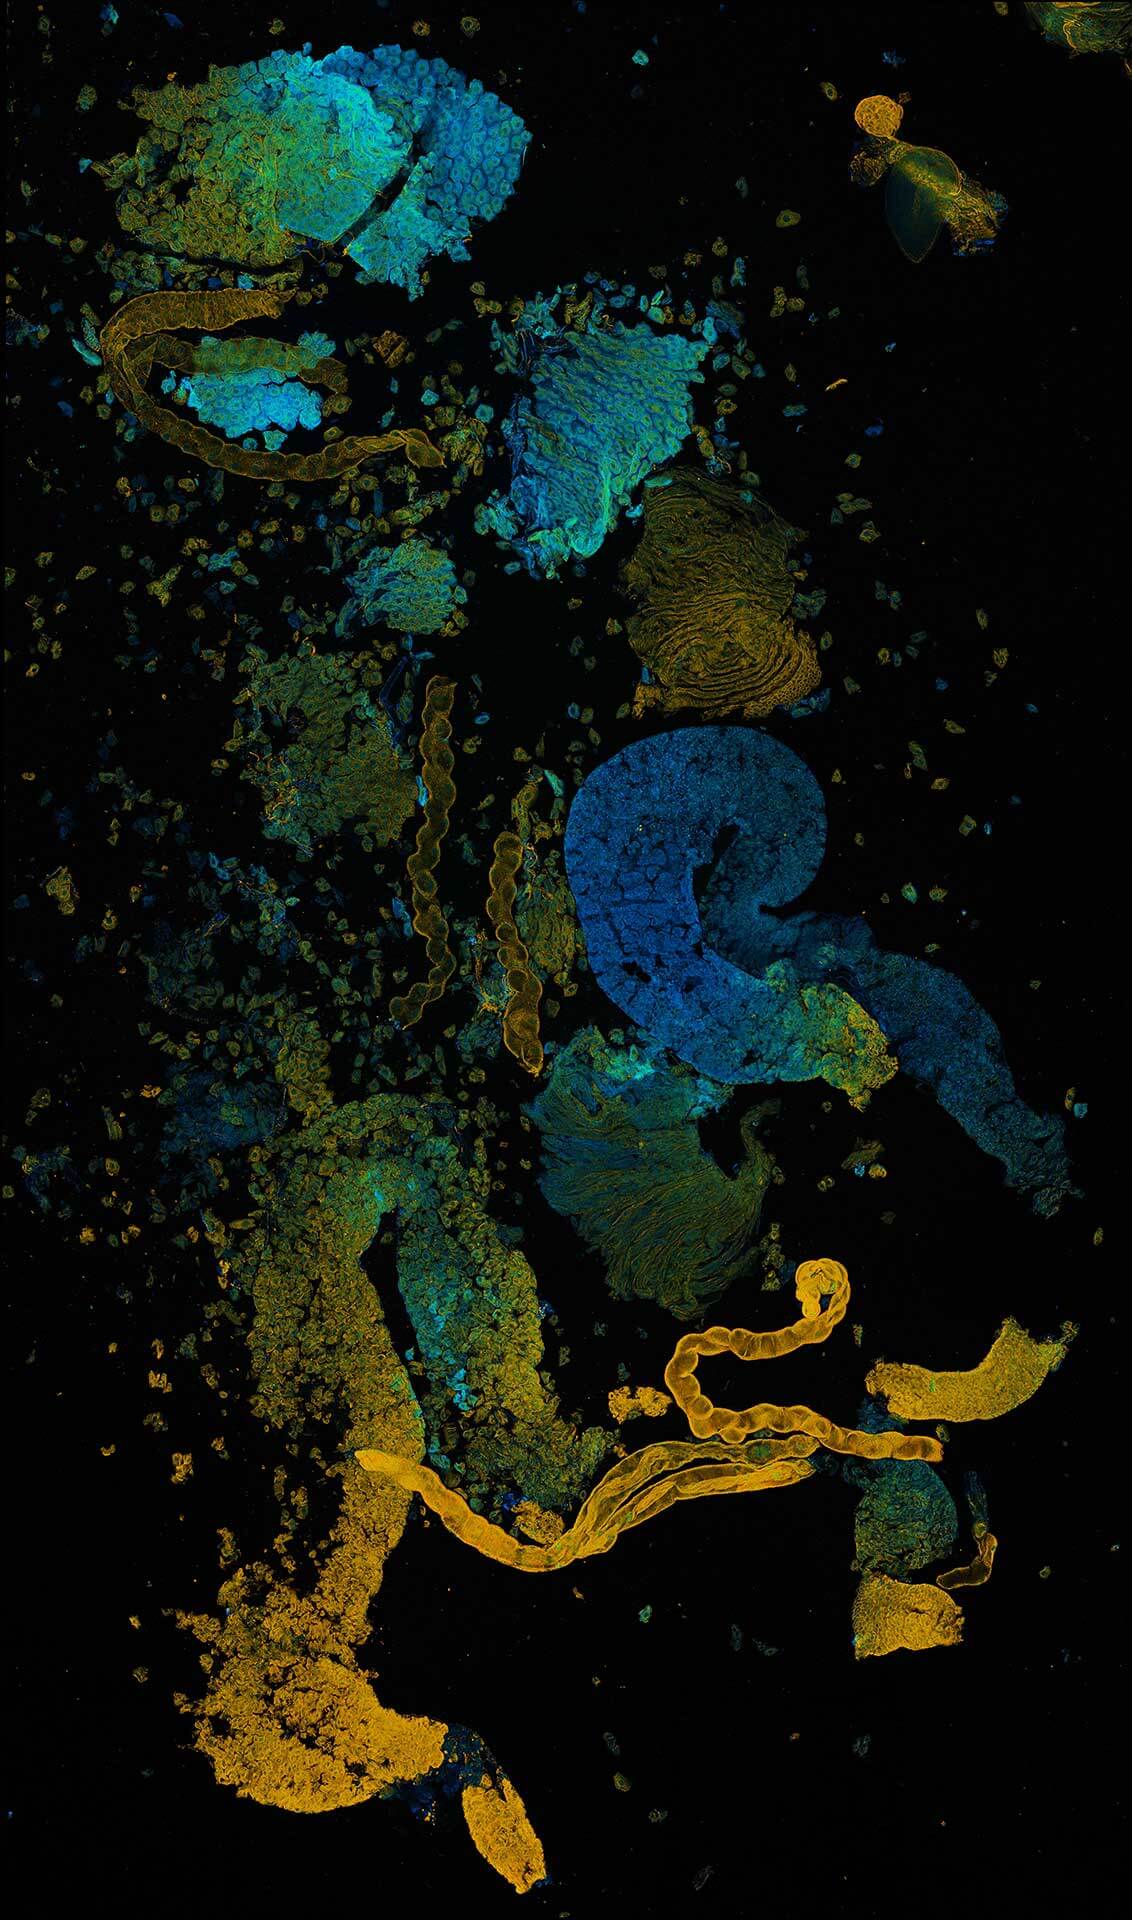
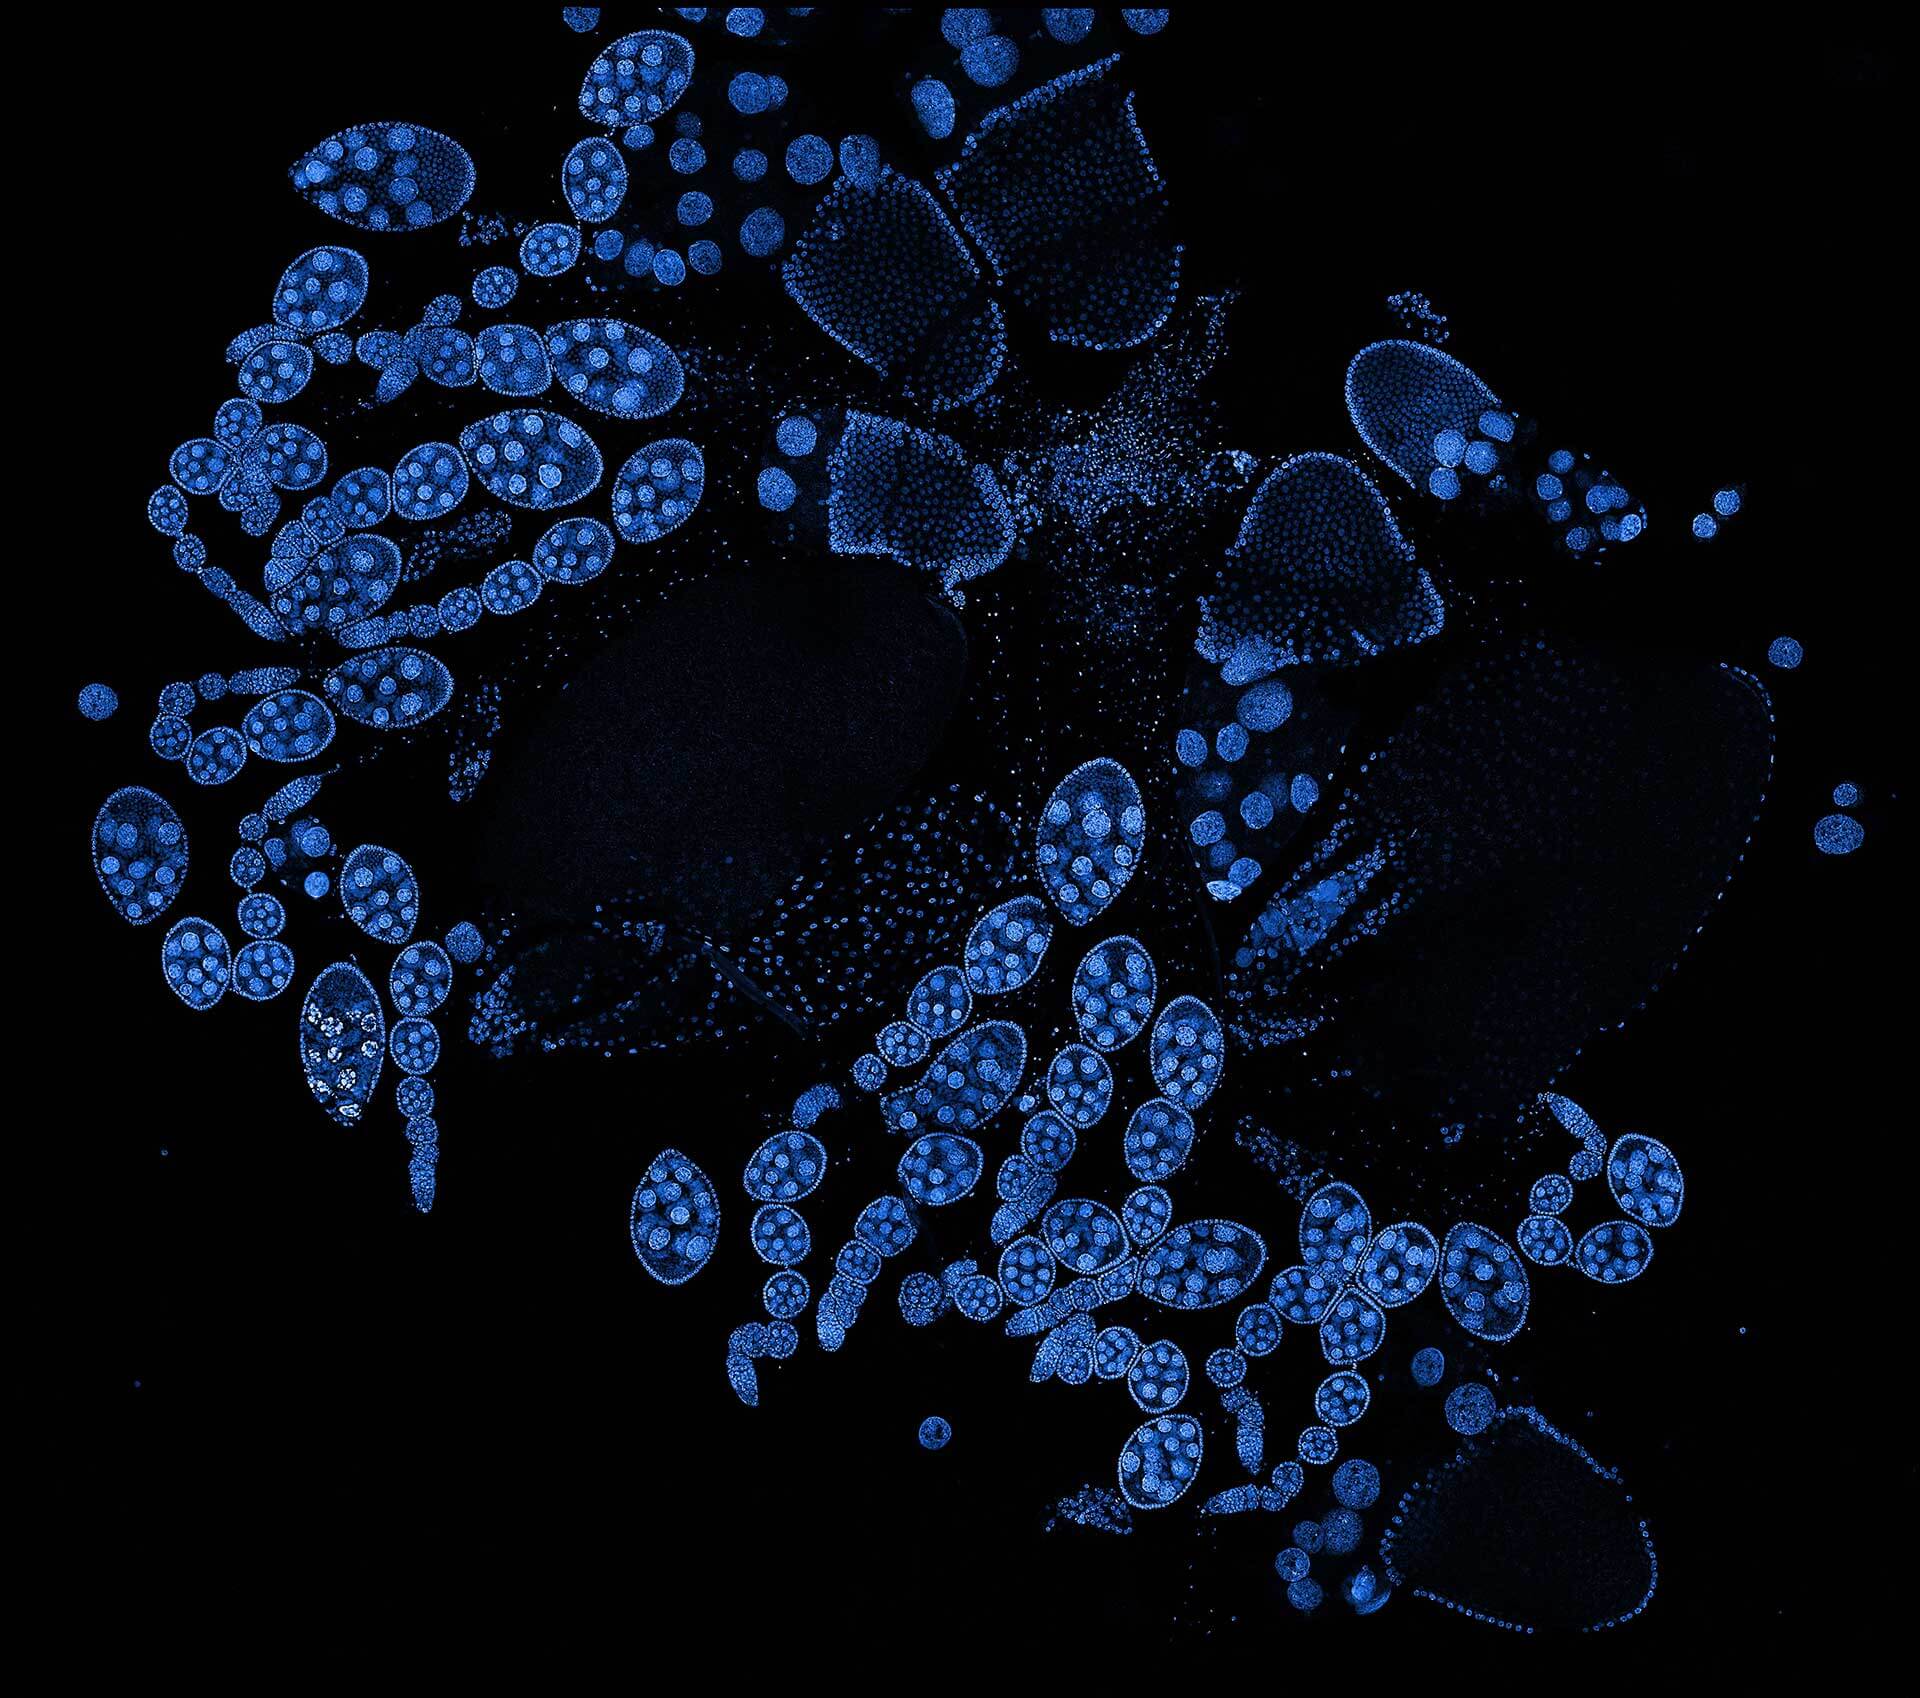
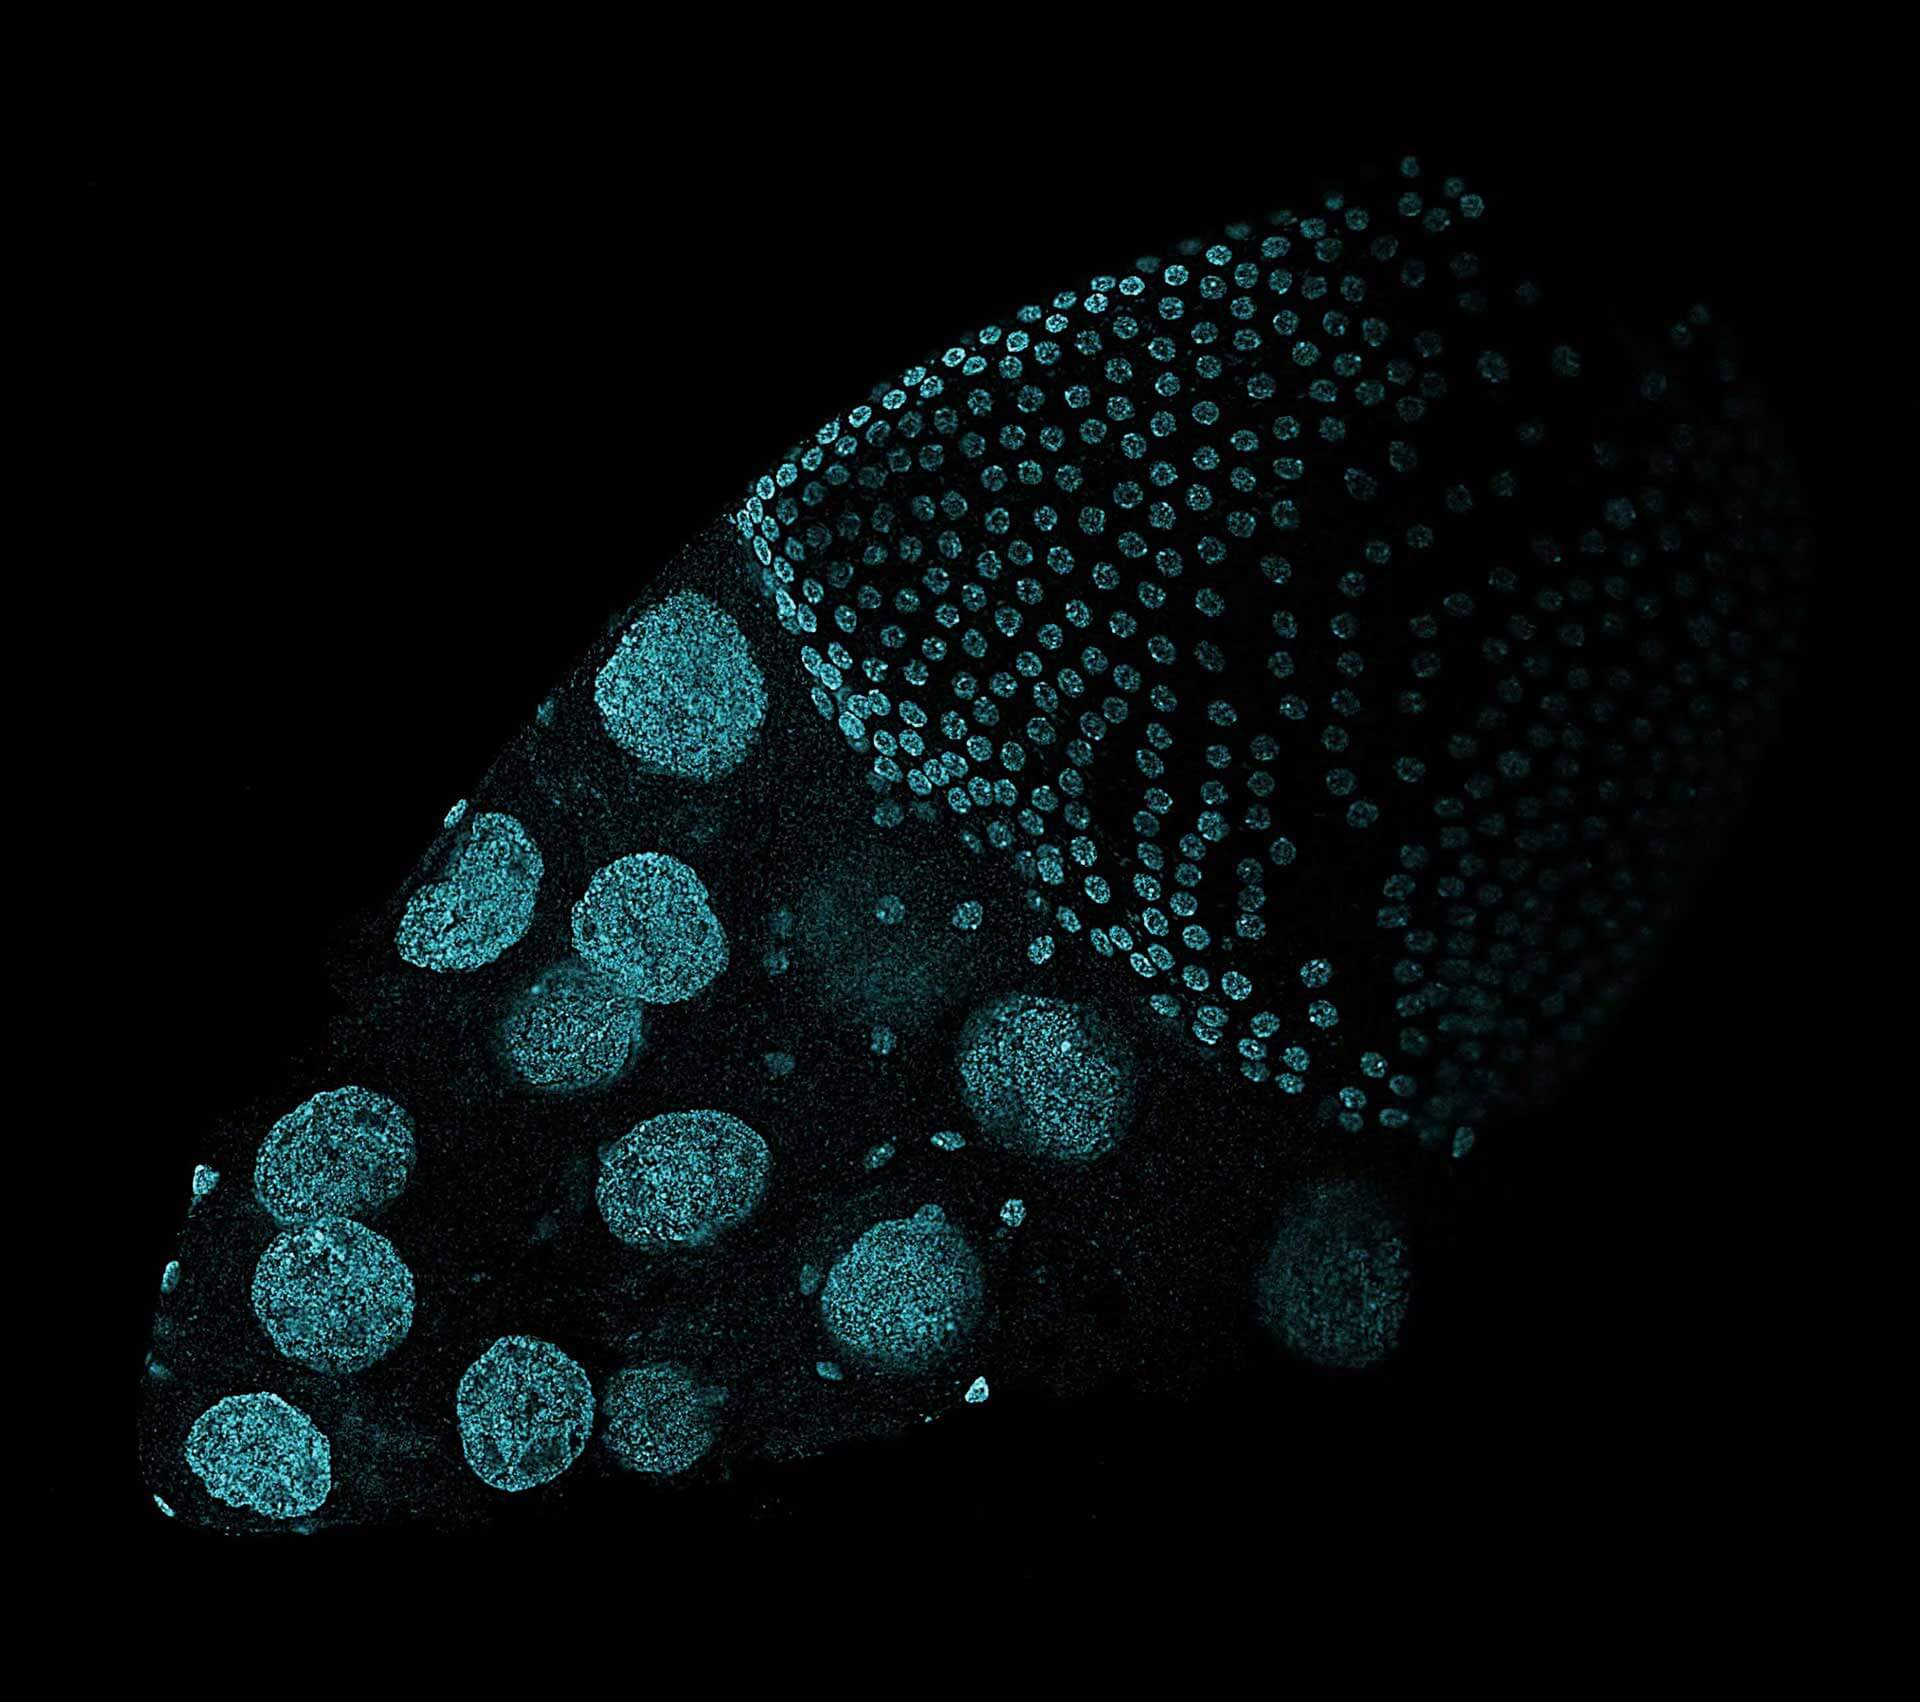
Drosophila ovariole stained with abberior LIVE 560 DNA showing nuclei in different cell types of the egg chamber. Ovaries were dissected from adult female fruit flies and were fixed prior to staining.
Image was acquired with the STEDYCON tiling feature and assembled with the SVI Huygens Stitcher.
Description
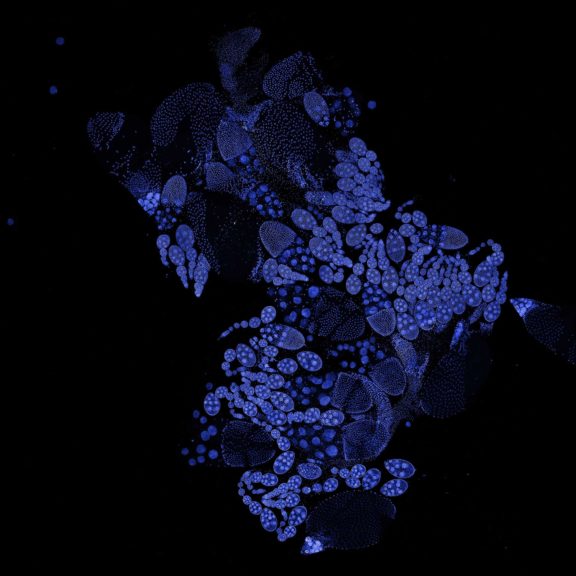
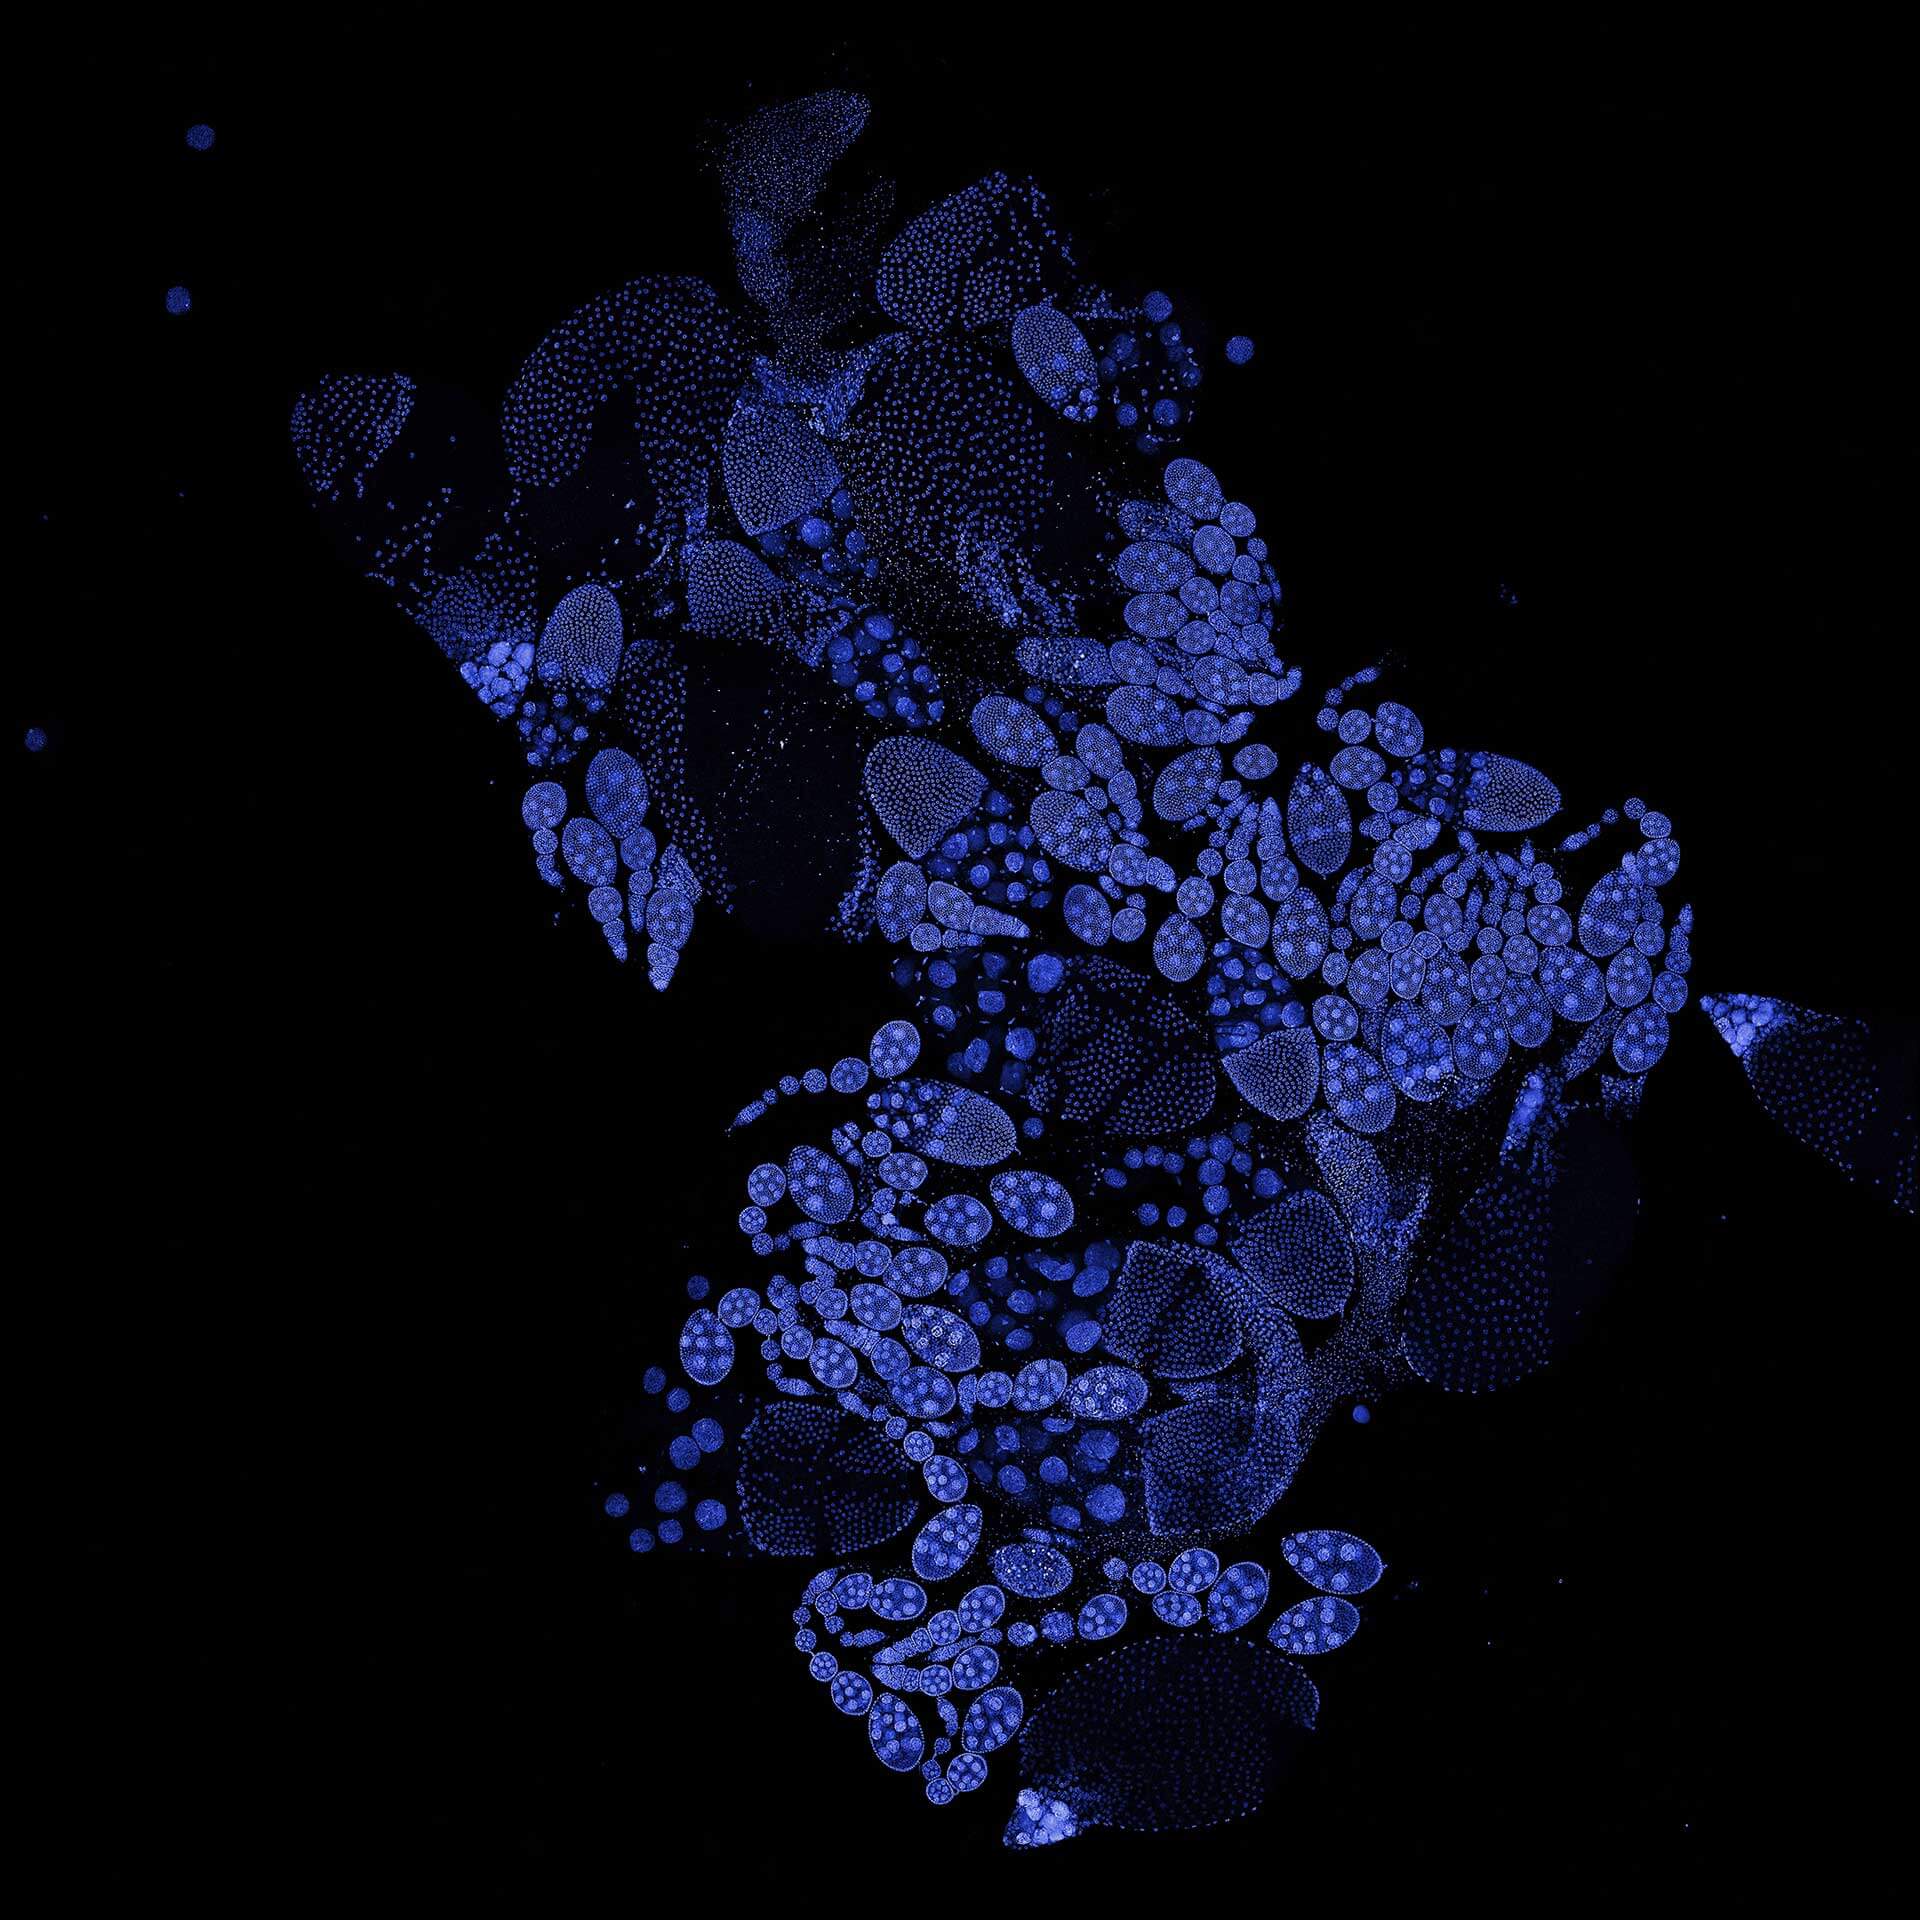
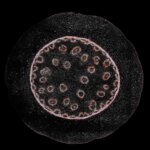
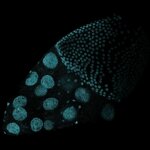
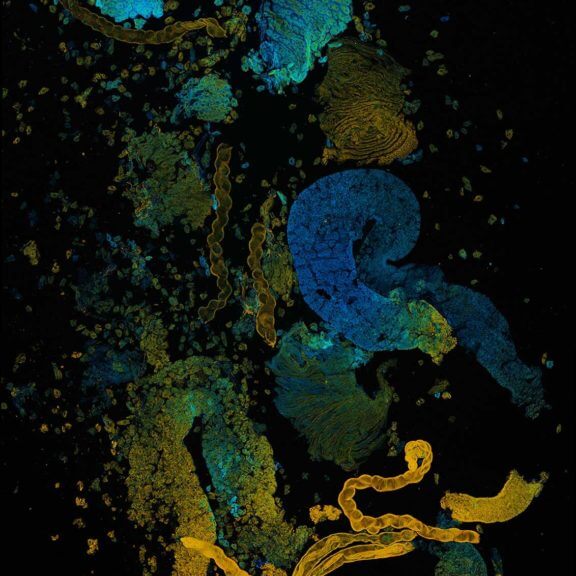
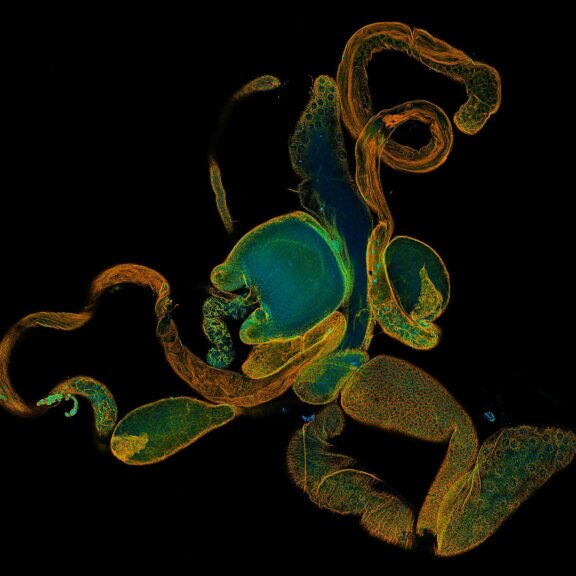
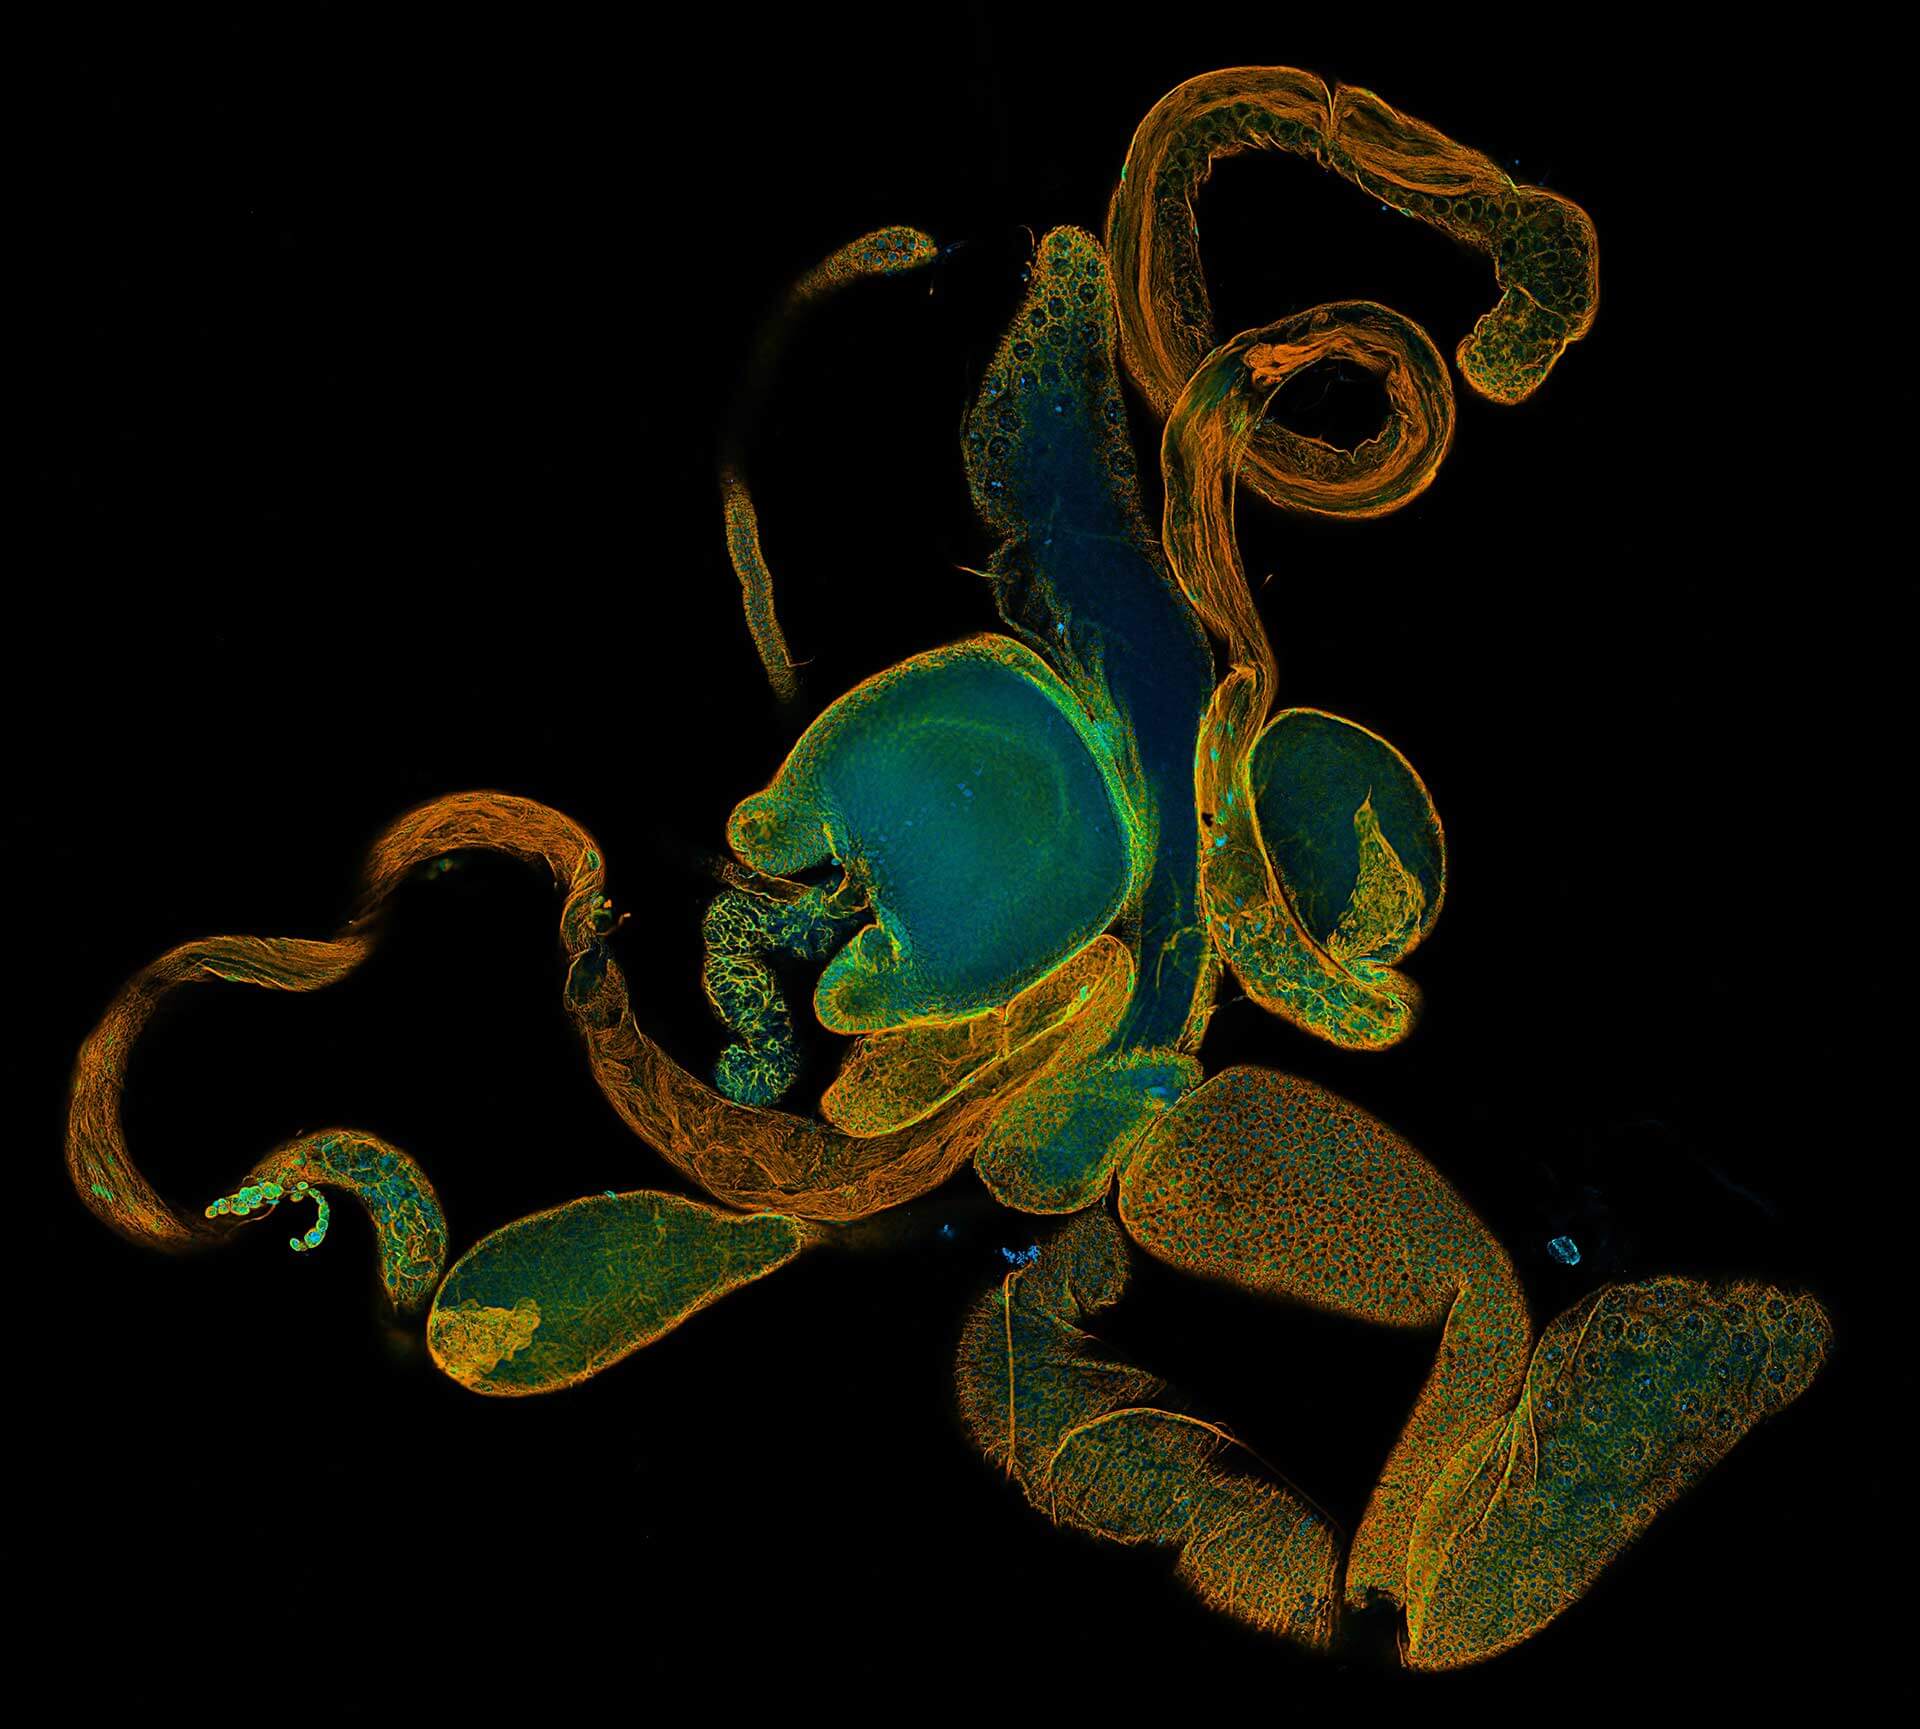
Drosophila ovariole stained with abberior STAR RED phalloidin (actin, red) and nuclear pores in STAR ORANGE (cyan) highlighting different cell types of the egg chamber. Image was acquired with the STEDYCON tiling feature and assembled with the HYGENS stitcher
Description
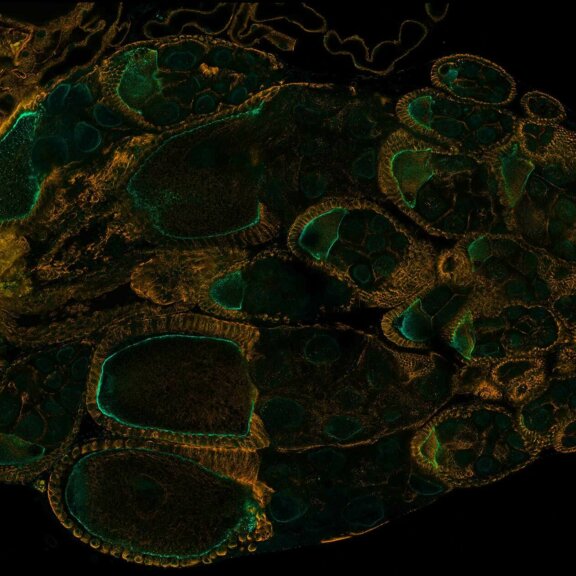
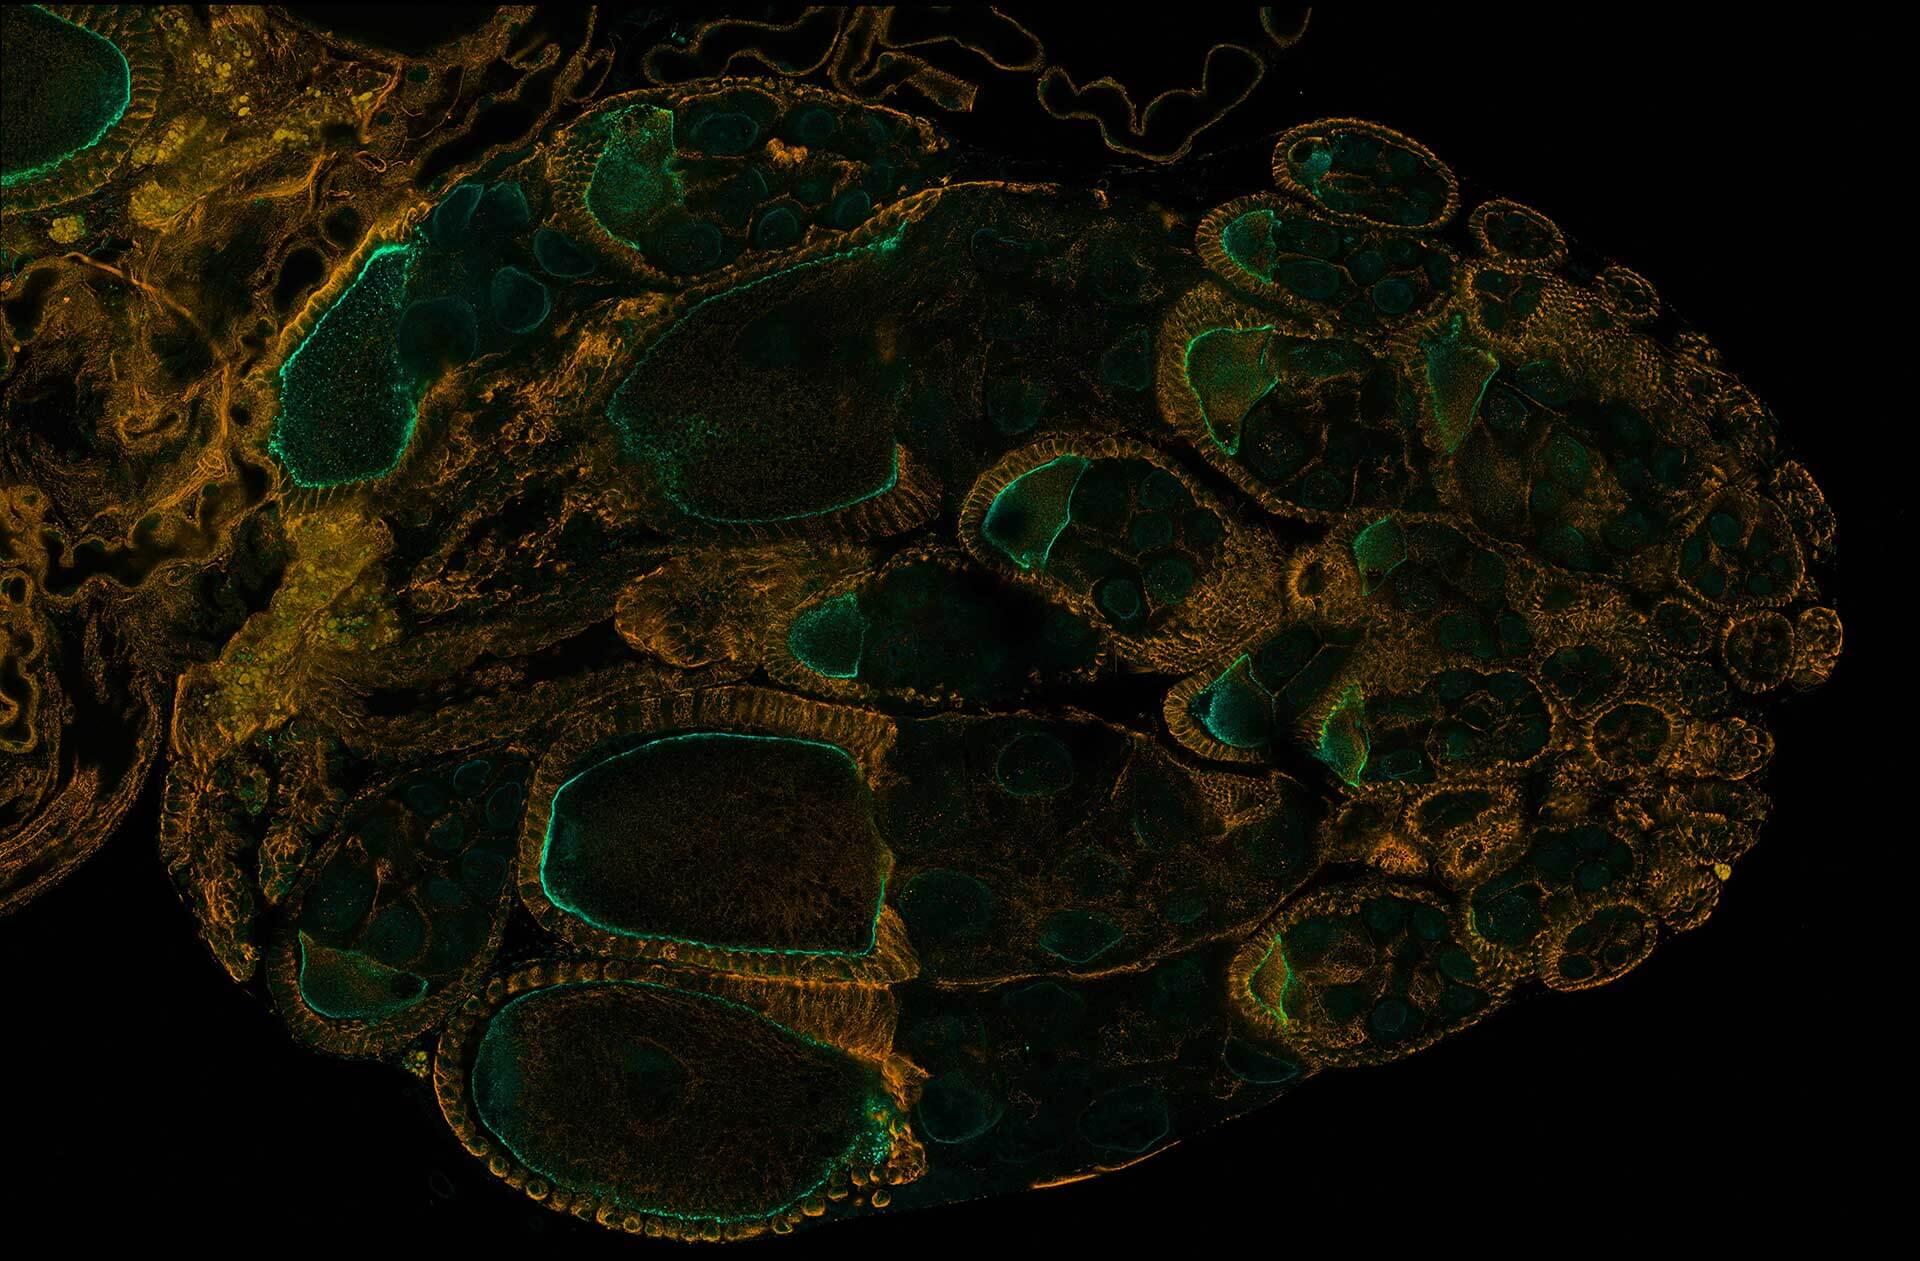
Drosophila ovariole stained with abberior LIVE 560 DNA, showing the different cell types of the egg chamber. The image was stitched using SVI Huygens.
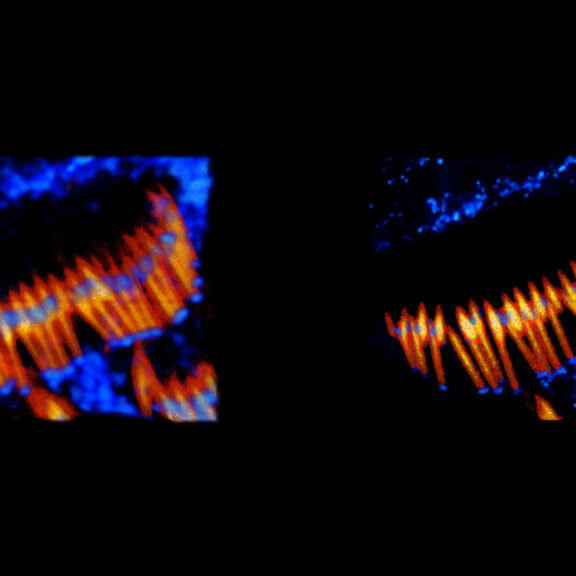
Description
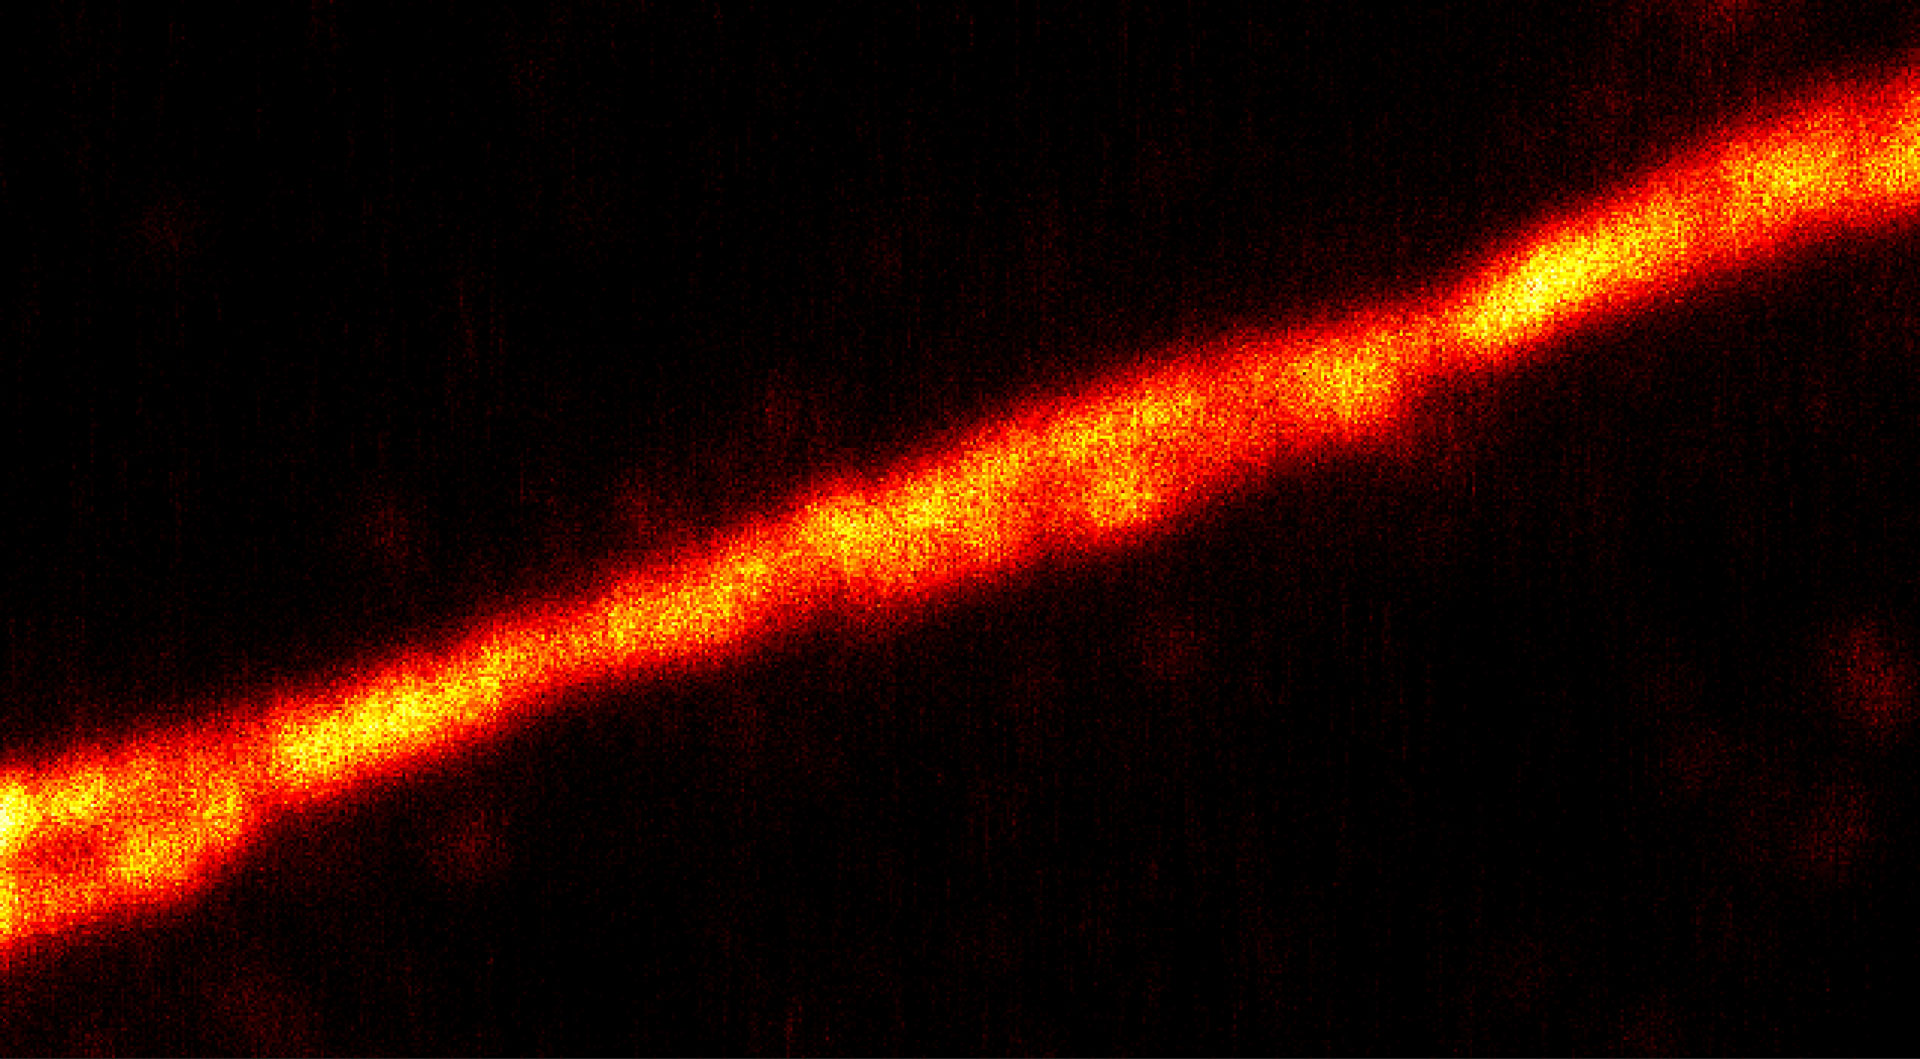
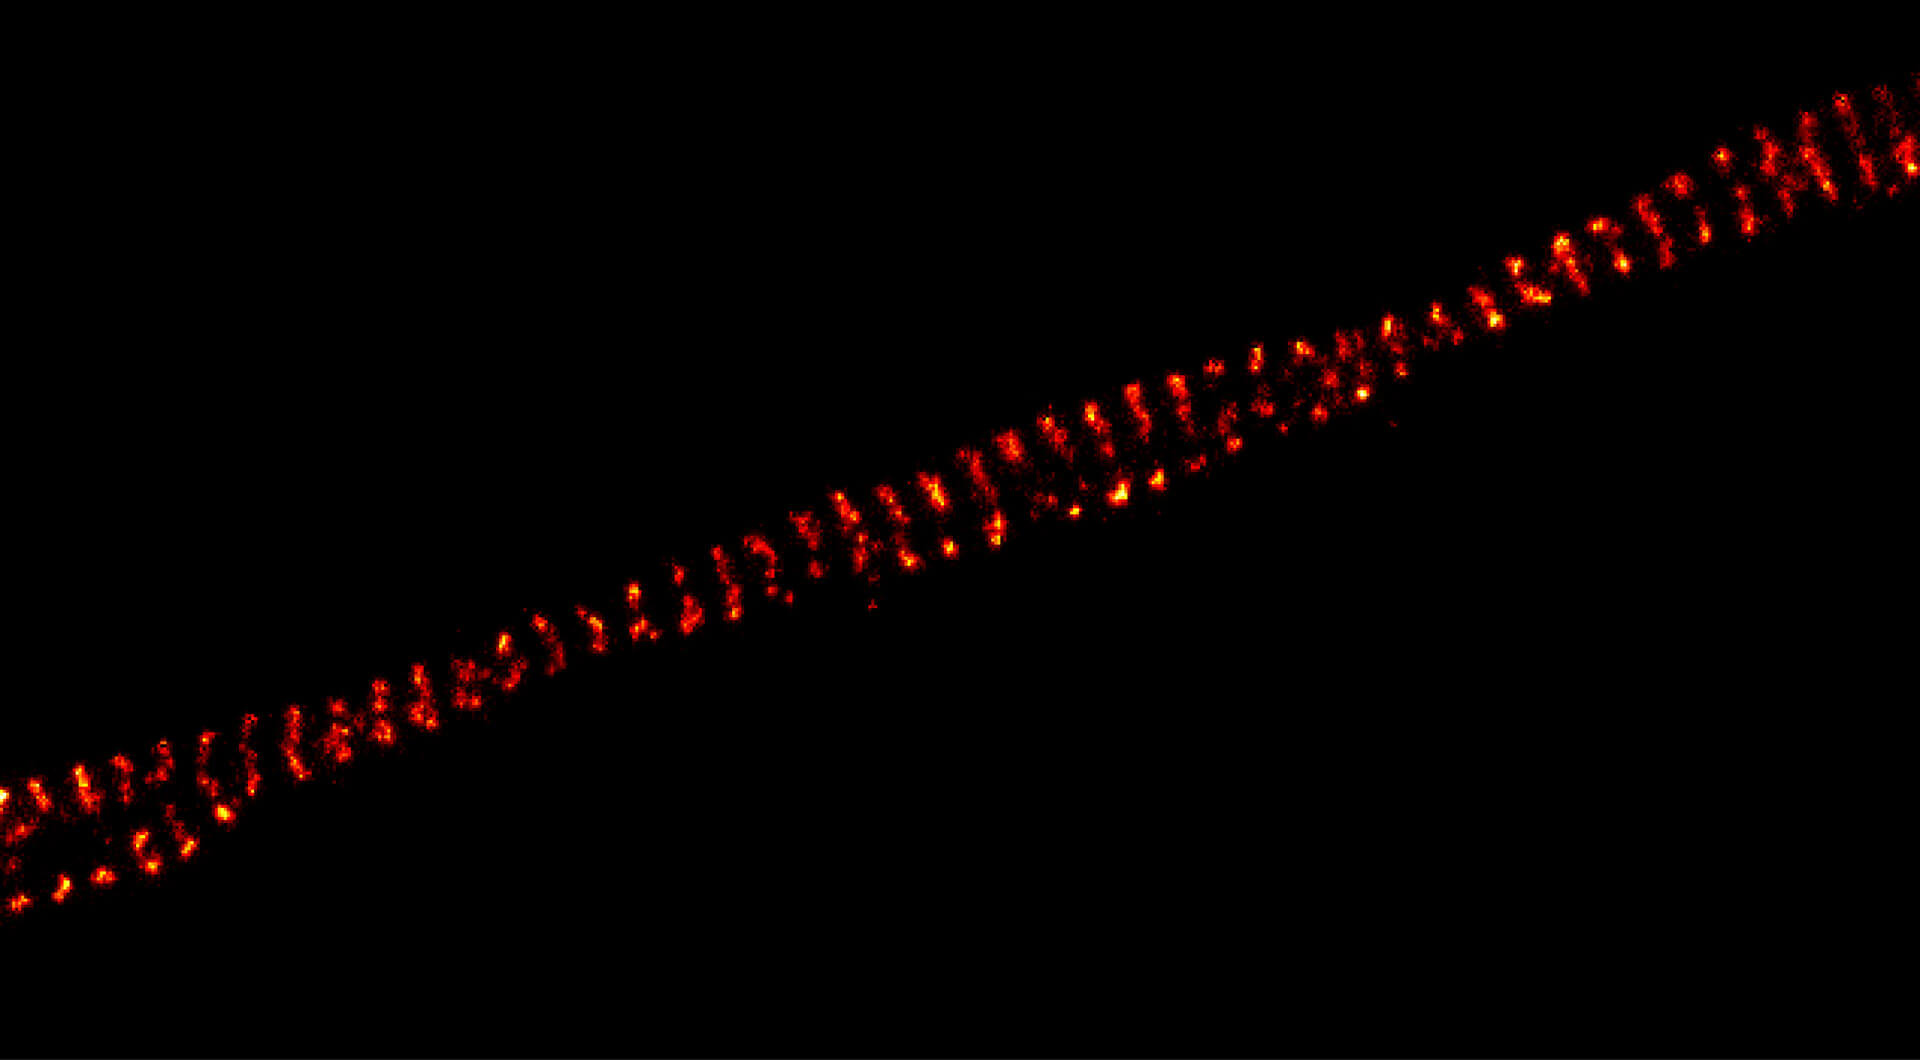
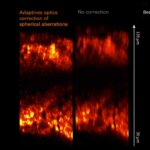
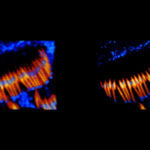
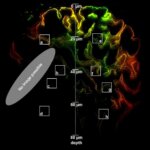
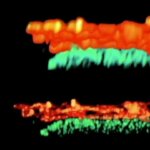
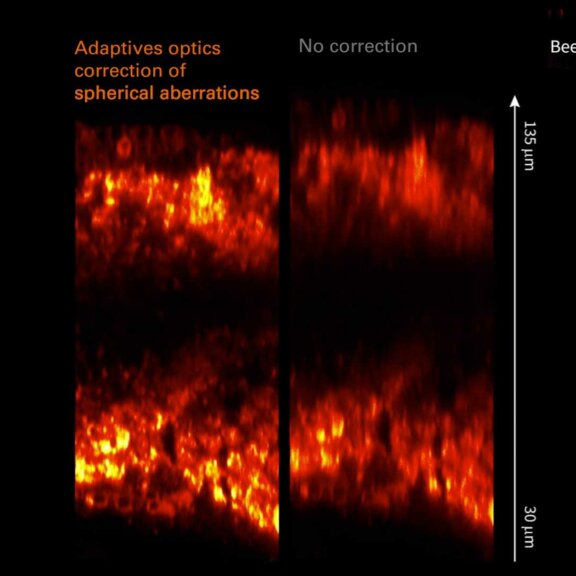
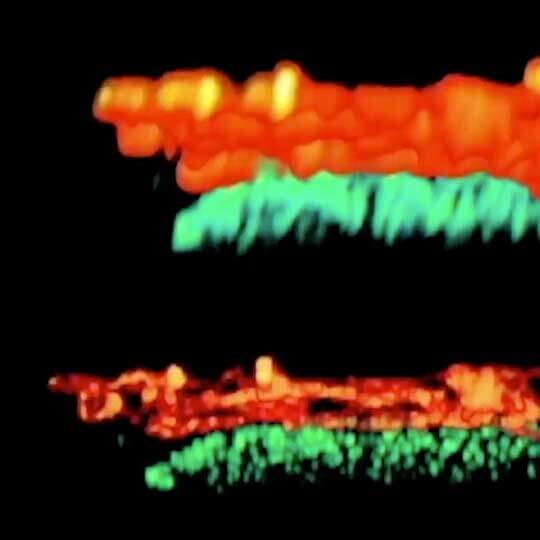
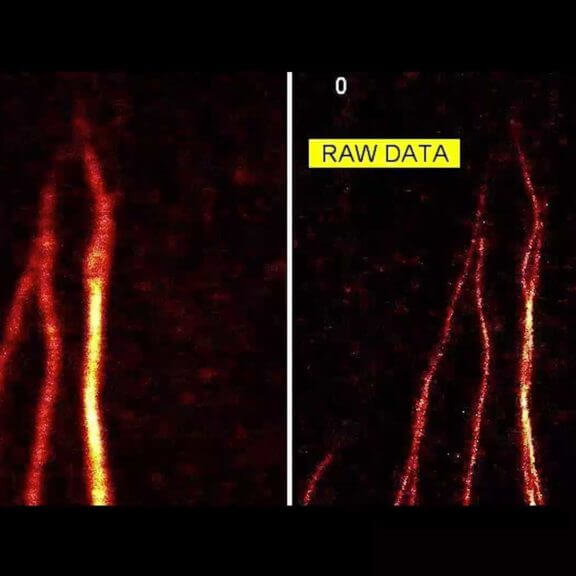
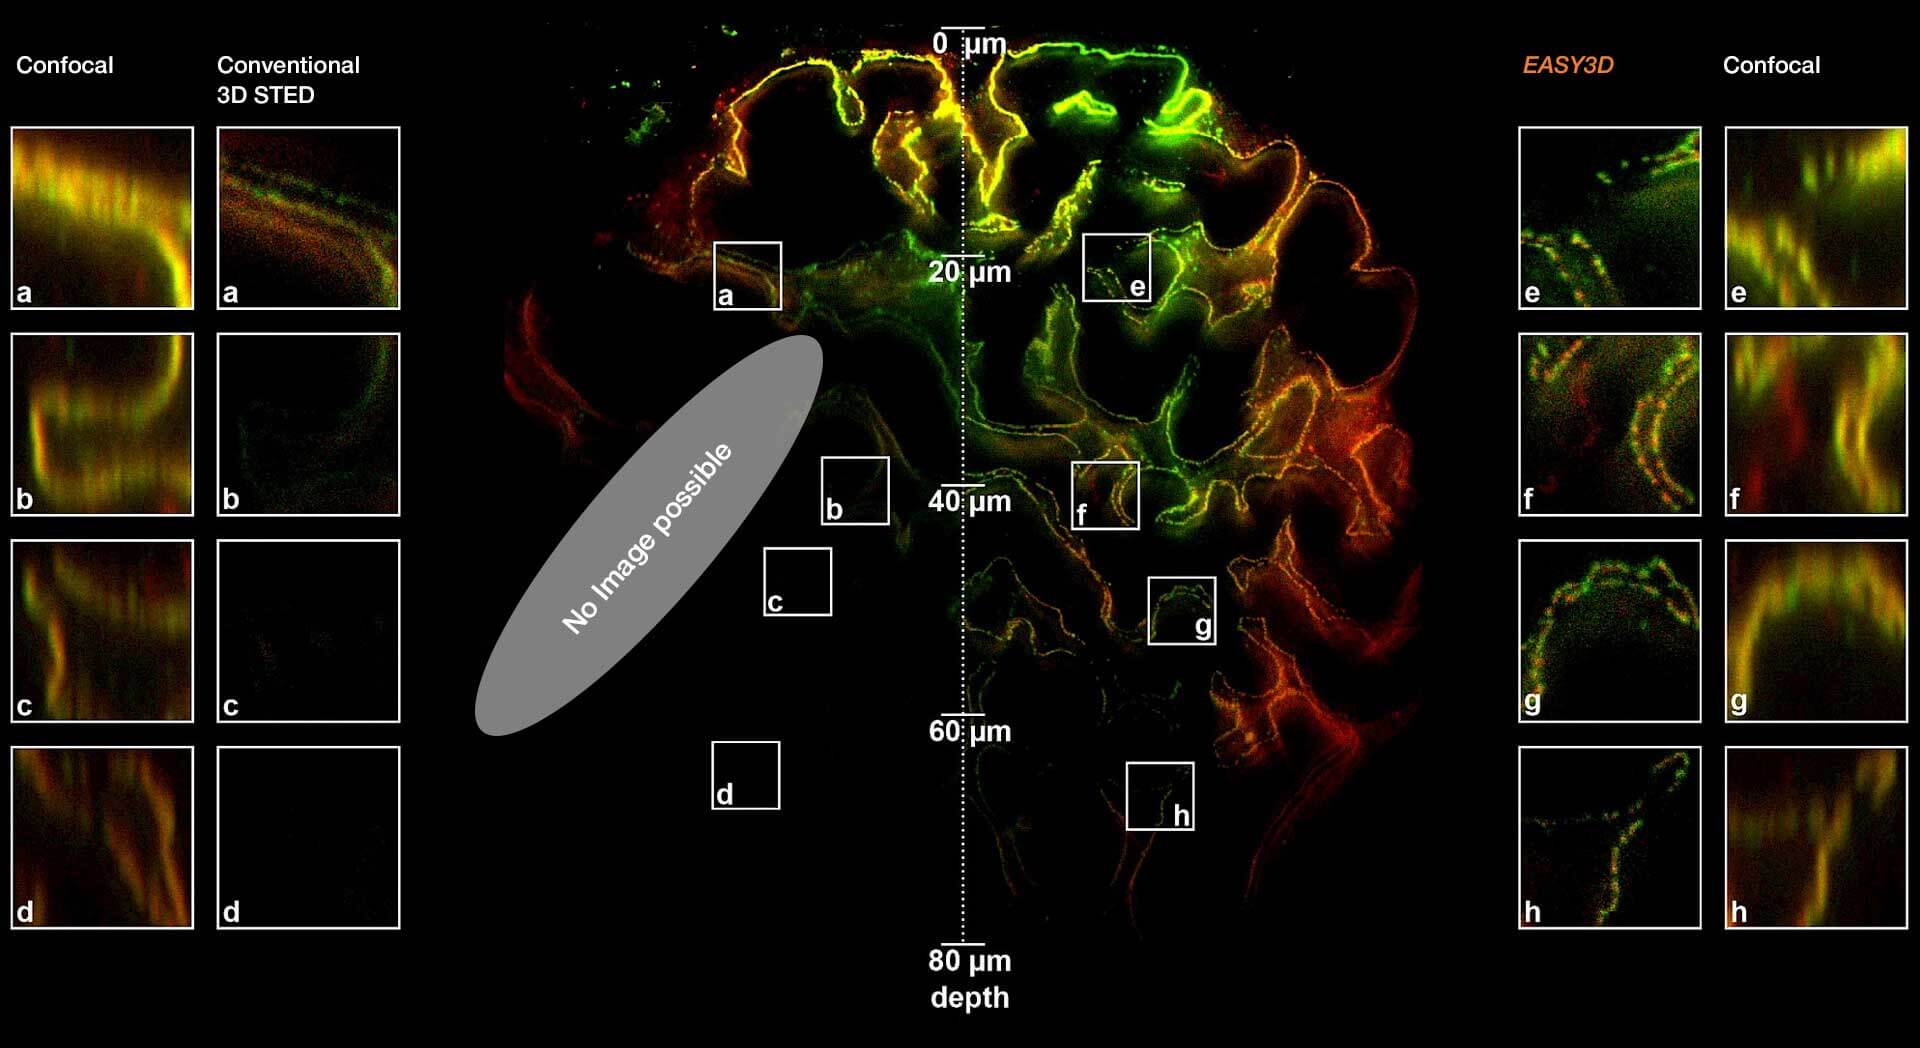
Adaptive optics EASY3D enables deep imaging of cleared adult kidney samples. Comparison of a XZ-slice deep into a renal corpuscle using conventional 3D STED imaging and an EASY3D imaging. EASY3D allowed imaging up to 80 µm into cleared rat kidney tissue using an oil objective. Without adaptive optics, the mismatch between immersion oil and sample leads to complete signal loss. Labels: Nephrin (red, Abberior STAR635P) and Podocin (green, AlexaFluor594).
Sample was prepared by D. Unnersjö Jess and H.G. Blom @ KTH Stockholm, Sweden.
Modules: