

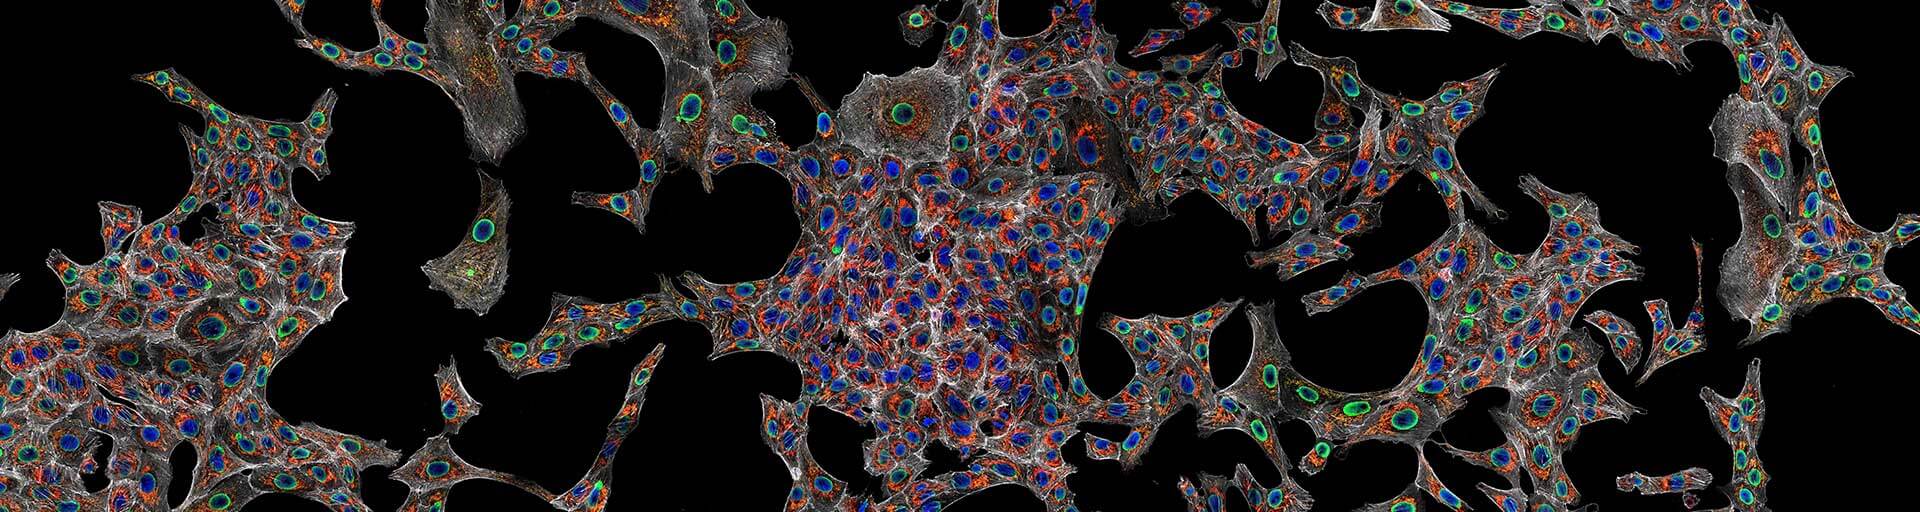
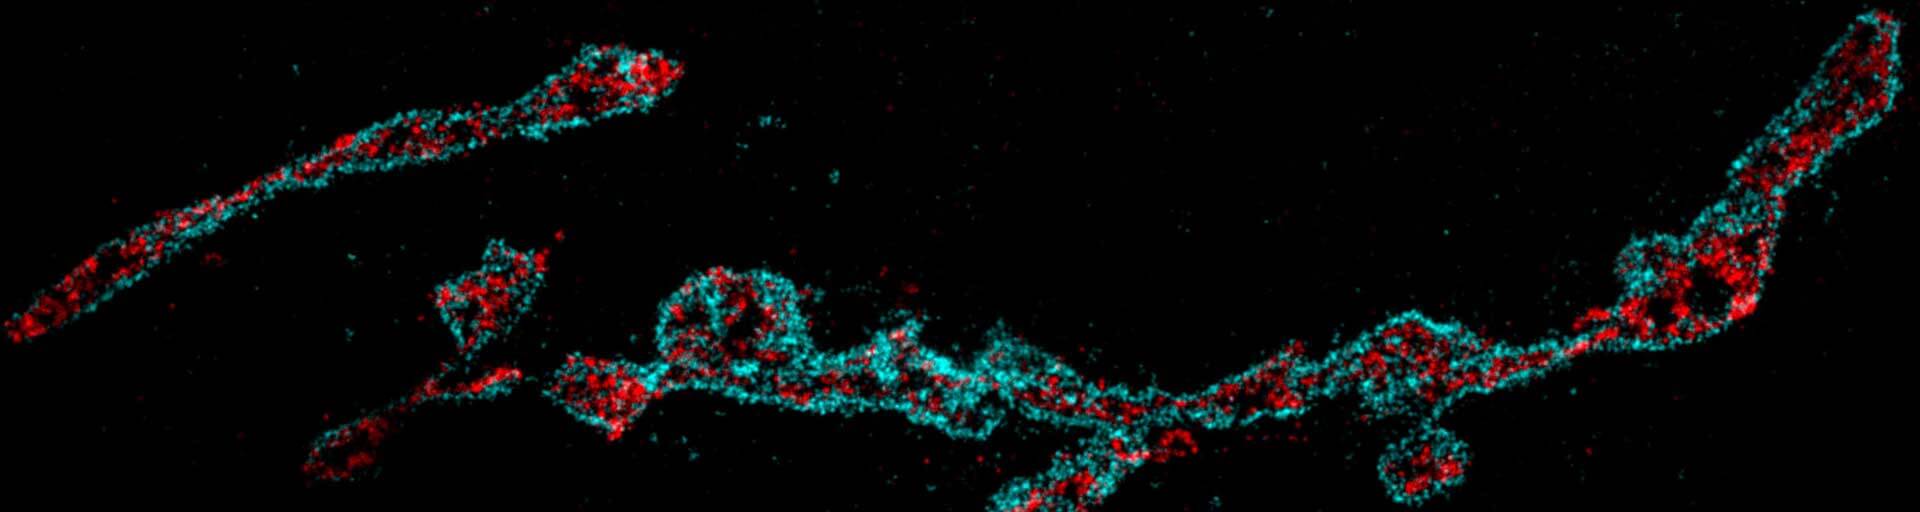
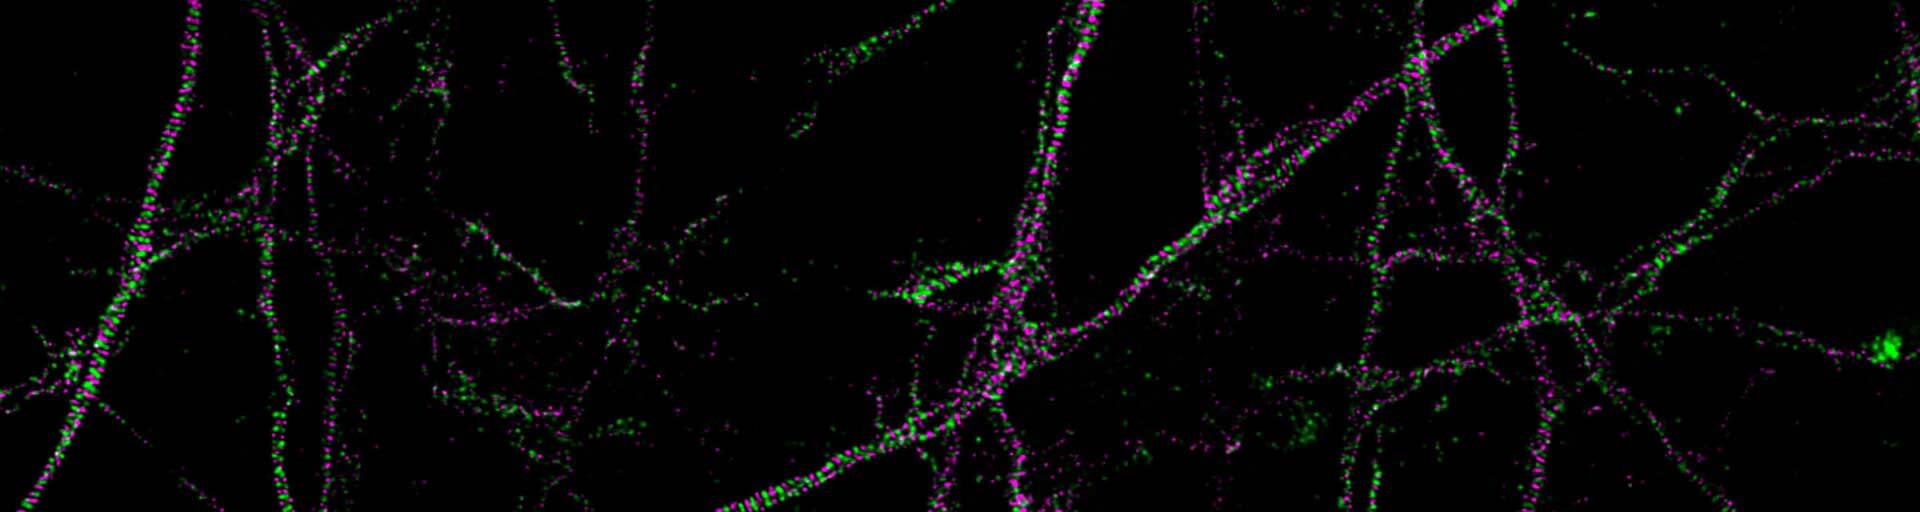
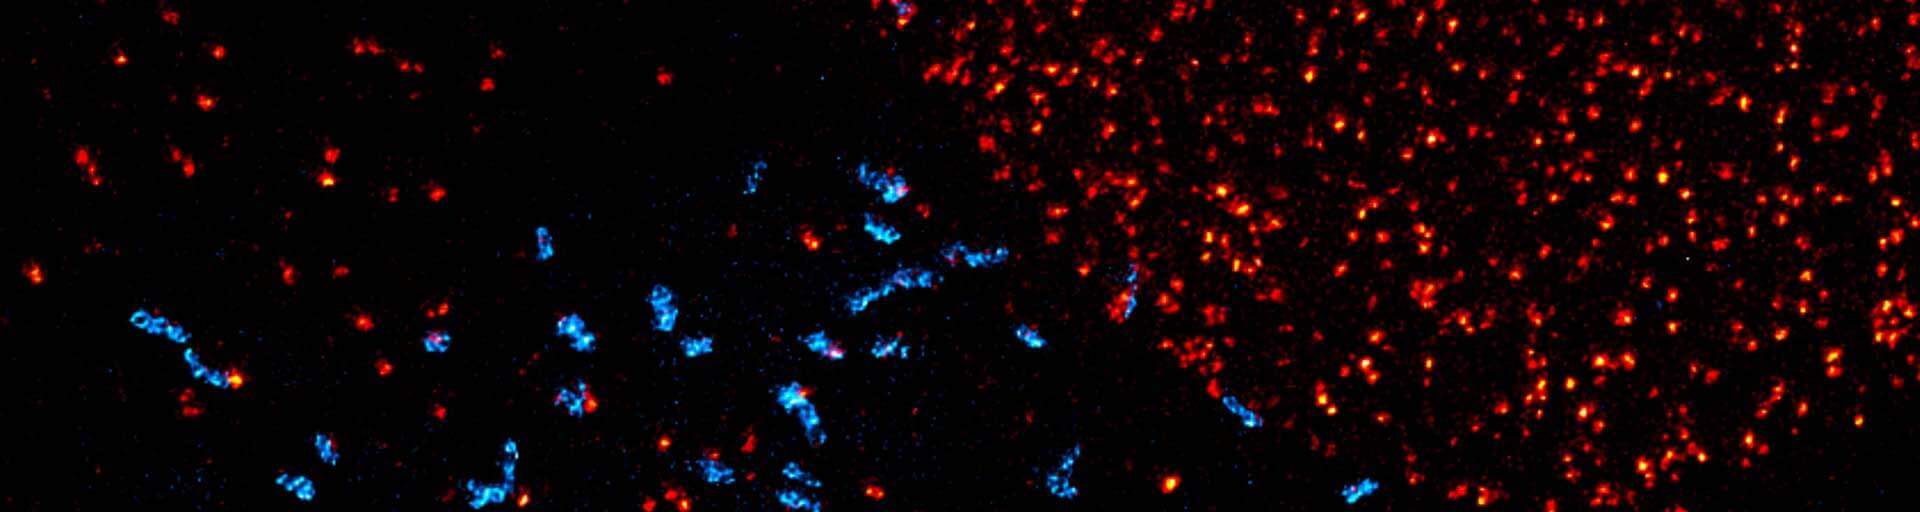



abberior is your partner for
We offer CRO services, from sample preparation and staining through automated high-throughput microscopy to AI-powered analysis. Everything from a single source and developed together with leading pharma partners and equipment manufacturers.
dyes, labeling, assay development, imaging and drug screening
From molecule to image
Comprehensive CRO services
In drug discovery, the quality of a biological conclusion is only as good as the weakest step in the experimental chain. Precise labeling, optimized sample preparation, and purpose-built imaging systems are not nice-to-haves, they are the difference between a robust pharmacological readout and a data artifact.
abberior controls all basic steps in drug discovery – dye chemistry, labeling strategy, assay development, automated & cutting-edge imaging and multiomics data analysis – each step and component is developed with the others in mind.
Dyes
Each of your questions needs a dye to answer them. That’s the reason why we develope dyes!
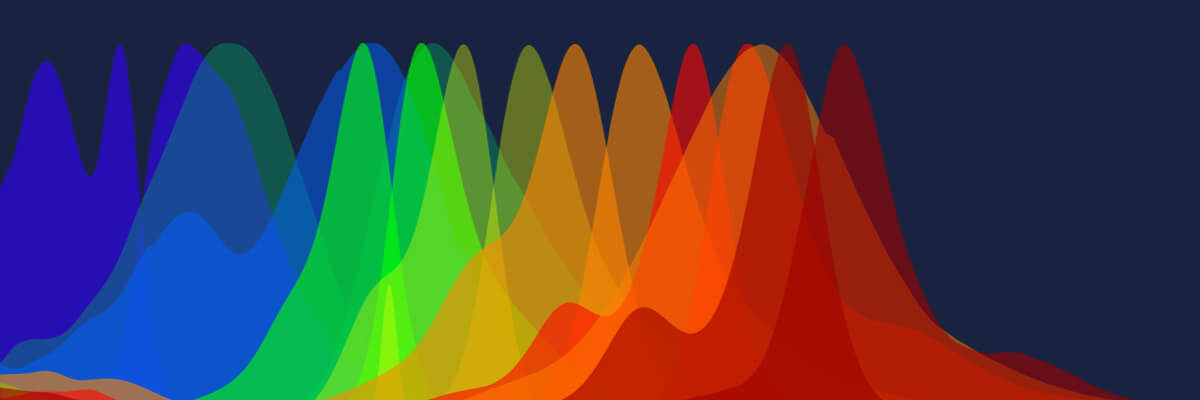
abberior dyes are developed and manufactured in-house. They are optimized for STED and validated across all fluorescence modalities from widefield to confocal, spinning disk and beyond. They cover the full spectral range from 400 to 680 nm.
Labeling
What’s the best way to label your structure and apply the dyes exactly where they are needed? Each of your samples requires clever labeling strategies – take advantage of abberior’s many years of experience!
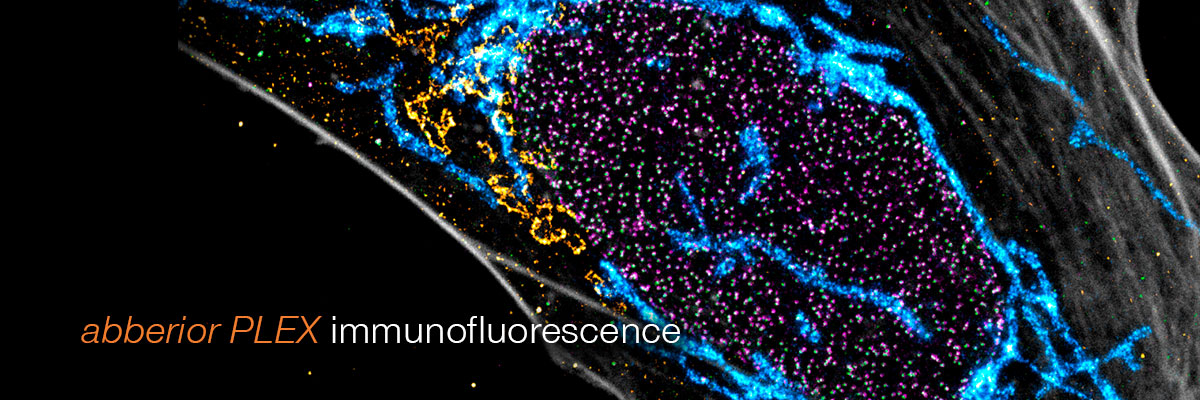
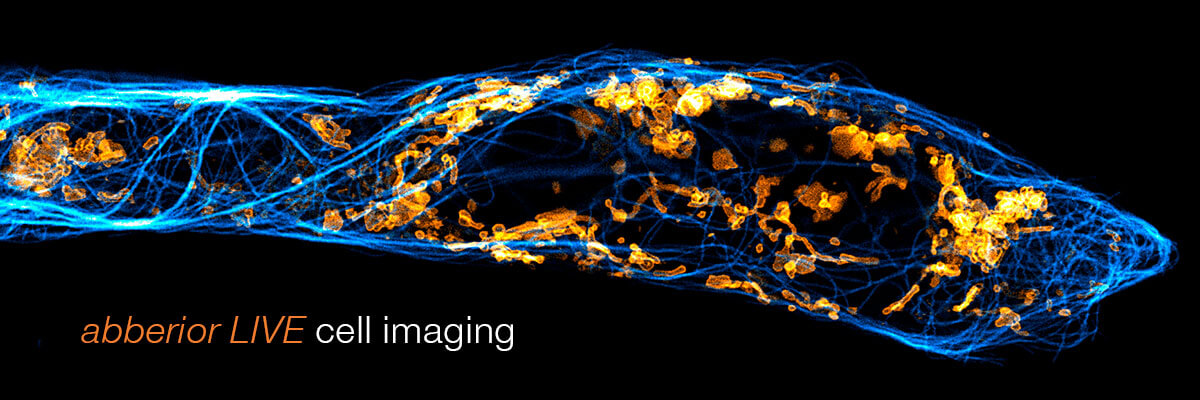
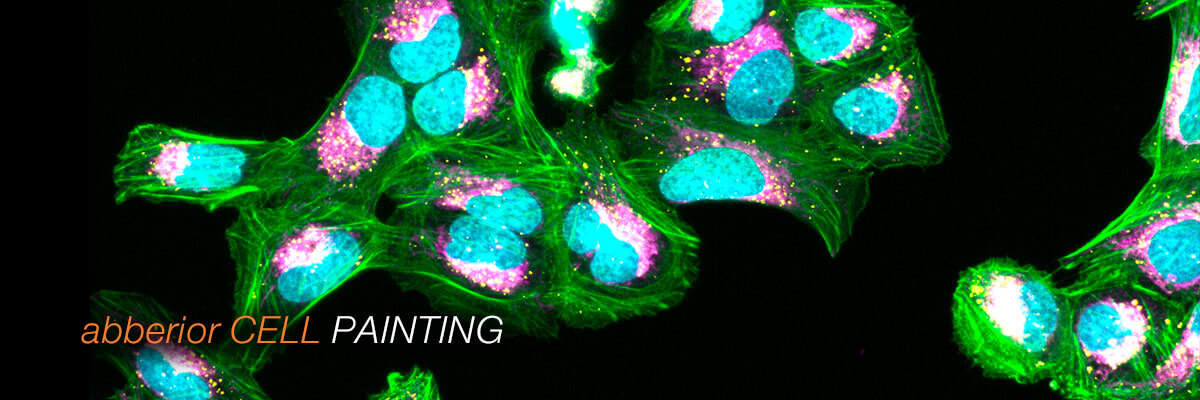
Our labels are compatible with fixed and living cells. We offer a variety of strategies for multi labeling, ranging from standard immunofluorescence to the Cell Painting multiplex method and customized solutions.
Imaging
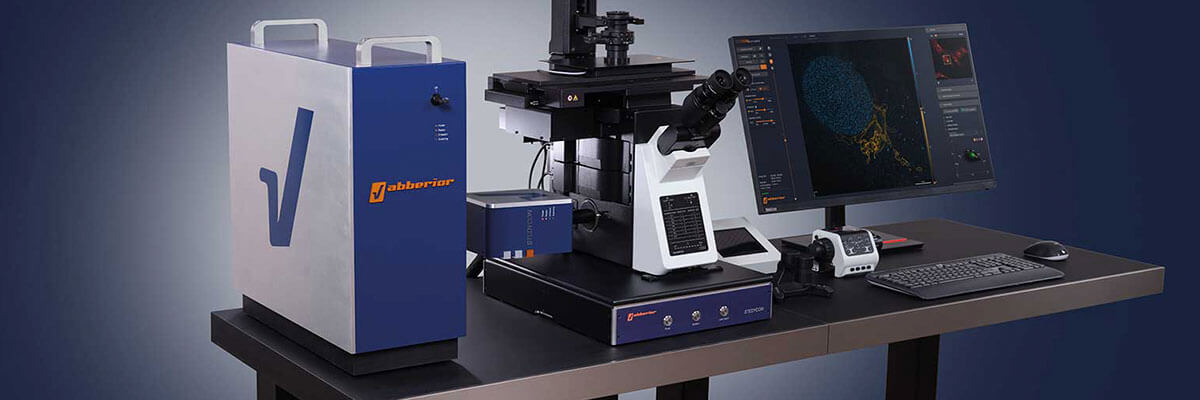
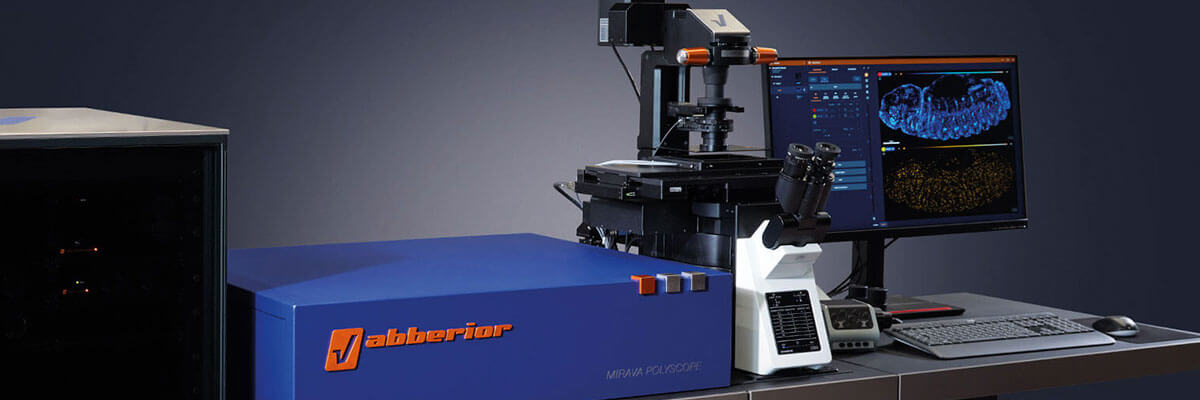
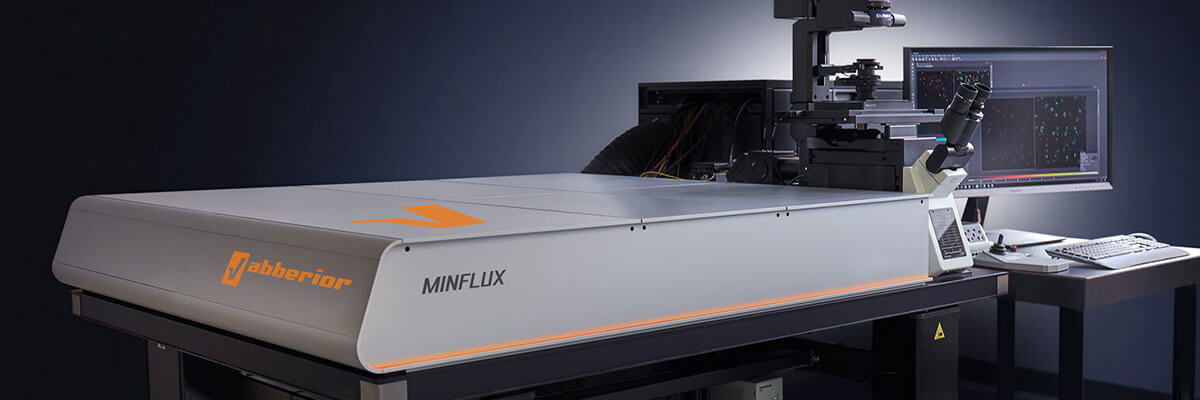
Two things are crucial for success: the right dye at the right spot and the right STED system. We are the inventors of STED and MINFLUX, two of the most relevant superresolution technologies, and you can be sure we know how to image right.
We as abberior use our own STED and high-content imaging systems. They are designed for automated pharma-grade screening workflows.
End-to-end workflow
full-service from a single source
Superresolution imaging in drug discovery fails not at the microscope but at the interfaces between sample preparation, labeling, imaging, and analysis. Each handover introduces variability and limits throughput. An integrated end-to-end workflow eliminates these bottlenecks, enabling statistically robust datasets at nanoscale resolution – from the same source that developed the dyes, built the instruments, and trained the AI. Bookable as individual modules or as a fully integrated package. We accompany your project from first cell to final analysis report.
(1)
Assay development
(2)
Labeling
(3)
High-content and STED imaging
(4)
AI-powered analysis
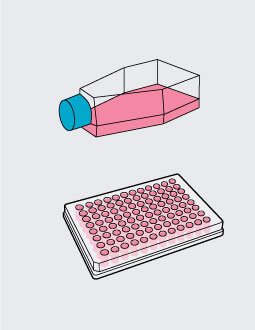
Cell culture, cellular model formation and seeding into multiwell plates or on slides, tailored to your biological model.
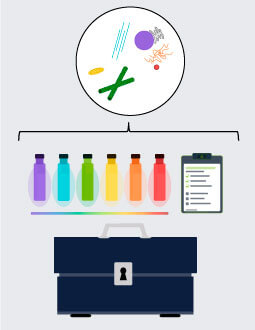
abberior CELL PAINTING, LIVE Toolbox, PLEX 5 and custom staining solutions and protocols. Fixed and live-cell compatible. Ready-to-use kits available.
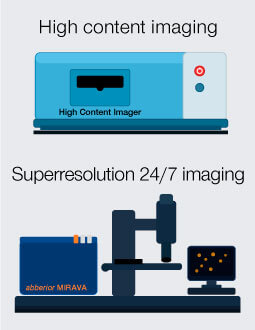
Fully automated multiwell scanning with ROI detection. Combined High Content Imaging and Superresolution STED imaging — continuous, 24/7, over 100 SR images per well.
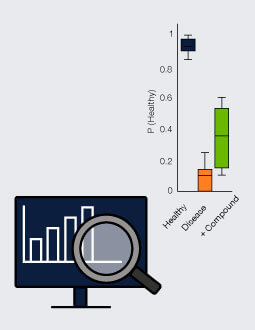
Deep-learning classification and quantification of cellular structures from large STED datasets. Automated, scalable, reproducible.
Automated high-throughput STED imaging
to change the game
A fully modular and customizable automated STED imaging workflow, compatible with multiwell plates and slides. From sample navigation and in-well raster scanning to AI-driven ROI detection and automated focus finding. The result: statistically robust superresolution datasets, generated 24/7 without manual intervention.
Ask for detailed information >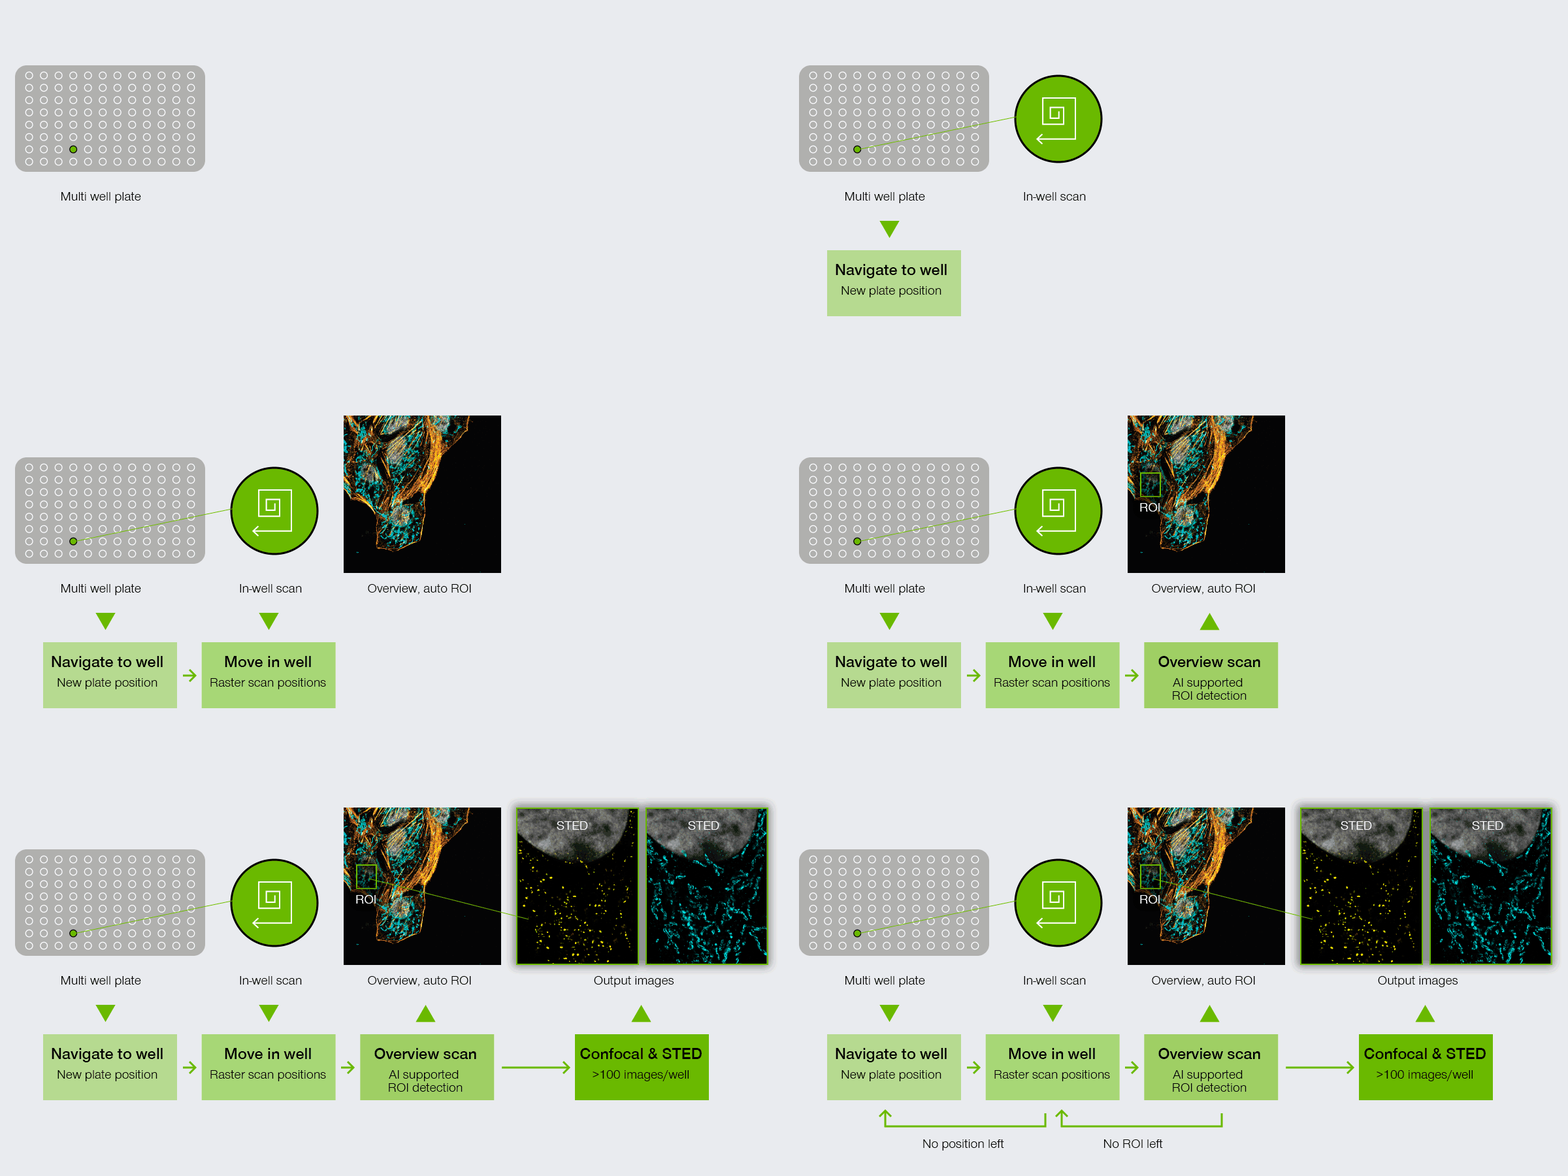
abberior 24/7 artificial intelligence guided software — certainly including abberior superresolution imaging.
Superresolution in practice
Examples of how our CRO services and technology address clinically relevant questions in partnership with leading research organizations.

Decoding podocyte injury: STED microscopy and spatial transcriptomics
Key Finding
STED microscopy detects early podocyte foot process effacement in biopsies with completely normal H&E morphology — invisible to conventional light microscopy, but critical for early diagnosis and drug target identification.
- Three distinct effacement patterns classified: normal, diffuse global, and segmental only resolvable at nanoscale
- Diffuse global effacement associated with early, primary podocyte injury — detectable before any structural changes appear in standard pathology
- Molecular signature of effacement identified: downregulation of nephrin (NPHS1) and slit diaphragm maintenance pathways
- Integrative STED + spatial transcriptomics approach enables simultaneous structural and molecular characterization from routine biopsy material
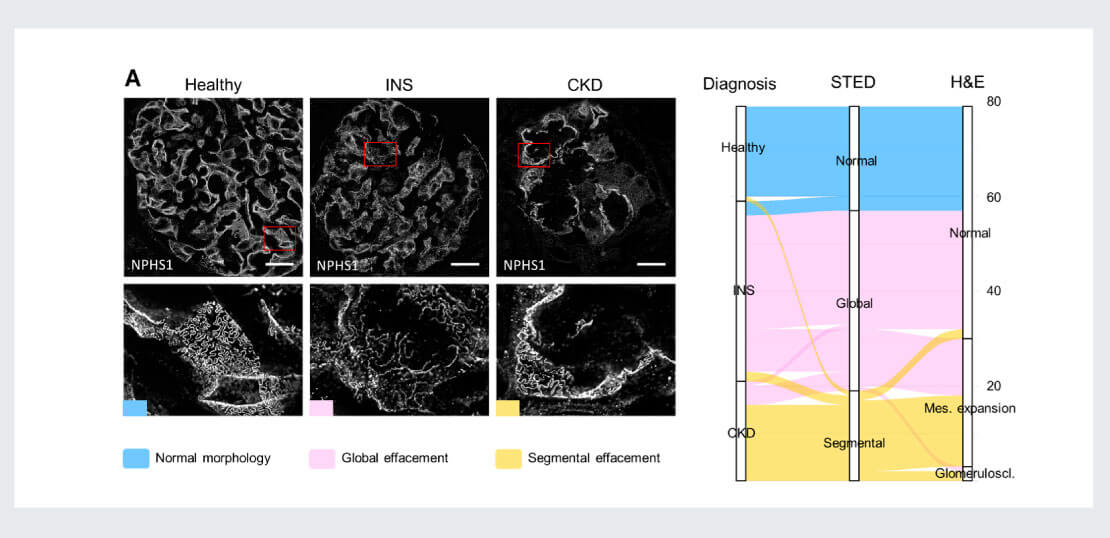
Figure: Representative stimulated emission depletion (STED) microscopy images of the glomerular filtration slit in kidney biopsies from healthy living donors (healthy), idiopathic nephrotic syndrome (INS), and chronic kidney disease (CKD) patients. The glomerular filtration slit was visualized by nephrin (NPHS1) immunostaining and STED microscopy and subjected to expert histopathology assessment. Glomeruli were classified by appearance of their filtration slits into normal morphology (blue), diffuse global (pink) or segmental (yellow) podocyte effacement. The filtration slit STED and H&E morphology were summarized by diagnosis groups in an alluvial plot, highlighting the association of diffuse global podocyte effacement with normal H&E morphology and INS.

Mitochondrial diagnostics in Leigh sydrome
Key Finding
STED microscopy served as the functional efficacy readout in a 5,632-compound drug repurposing screen identifying sildenafil as a candidate treatment for Leigh syndrome, validated from iPSC models through to six patients with confirmed clinical improvement.
- Specialized mito probes for cristae imaging, abberior dyes optimized for highest STED performance
- Conventional confocal microscopy cannot distinguish disease cases — STED makes the difference
- AI classification of uniform vs. laterally enriched Mic60 distribution patterns
- More than 4,000 STED images per condition for statistically robust conclusions
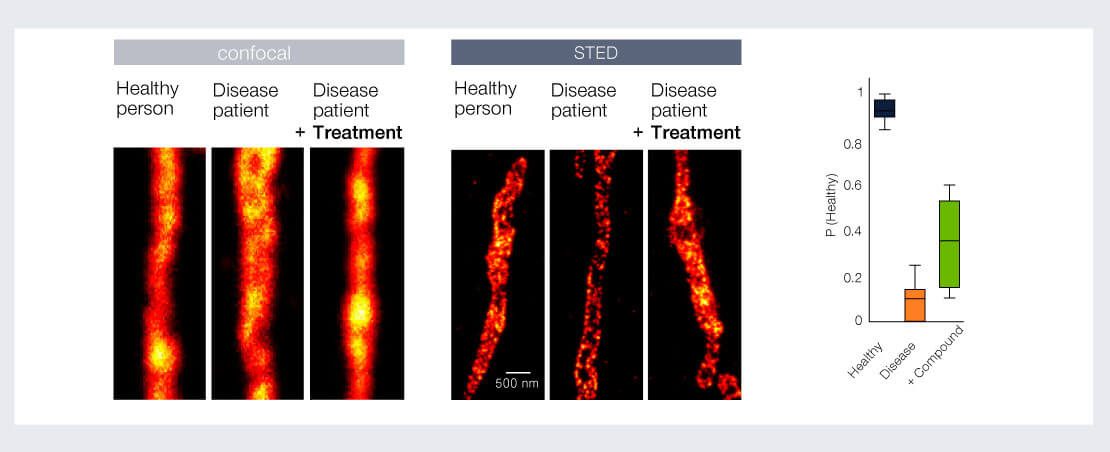
Figure: Representative stimulated emission depletion (STED) microscopy images of the glomerular filtration slit in kidney biopsies from healthy living donors (healthy), idiopathic nephrotic syndrome (INS), and chronic kidney disease (CKD) patients. The glomerular filtration slit was visualized by nephrin (NPHS1) immunostaining and STED microscopy and subjected to expert histopathology assessment. Glomeruli were classified by appearance of their filtration slits into normal morphology (blue), diffuse global (pink) or segmental (yellow) podocyte effacement. The filtration slit STED and H&E morphology were summarized by diagnosis groups in an alluvial plot, highlighting the association of diffuse global podocyte effacement with normal H&E morphology and INS.
abberior is your trusted partner for CRO services in drug discovery
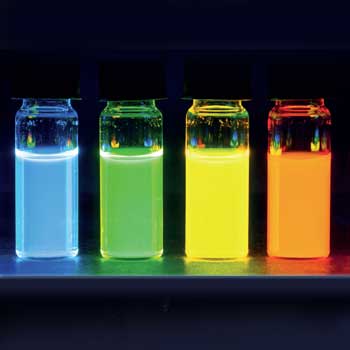
Dyes & Labels
Take a look at our fluorescent dyes. They are perfect for all types of microscopy, such as STED, MINFLUX, confocal, STORM, PALM, GSD, GSDIM, SIM and RESOLFT.
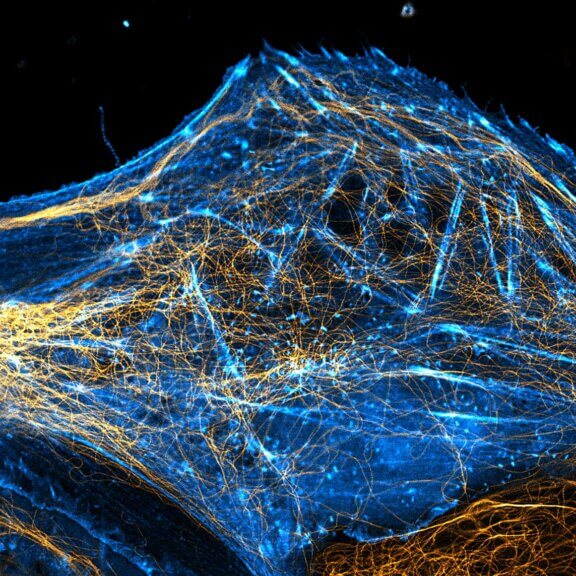
Publications
The Abbe diffraction limit was overcome. This paved the way for great publications, some of which are listed here, using abberior dyes and microscopes.
Protocols
Not rocket science, but simple protocols that make the daily life of a fluorescence microscopist much easier.
Microscope Systems
Fluorescence microscopy is an indispensable tool and for your science, you need the finest technology combined with hassle-free operation from abberior.