

Sample gallery
Fluorescence imaging, whether at confocal, STED or MINFLUX resolution, guarantees unique insights into the function and structure of life at the molecular level. Besides the scientific information content, some sample portraits provide simply beautiful images. Enjoy browsing our sample gallery.
the fine art of science
Description
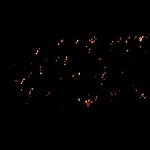
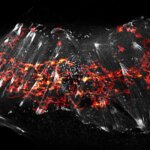
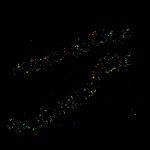
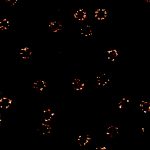
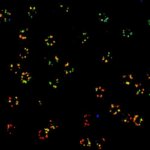
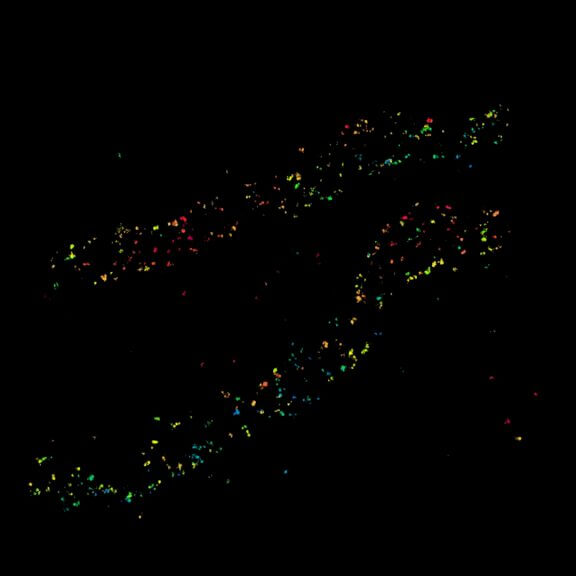
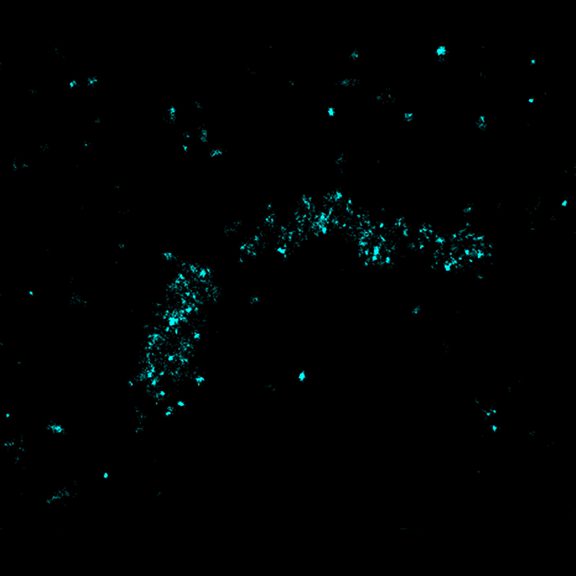
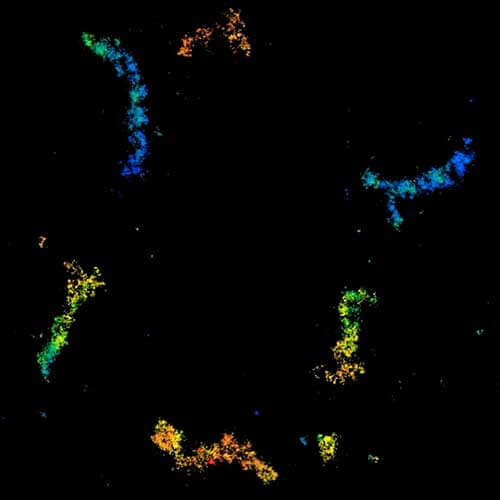
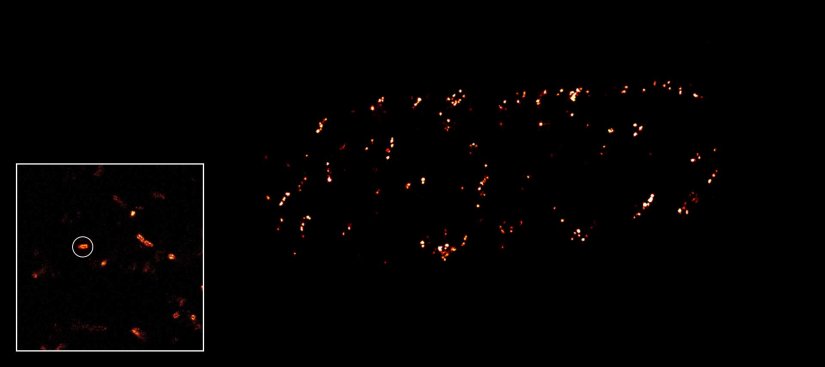
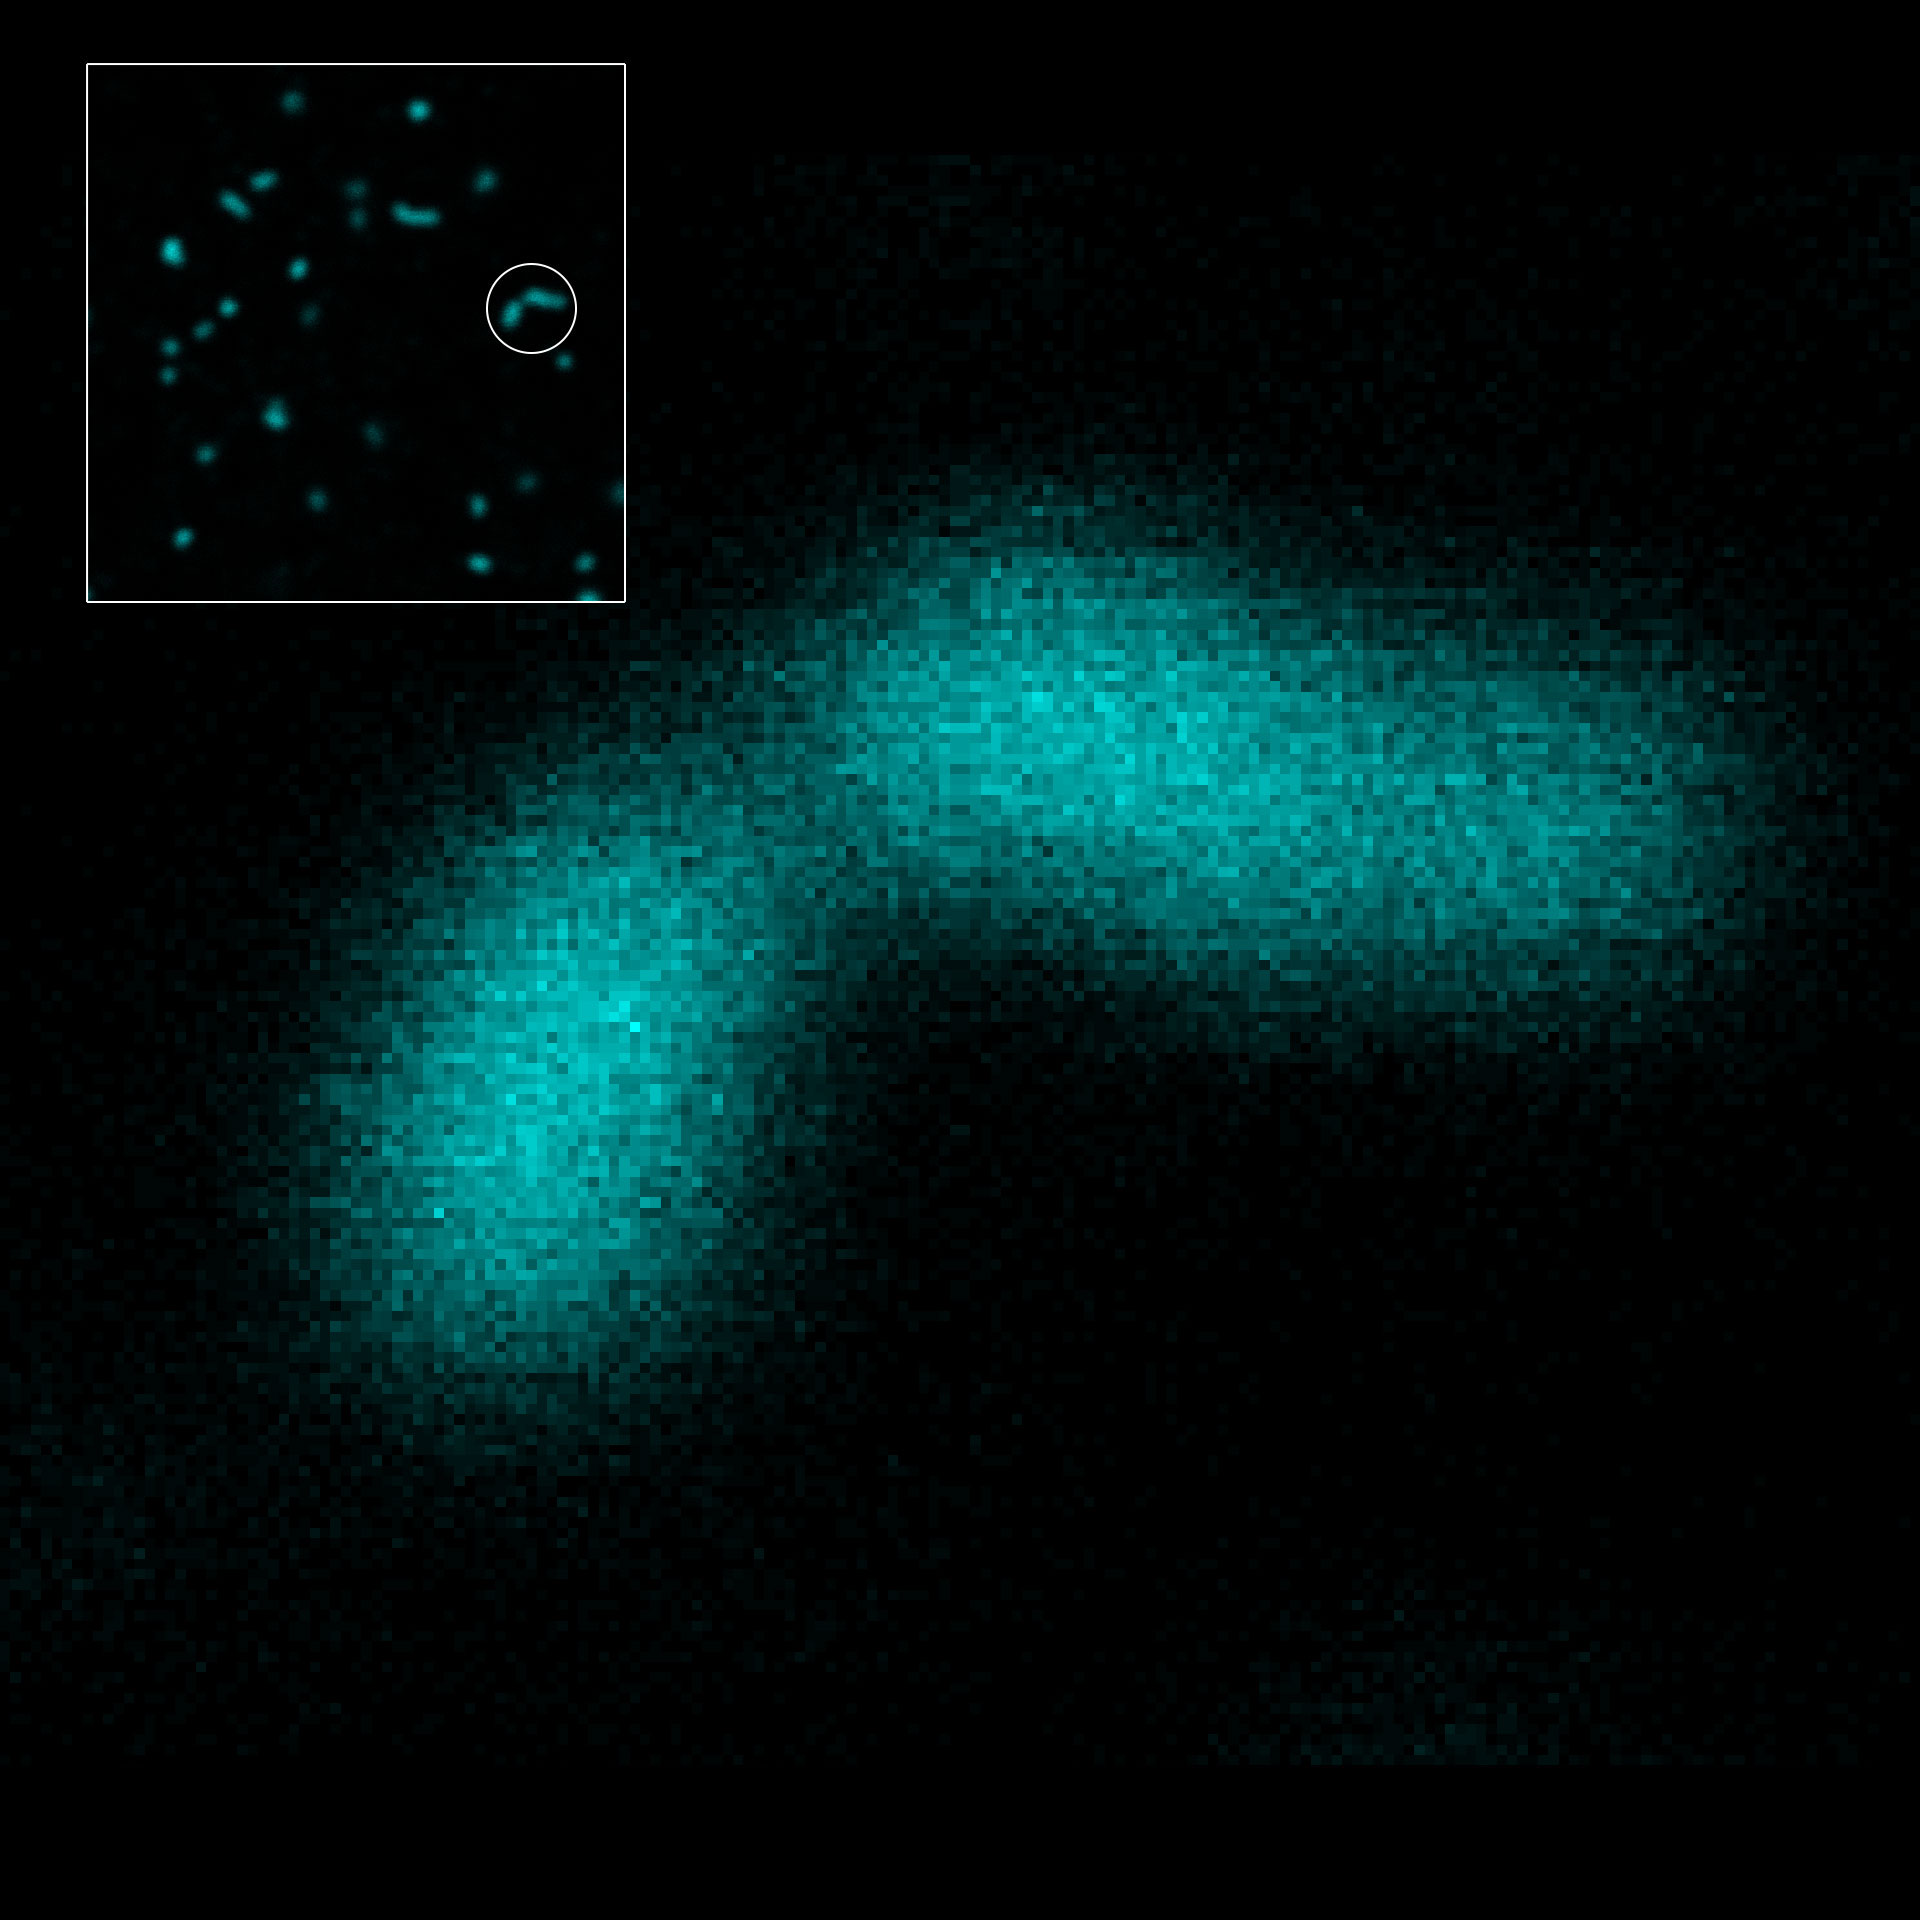
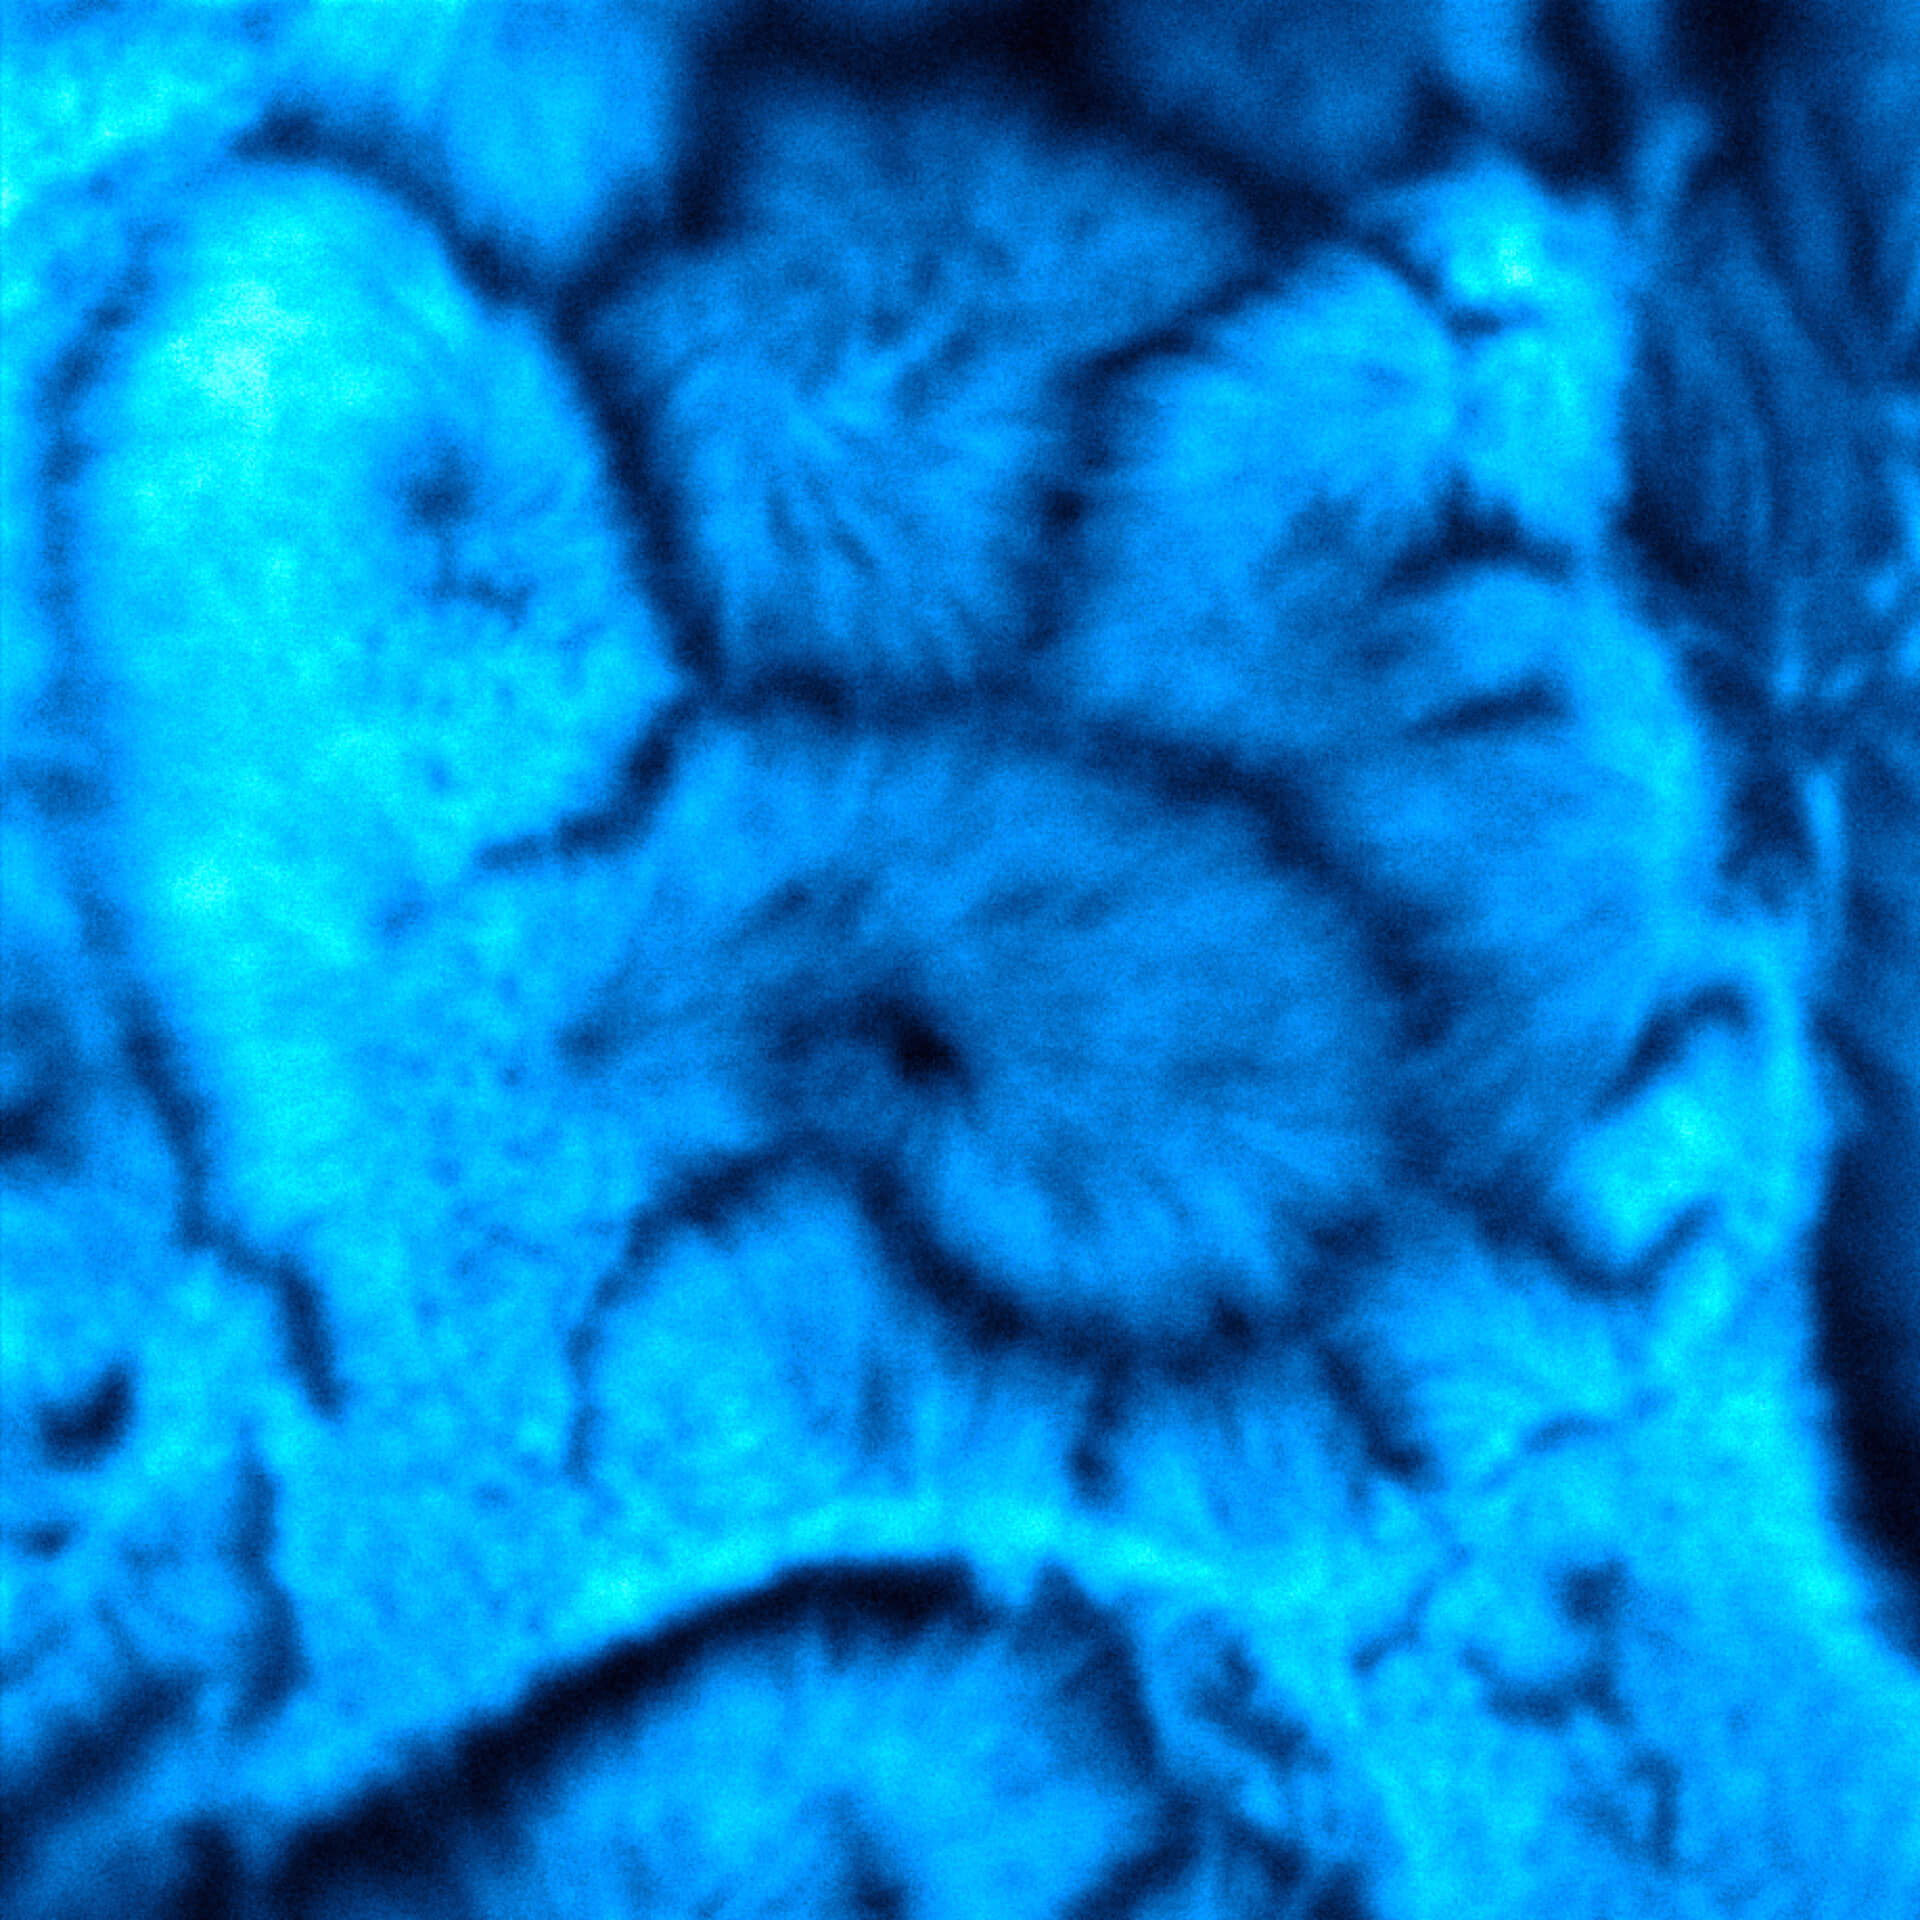
2D MINFLUX nanoscopy of Y. enterocolitica sorting platform protein Halo-YscL.
Sample from Alexander Carsten, Prof. Martin Aepfelbacher, Institute of Medical Microbiology, Virology and Hygiene, University Medical Center Hamburg Eppendorf, Germany
Description
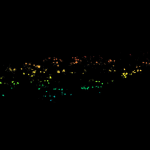
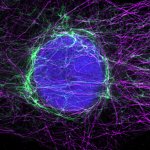
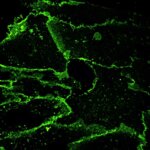
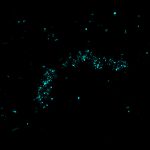
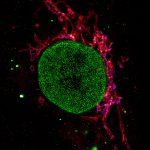
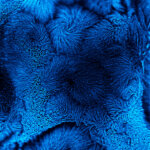
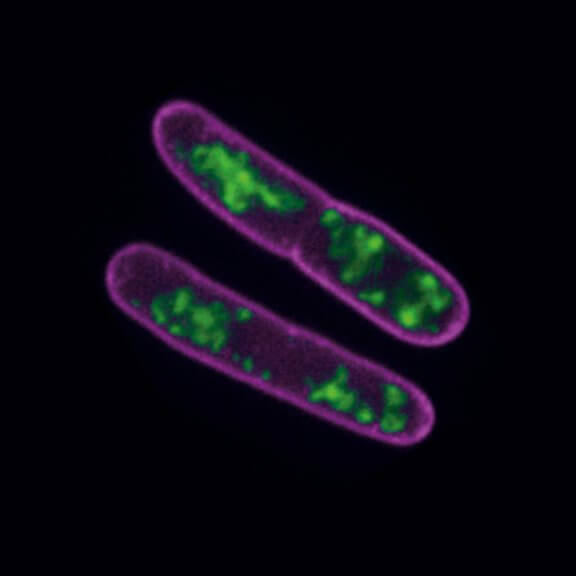
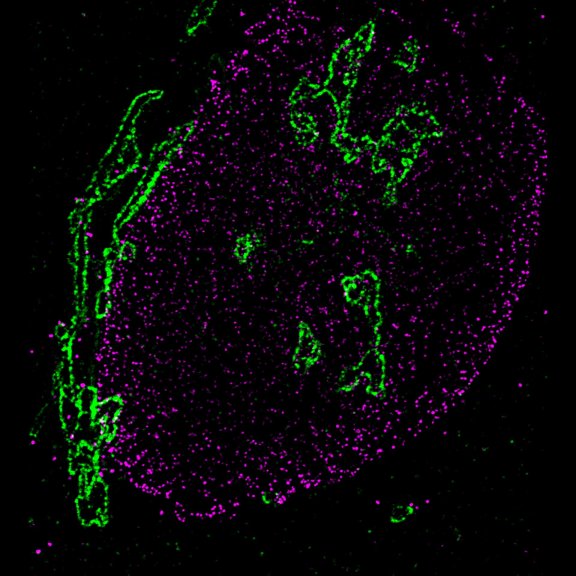
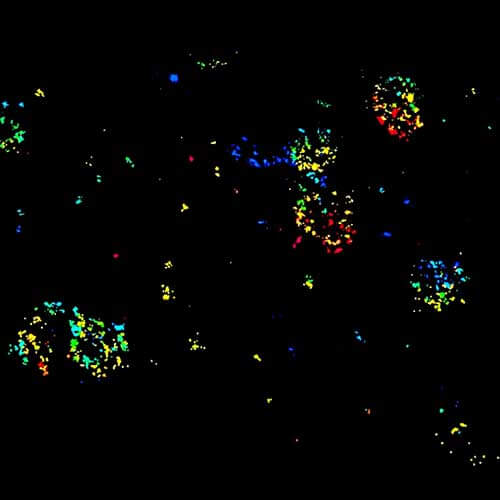
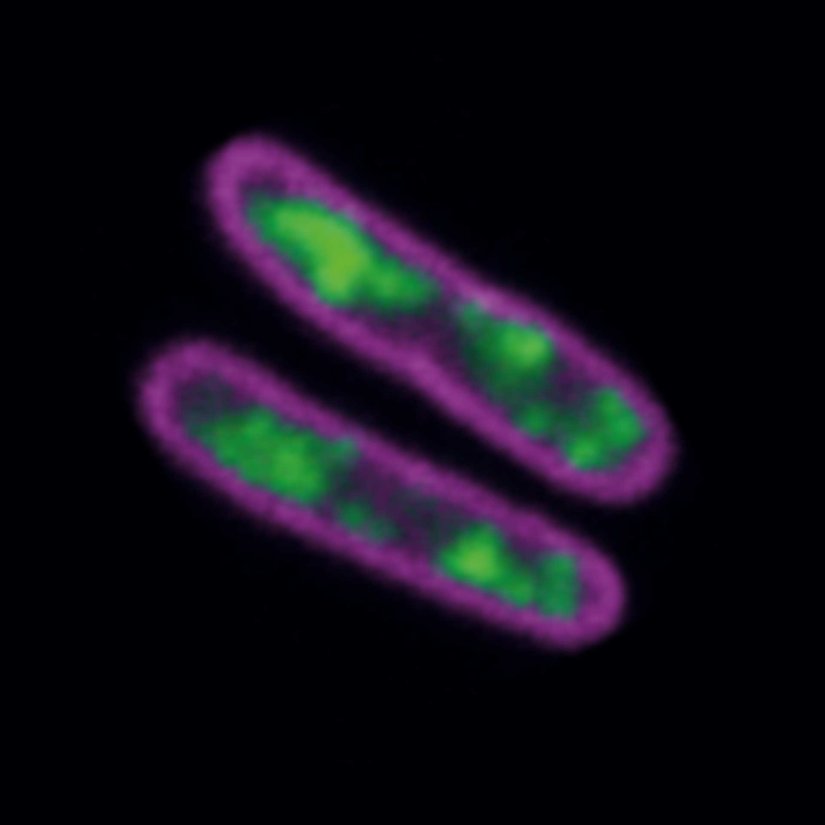
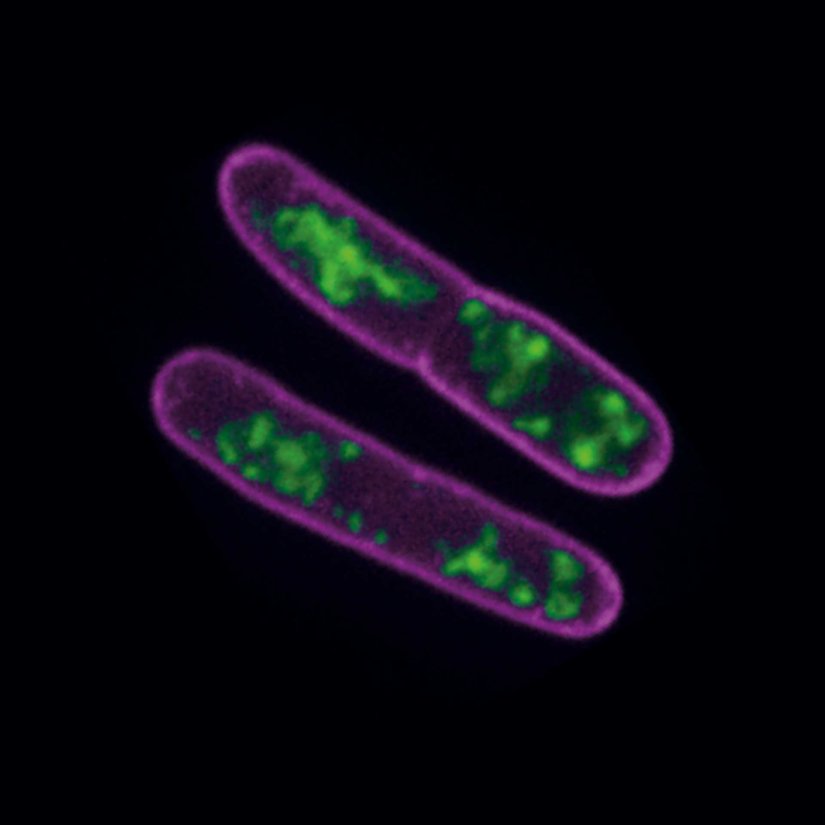
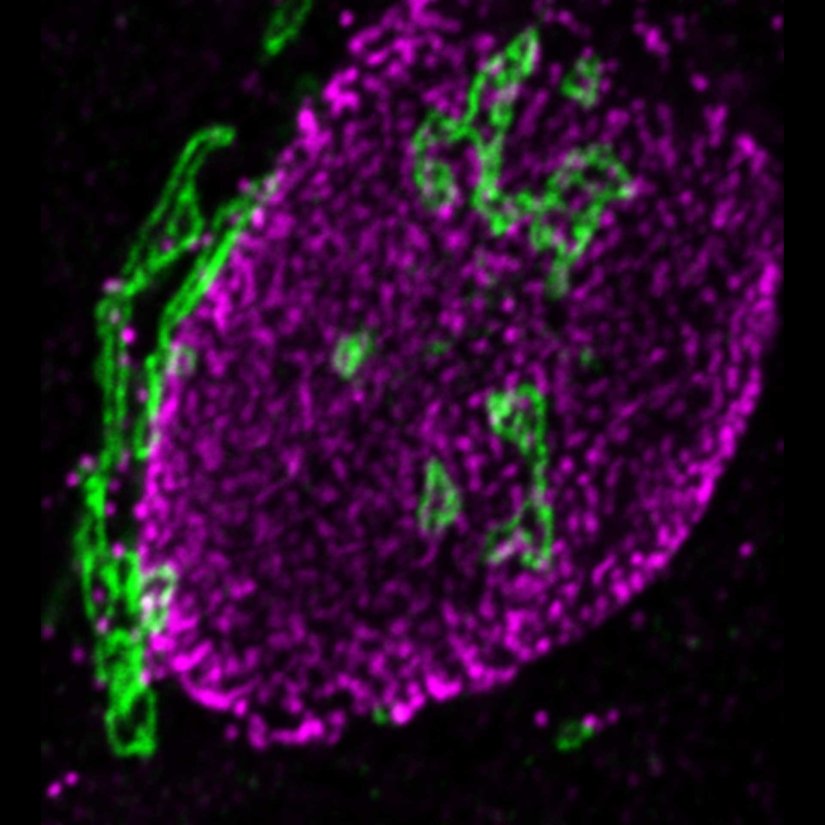
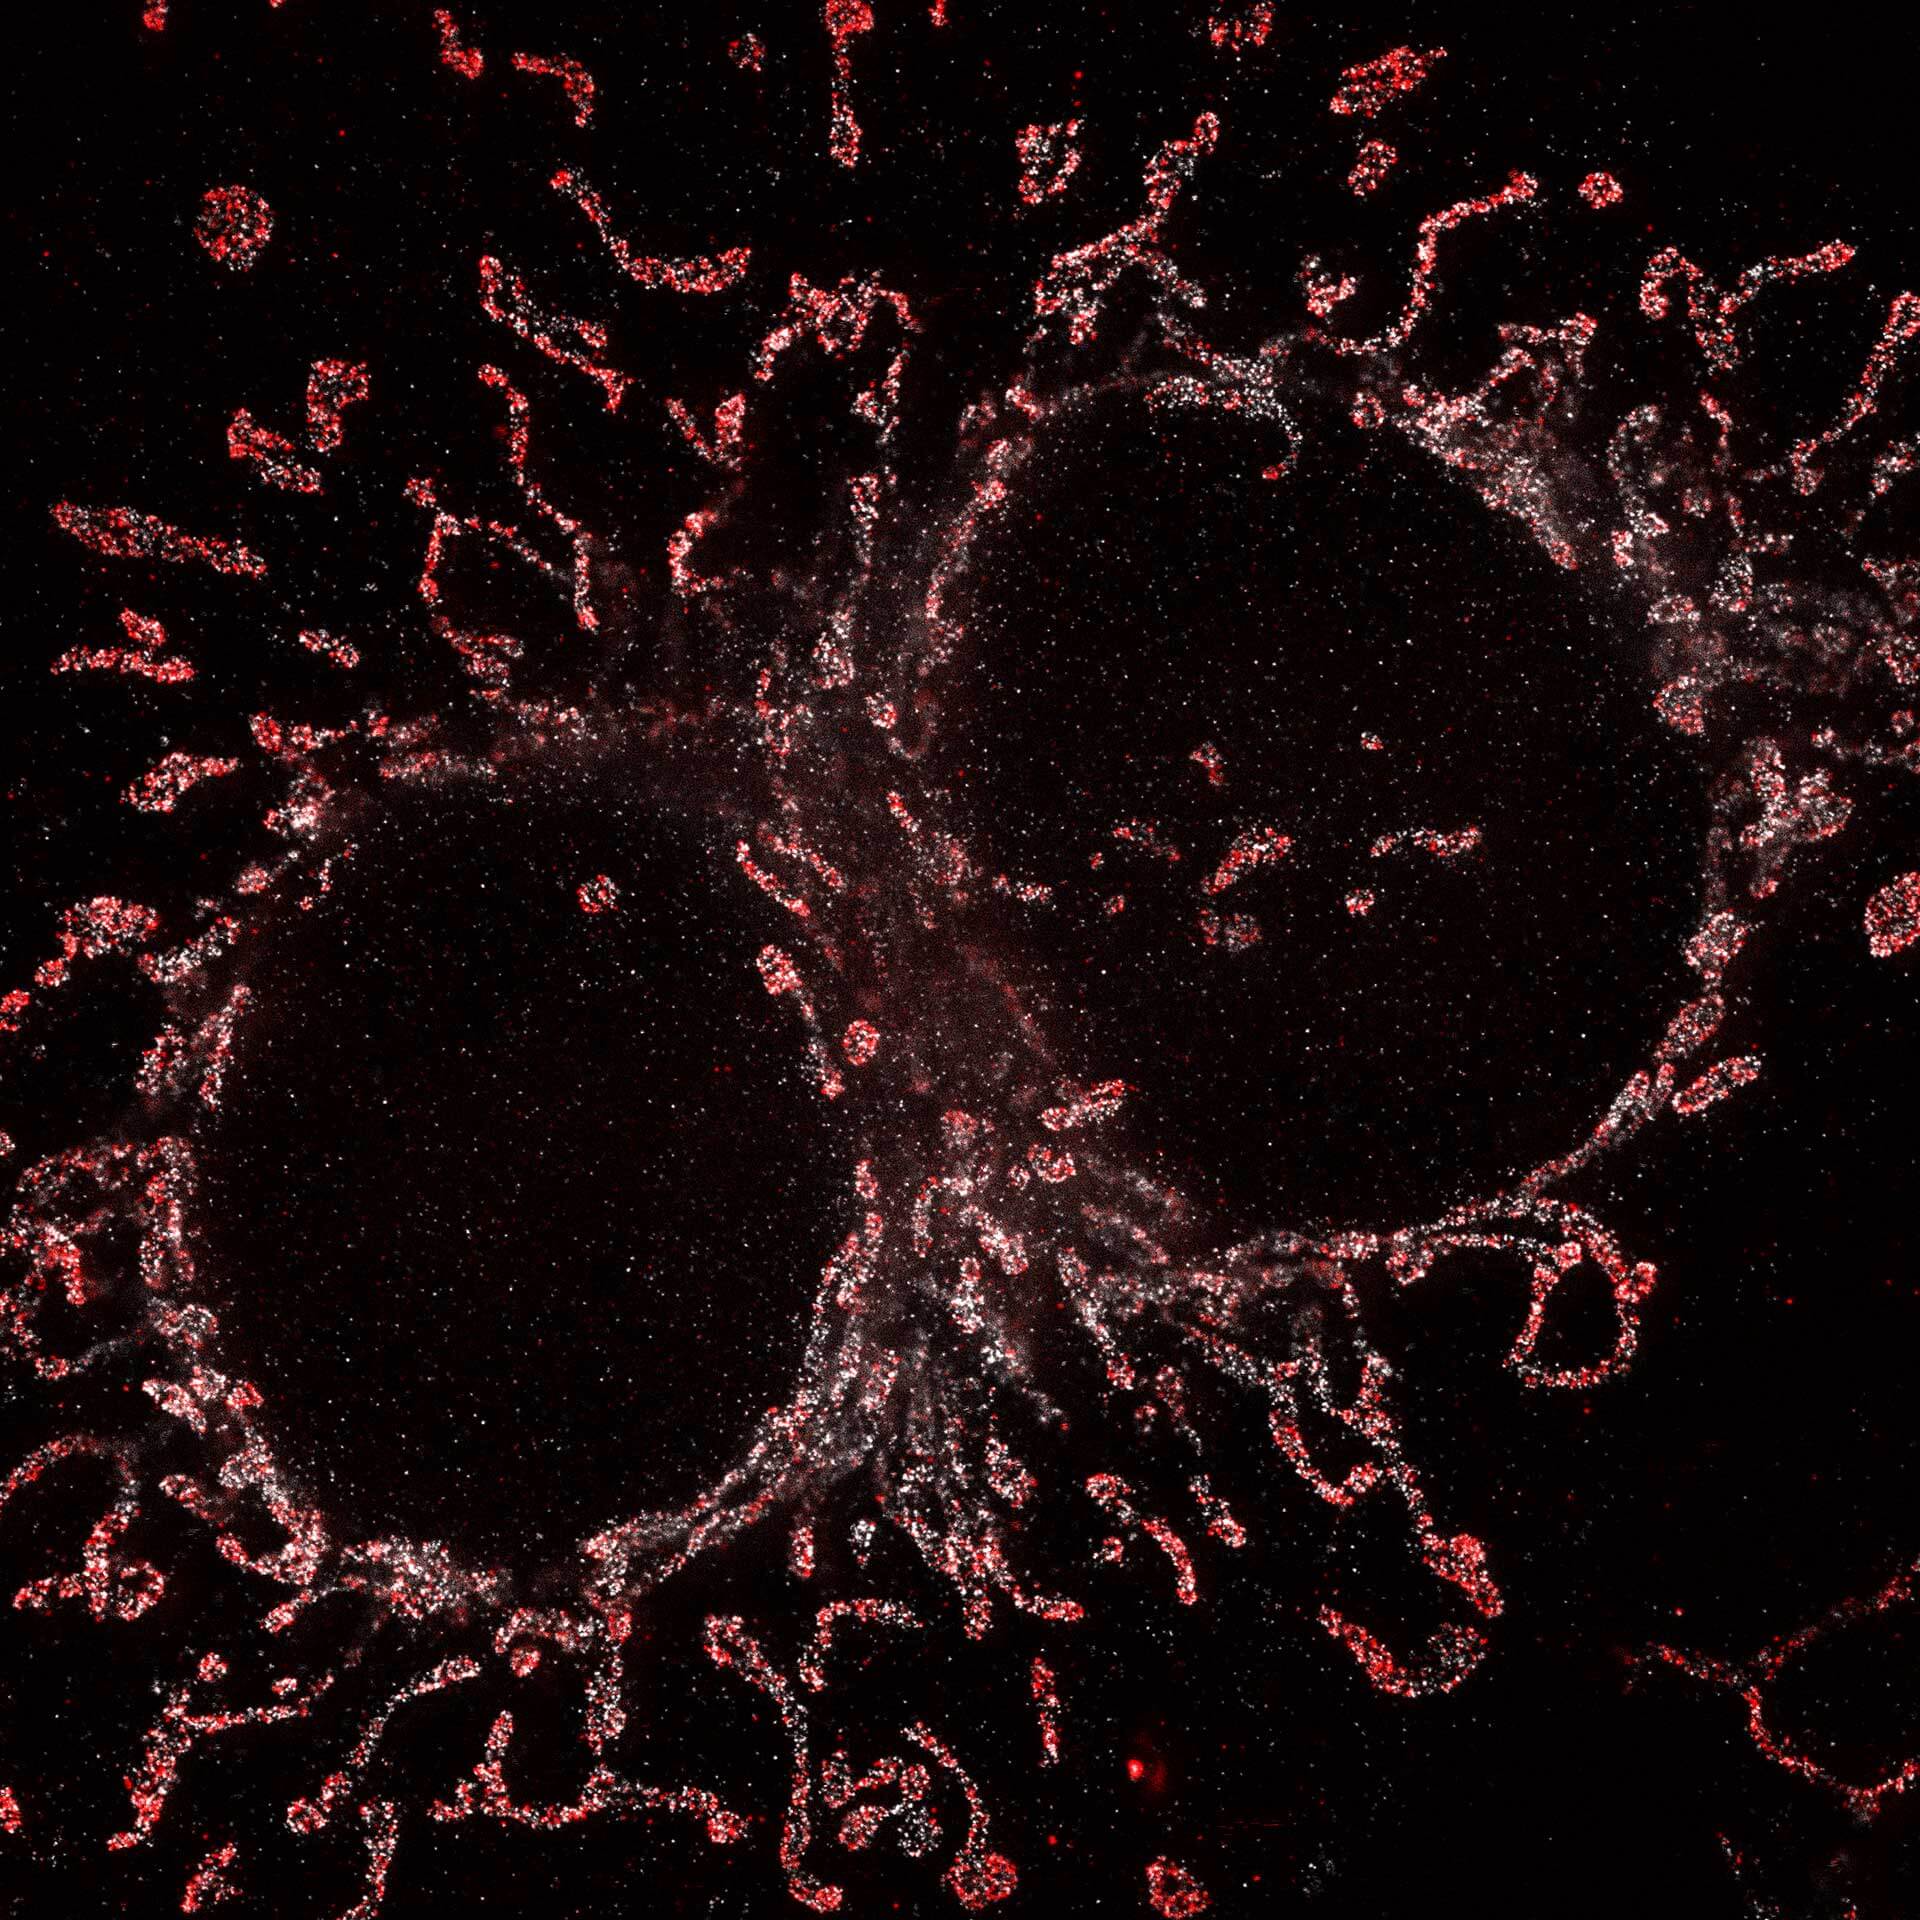
STED-PAINT imaging of bacterial membranes (magenta) and DNA (green) using a high concentration of the exchangeable labels.
Description
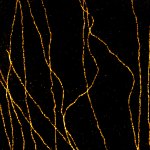
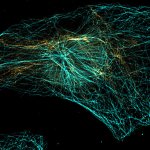
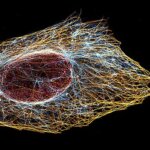
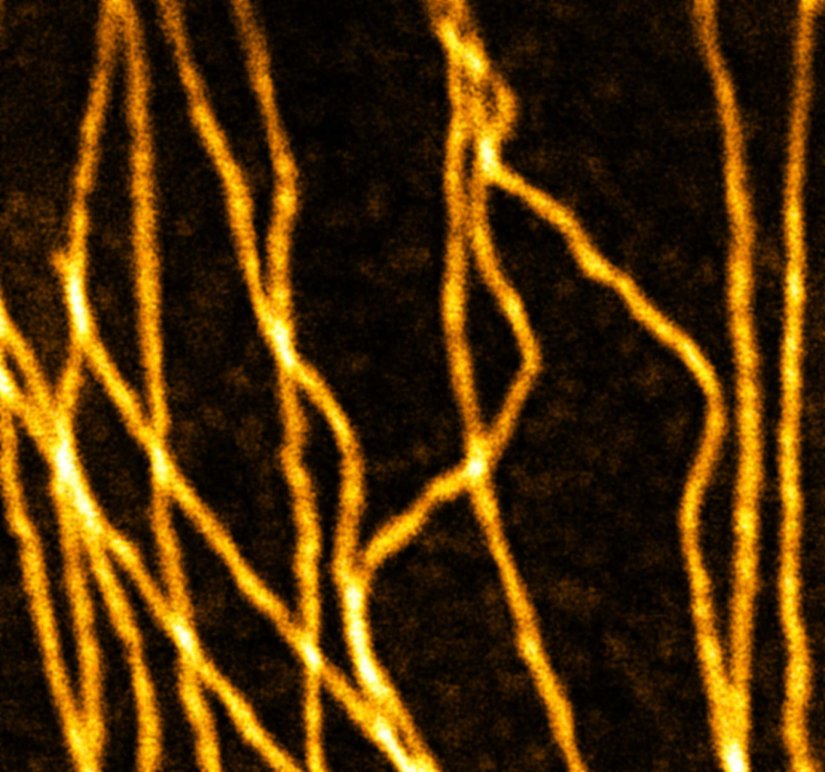
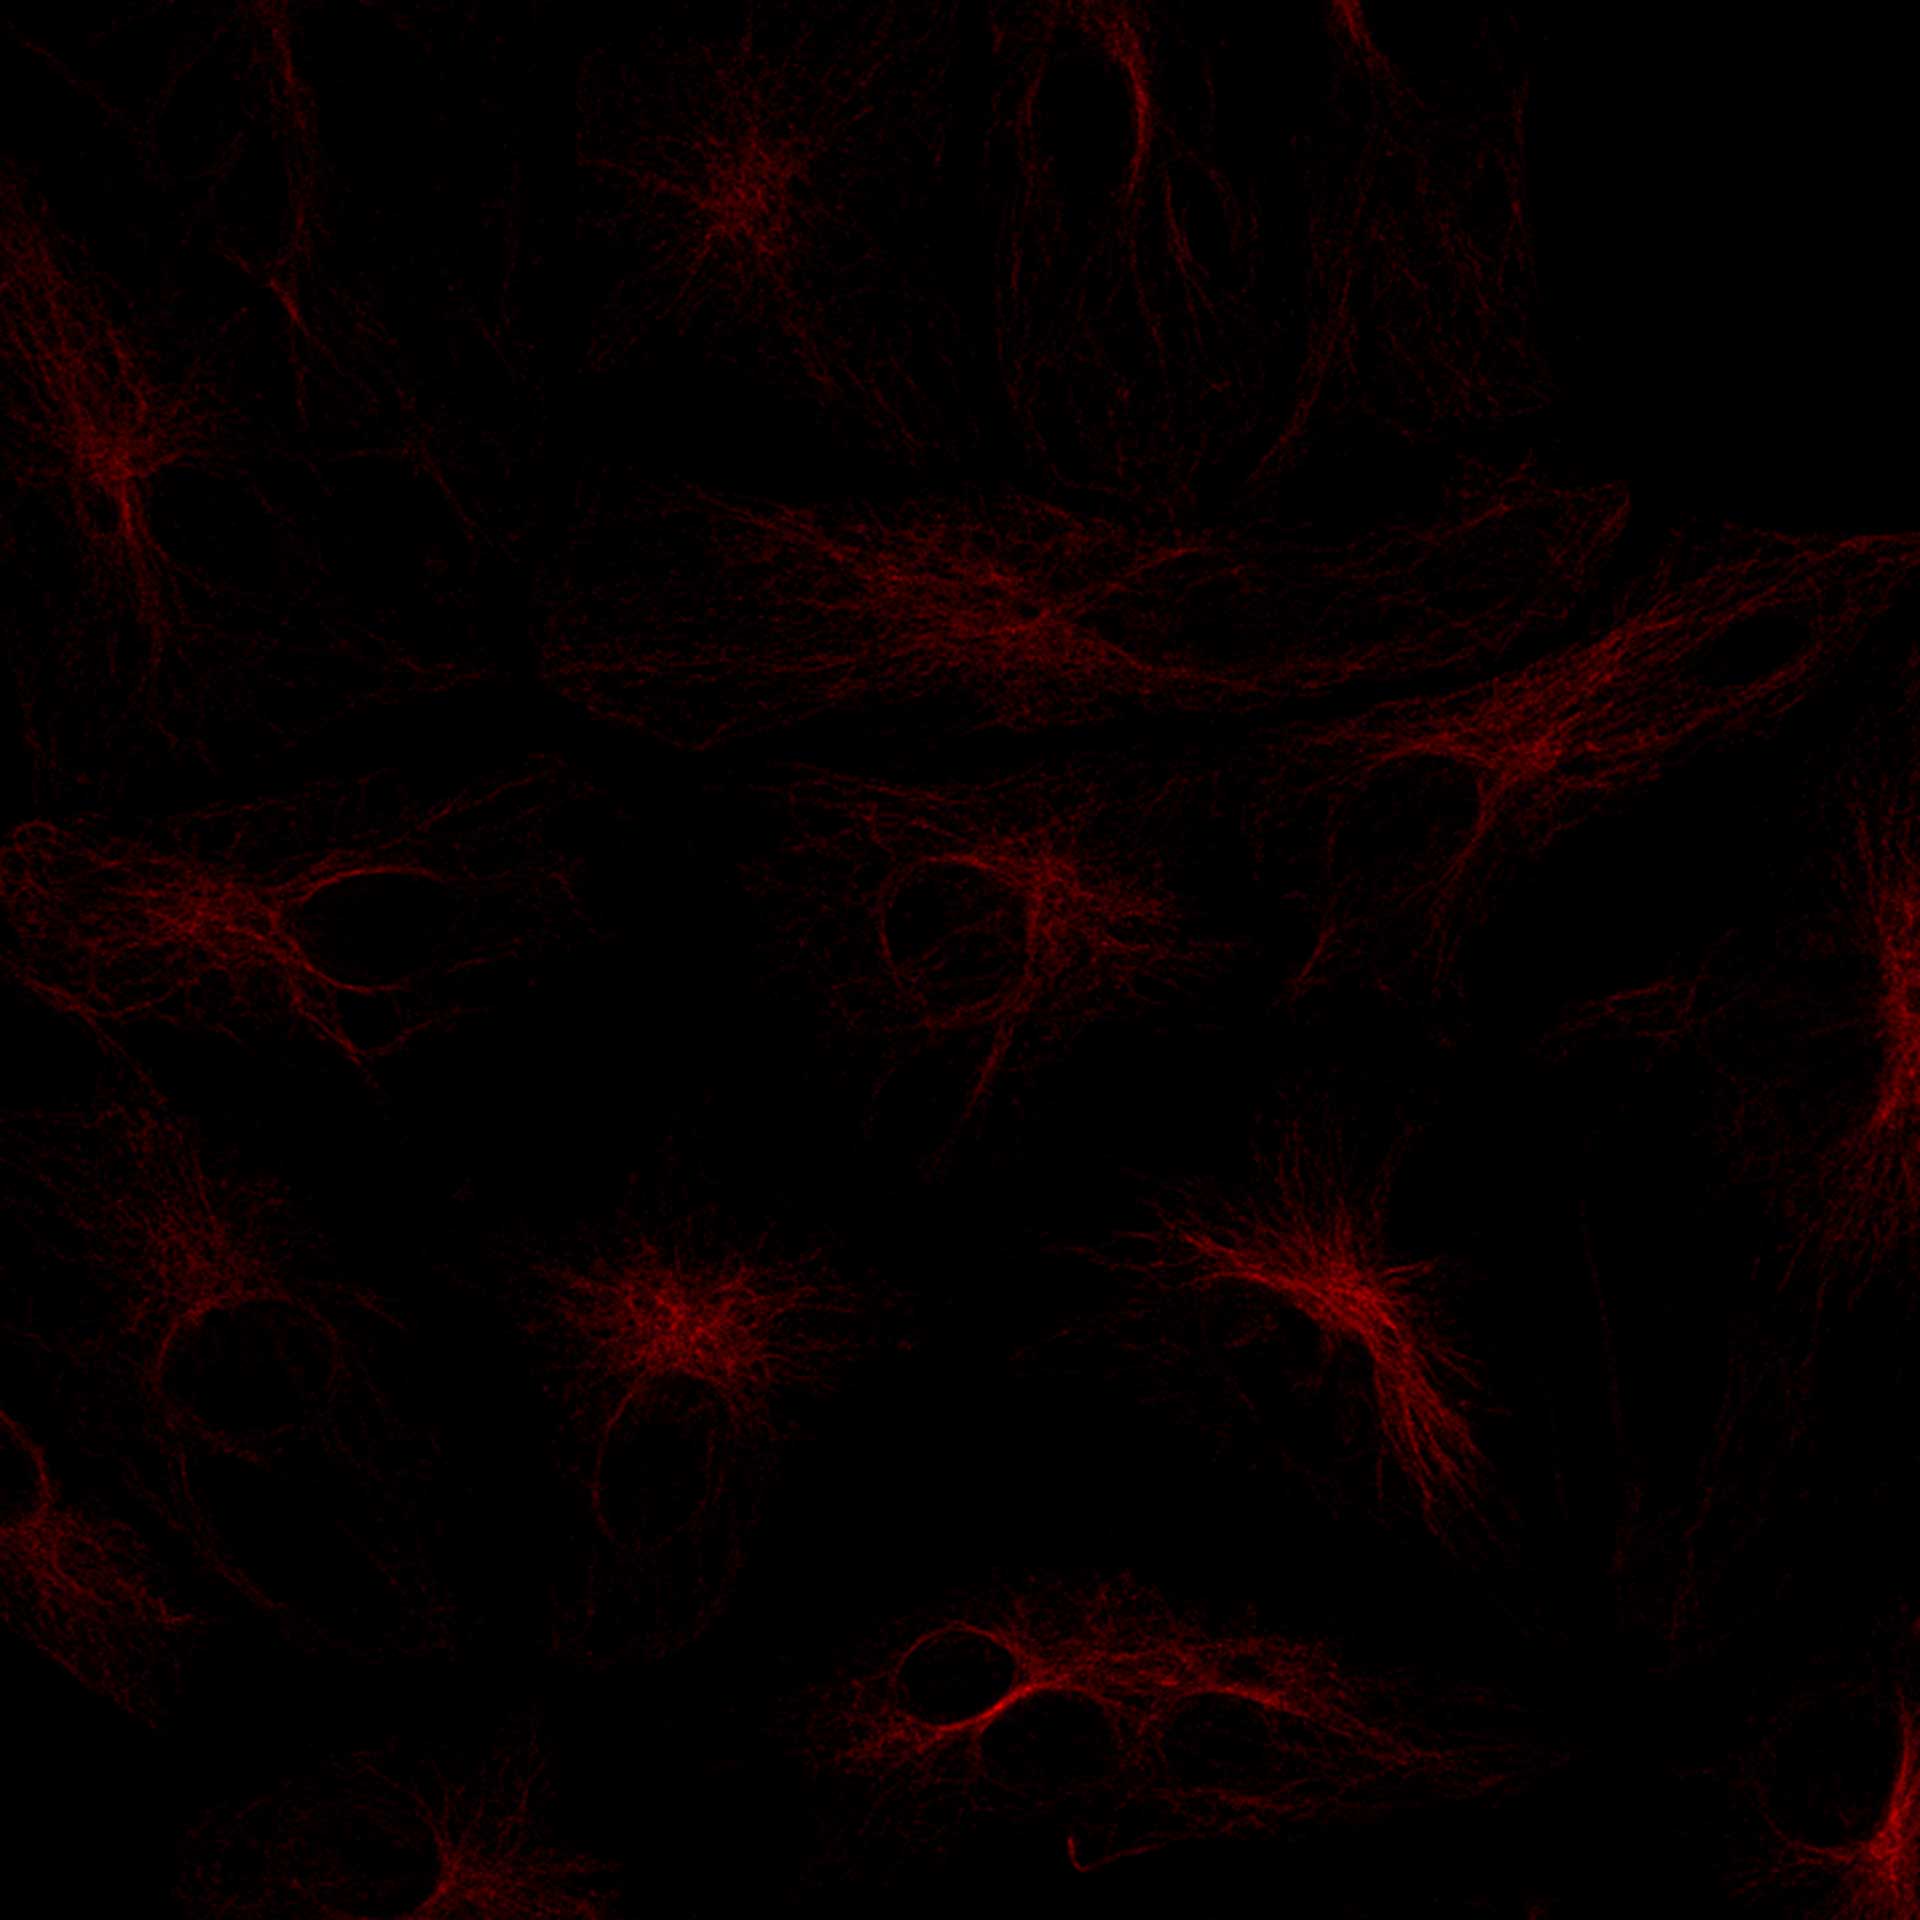
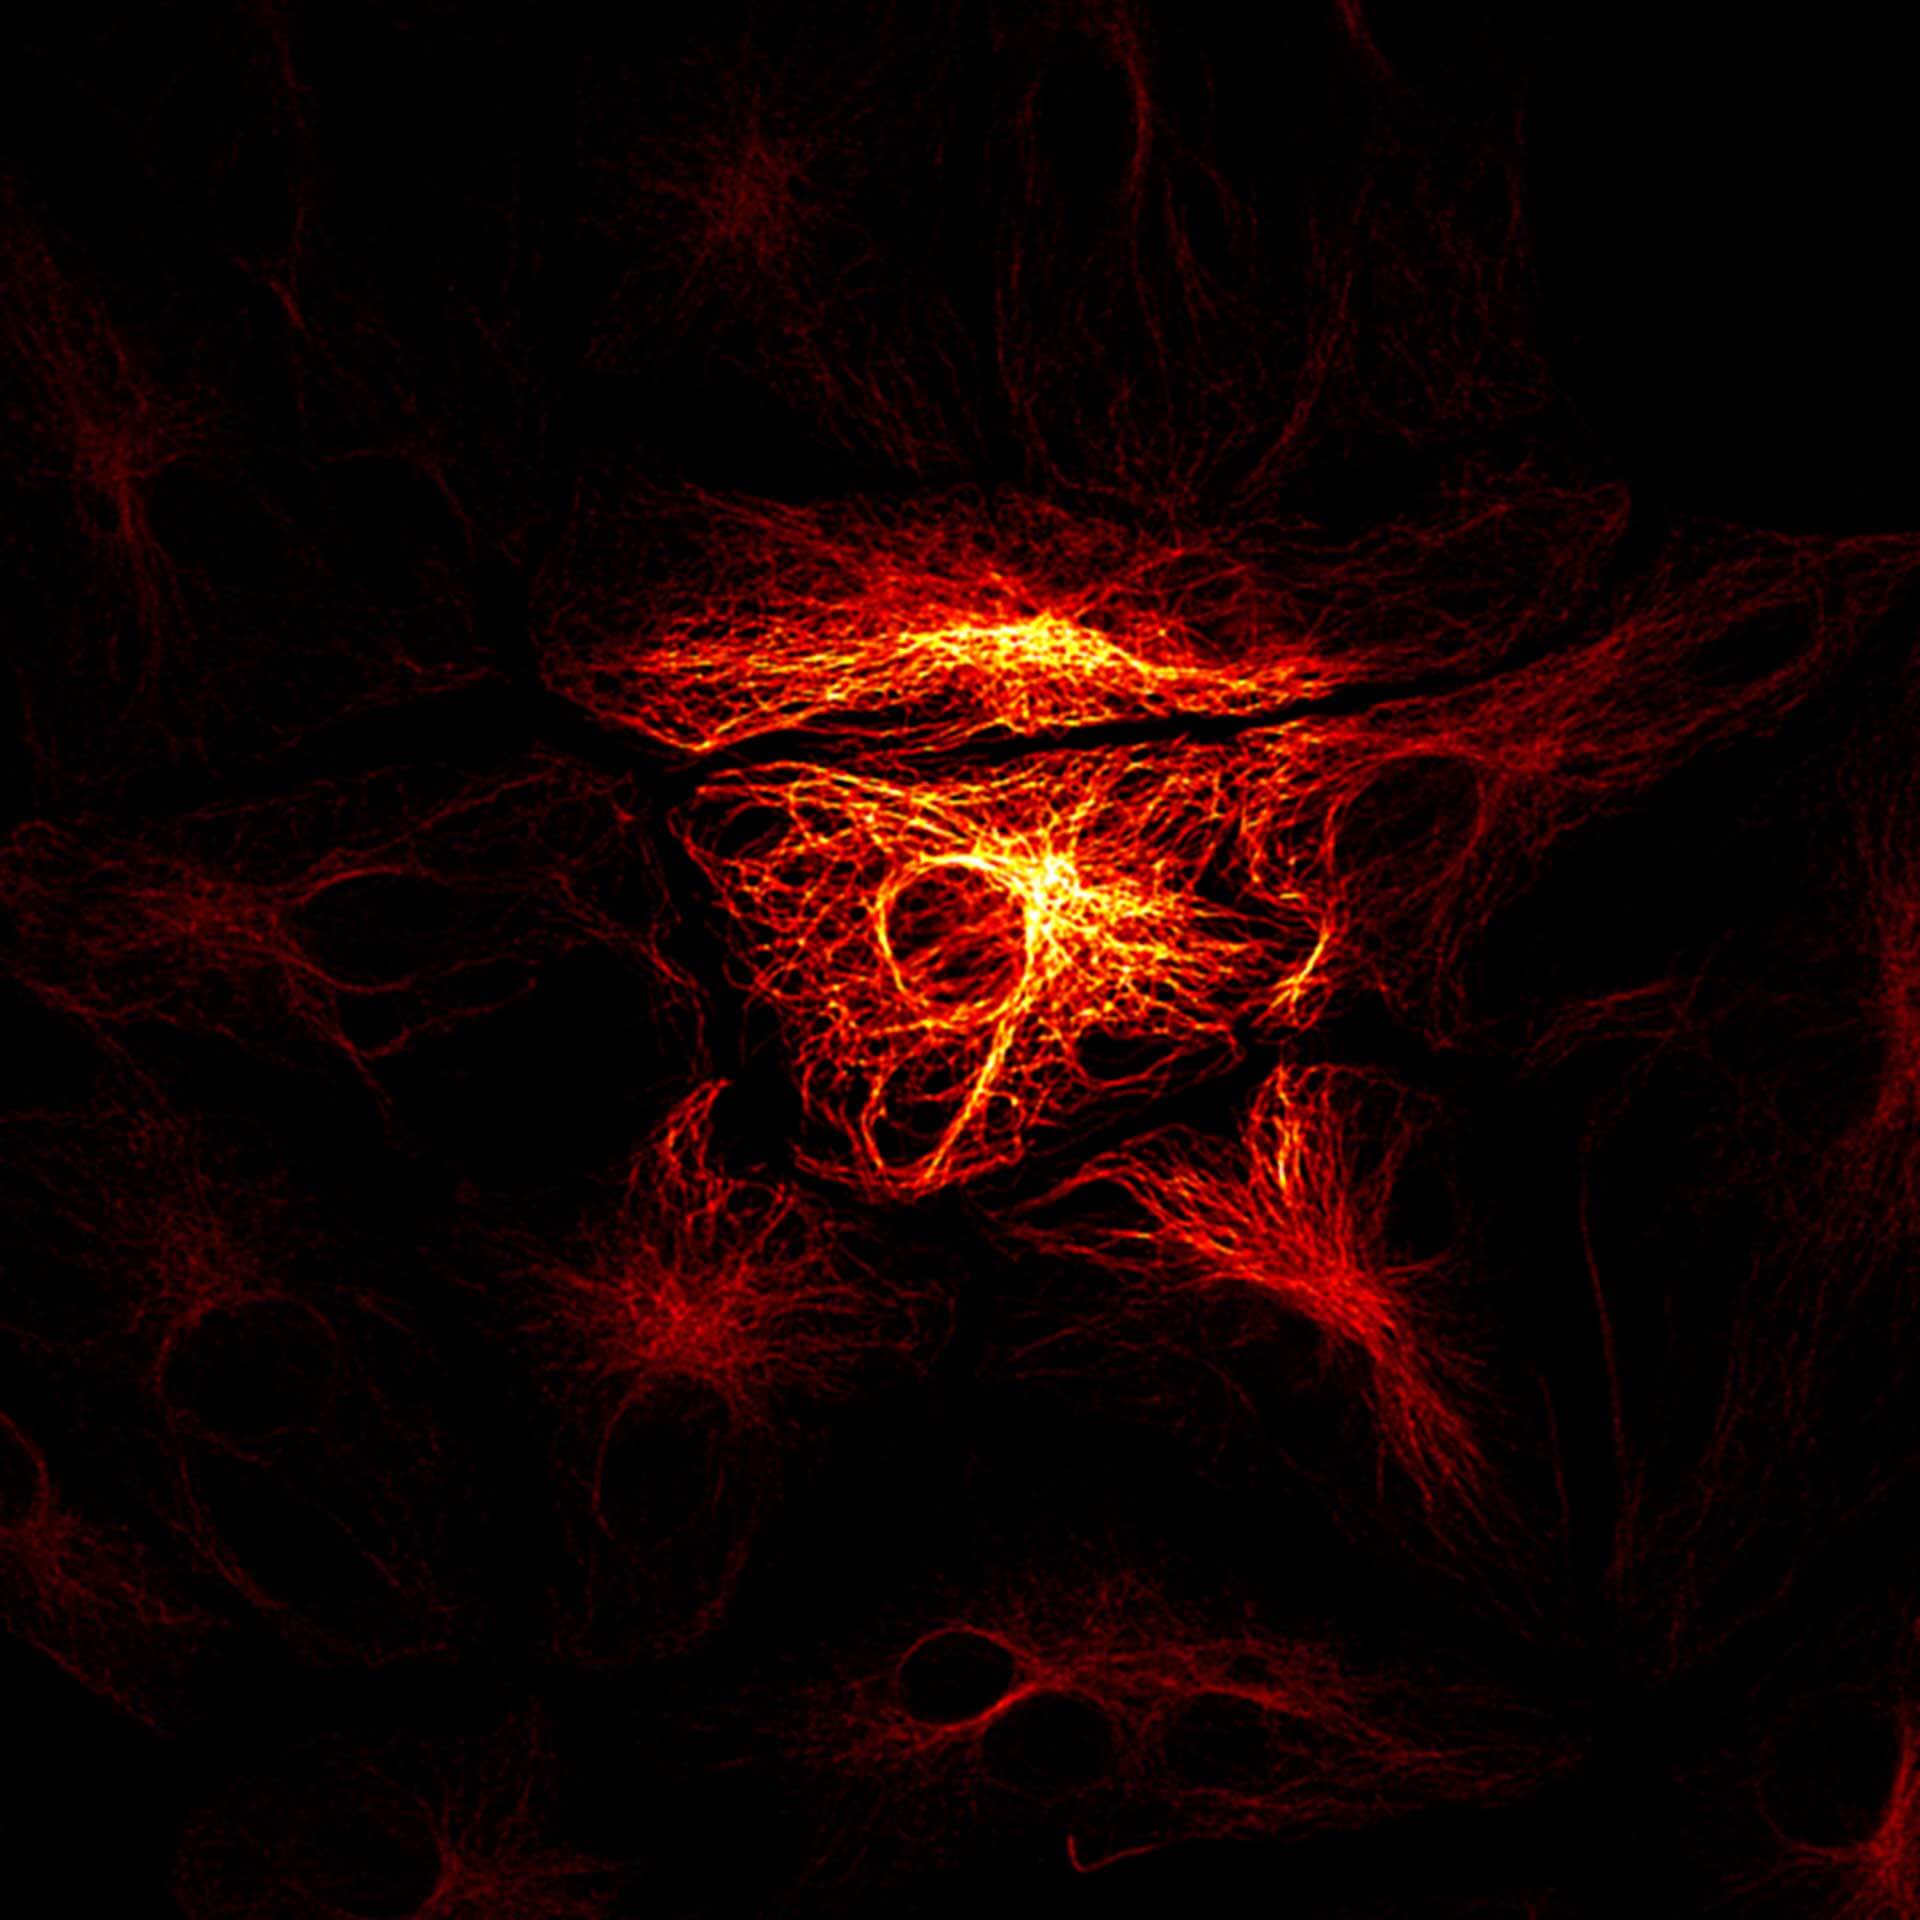
abberior STAR RED was coupled to polyclonal secondary nanobodies (alpaca VHH single domain antibodies) from Jackson ImmunoResearch and used to label tubulin in fixed mammalian cells via indirect immunofluorescence. The STED image was acquired with the STEDYCON system.

Description
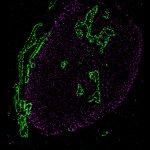
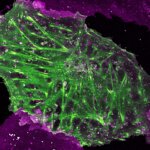
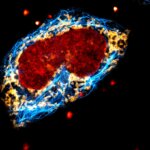
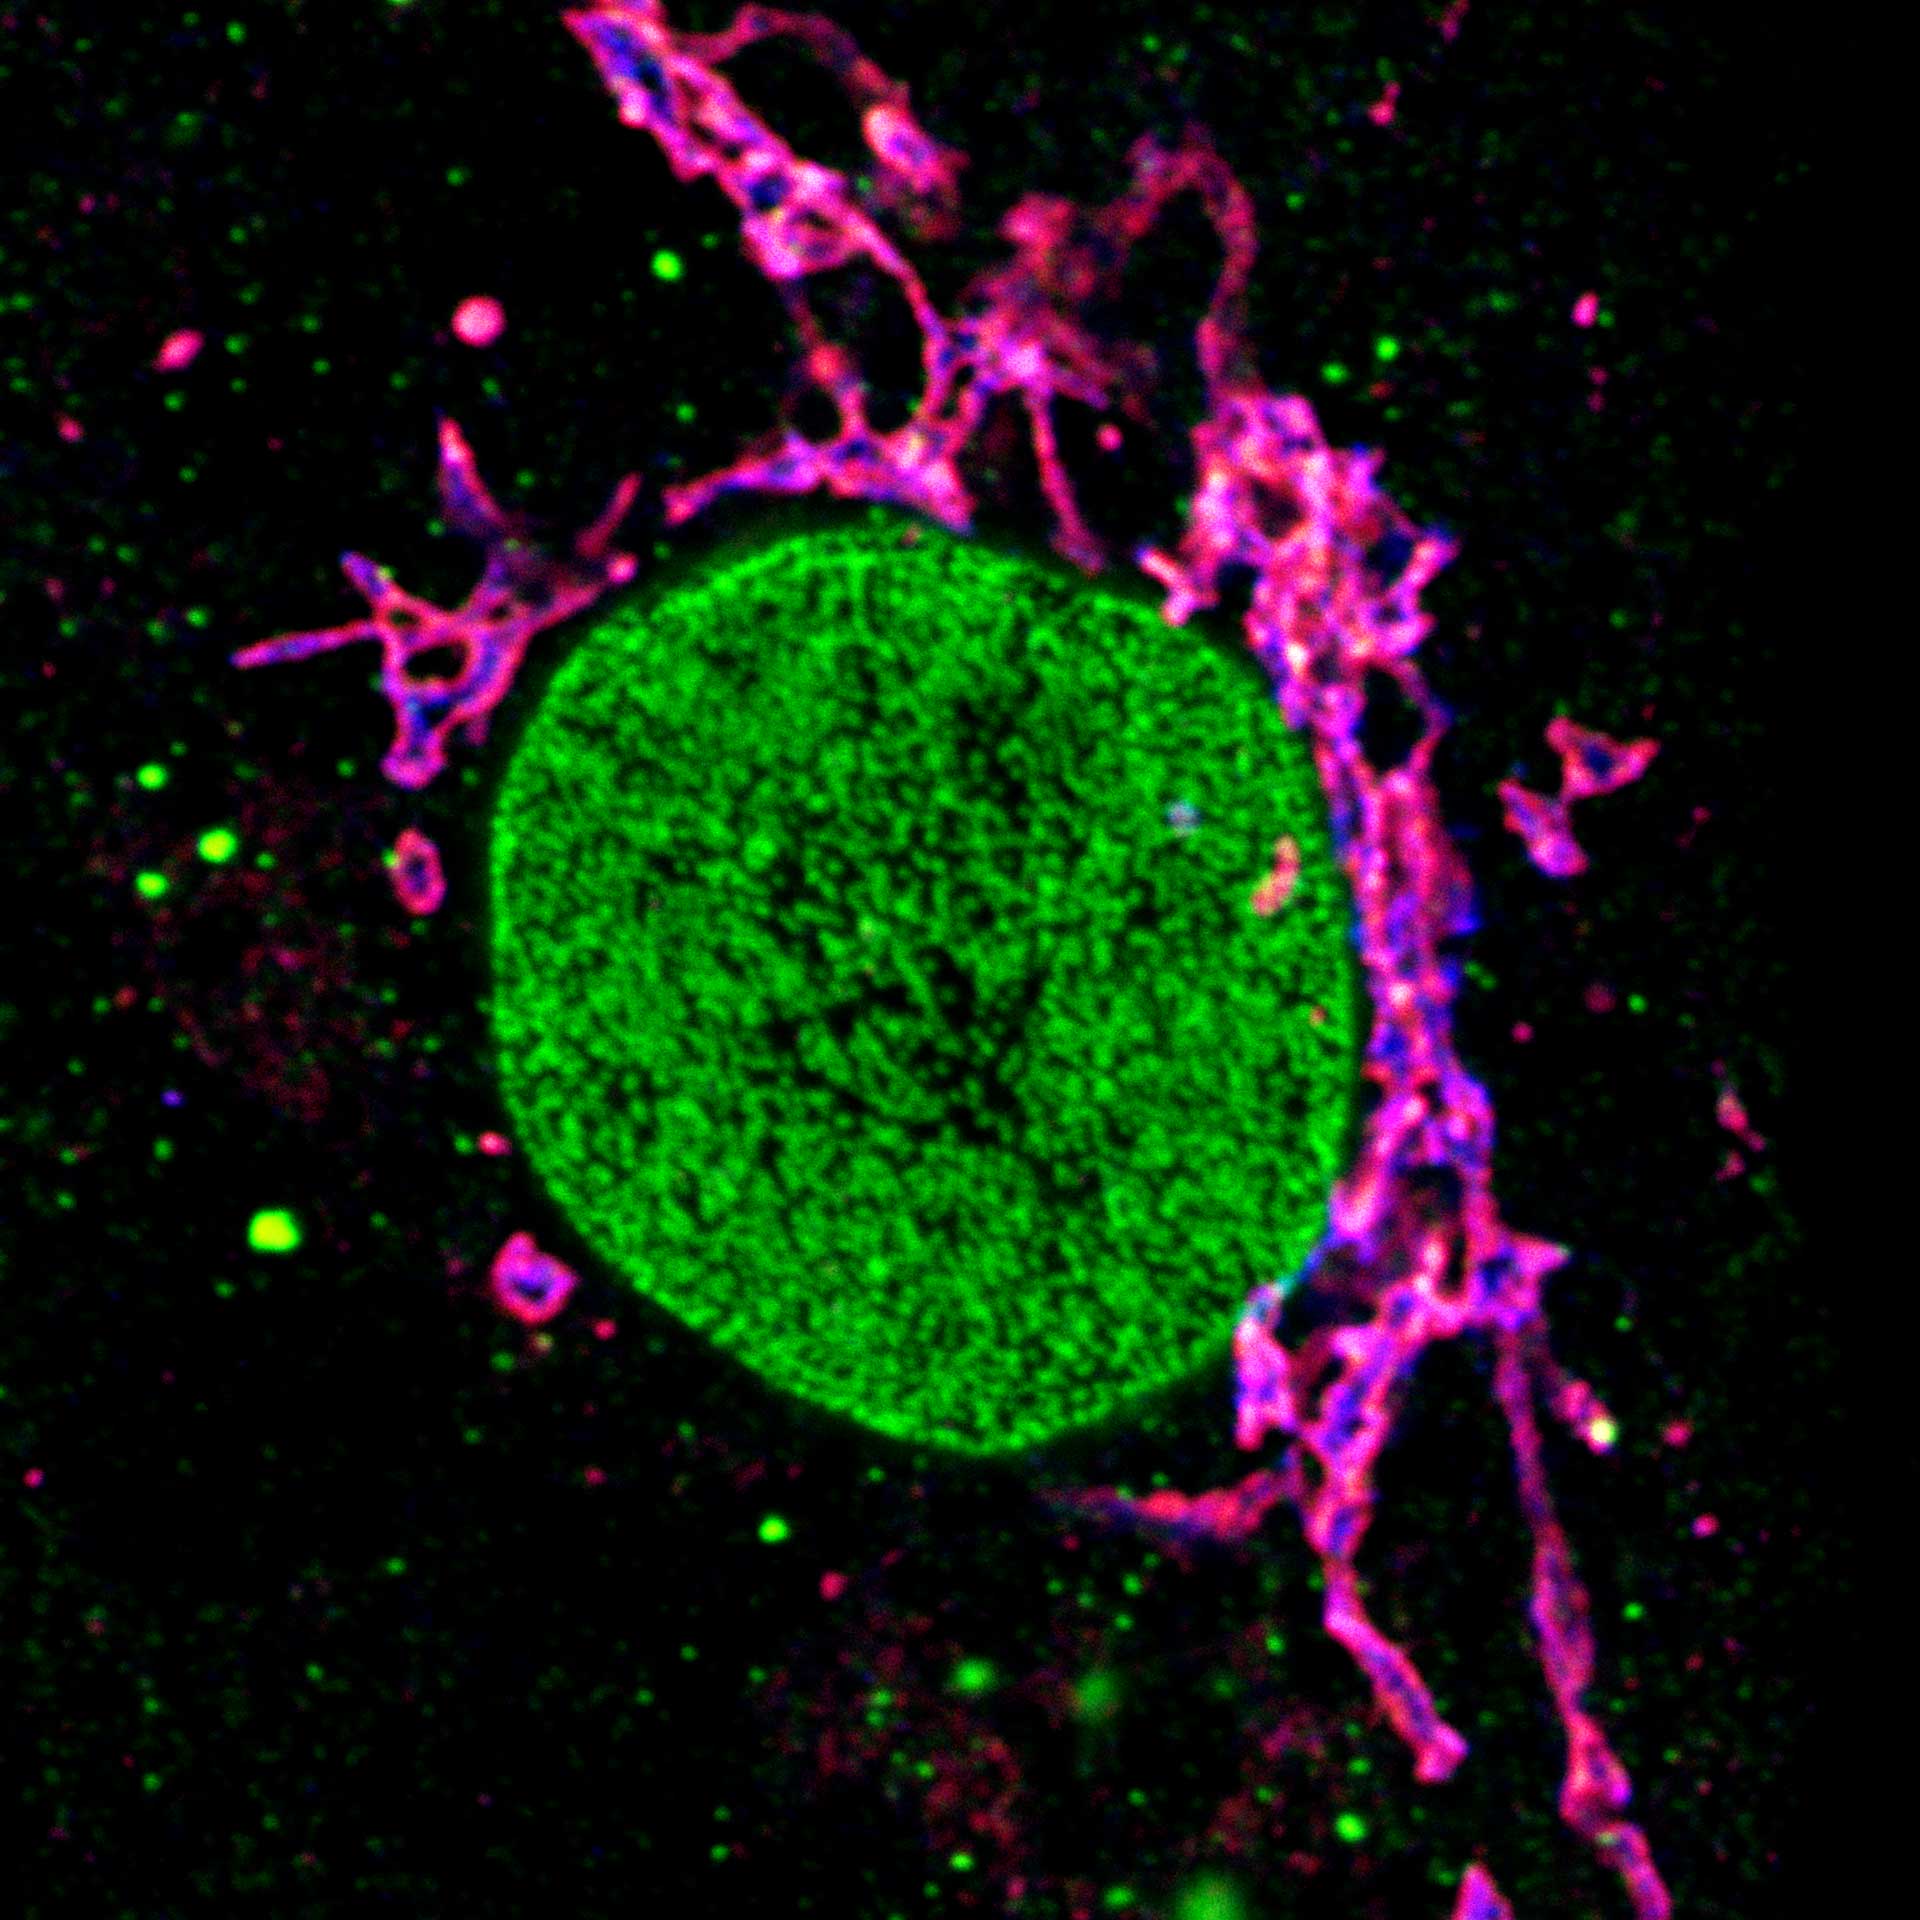
Proteins of the nuclear pore complex and the golgi apparatus were stained by indirect immunofluorescence using abberior STAR RED (nuclear pore complex, magenta) and abberior STAR 580 (golgi, green) coupled to polyclonal secondary nanobodies (alpaca VHH single domain antibodies) from Jackson ImmunoResearch. Images of the fixed mammalian cells were acquired with the STEDYCON.
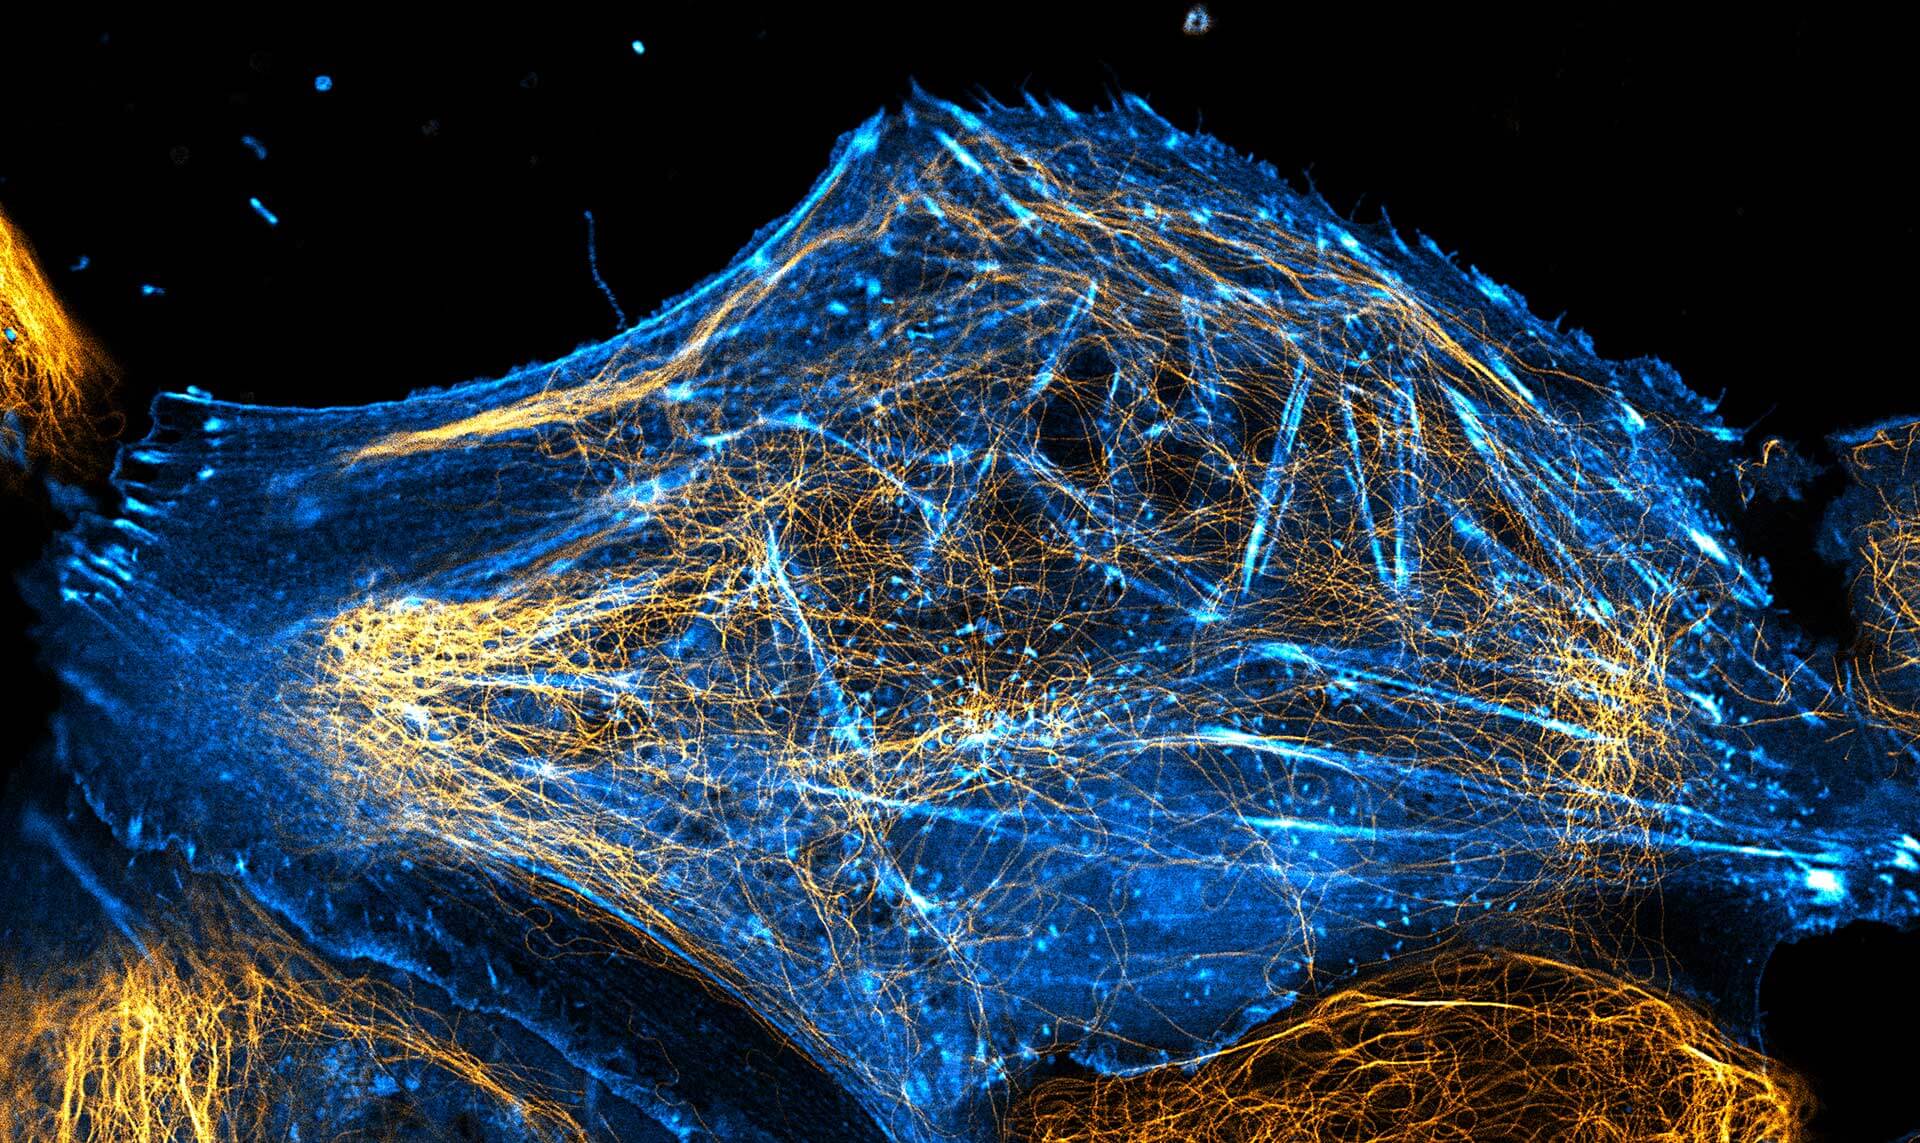
Description
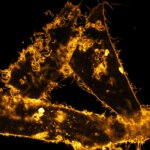
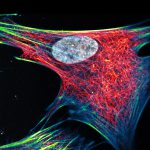
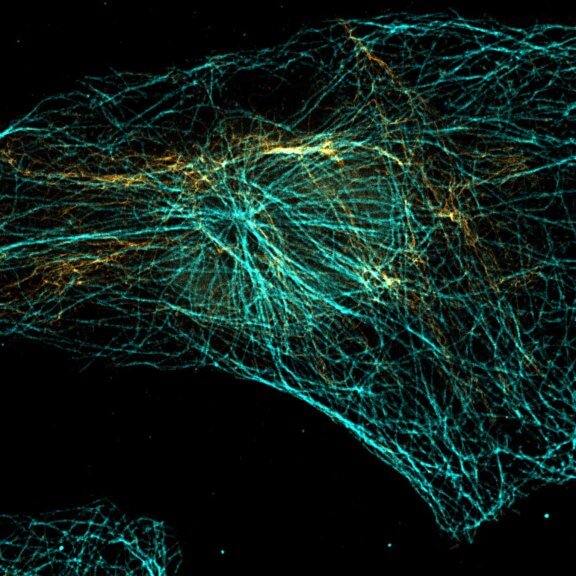
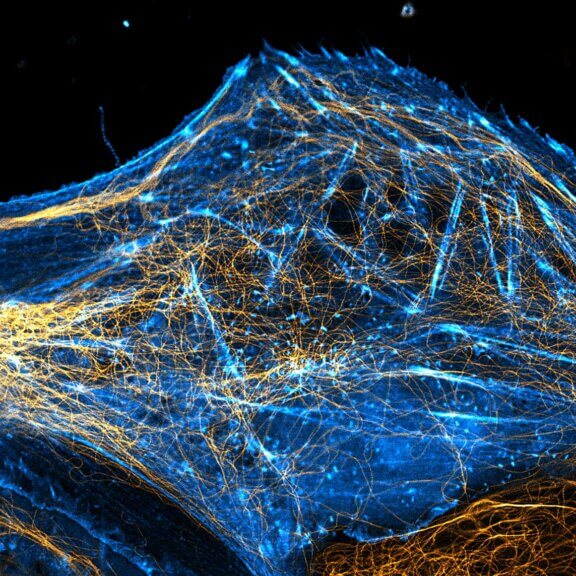
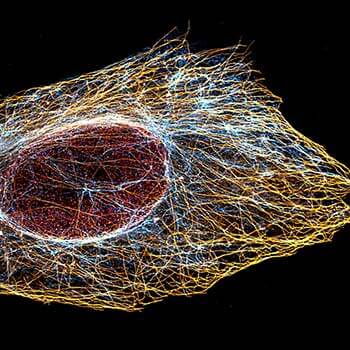
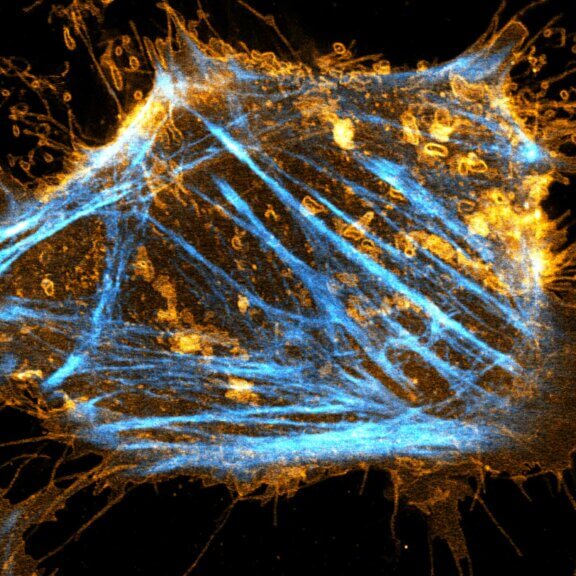
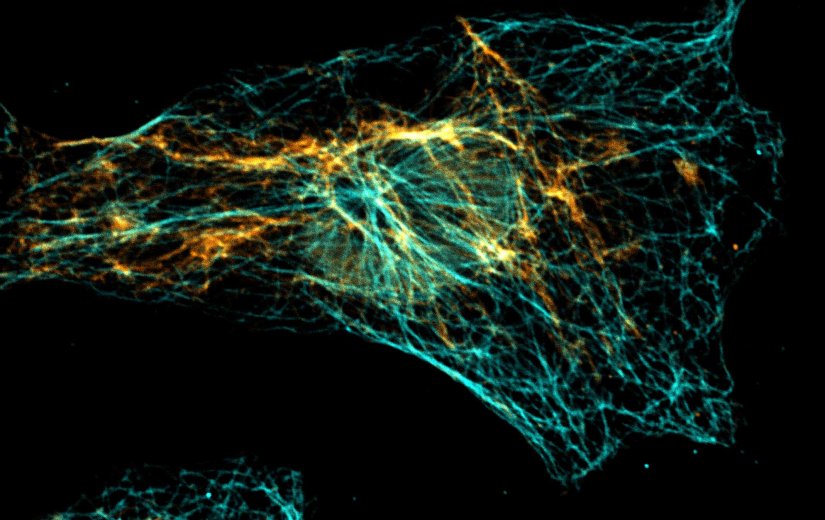
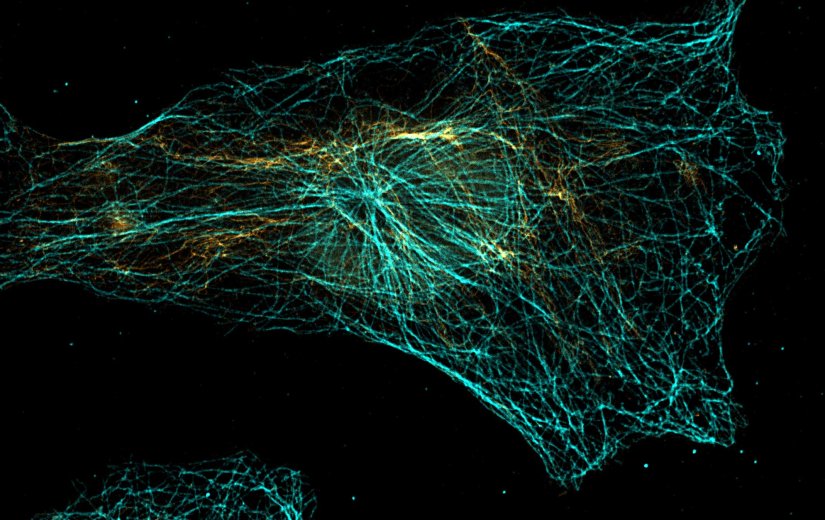
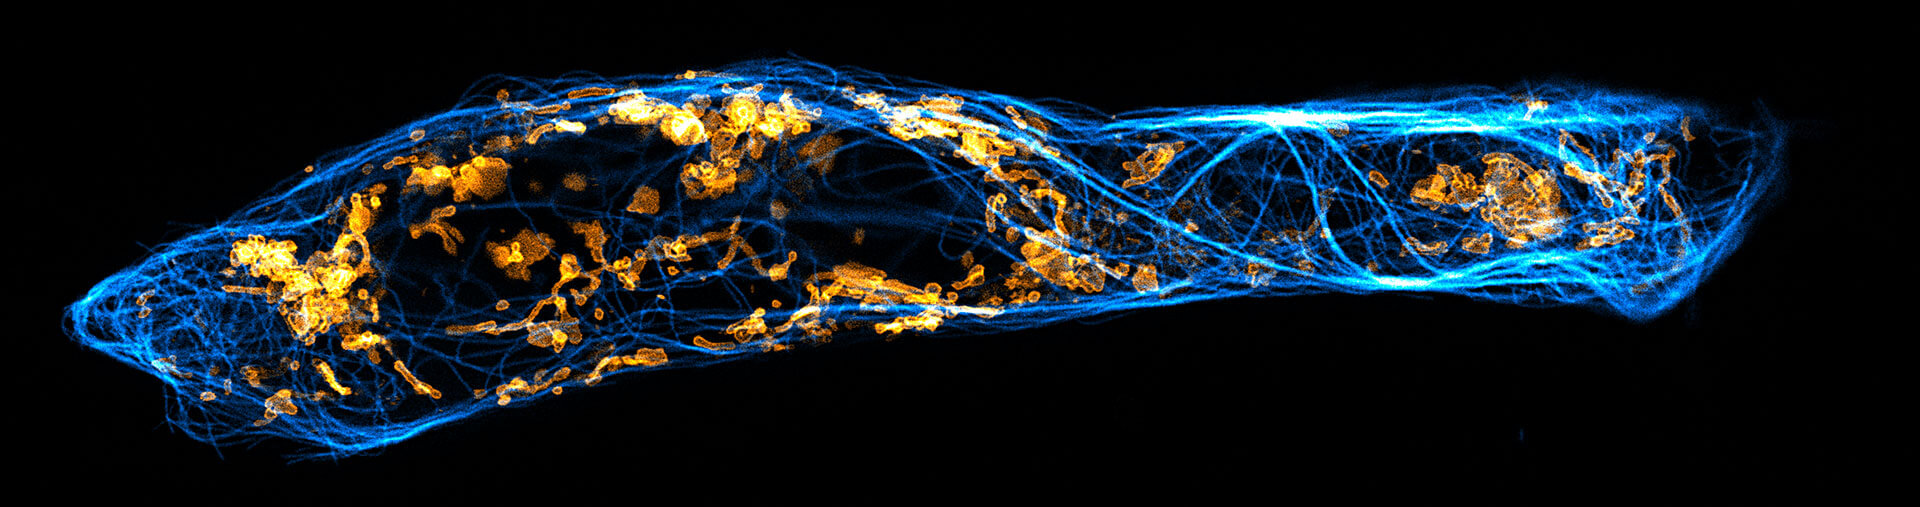
Vimentin and tubulin were stained by indirect immunofluorescence using abberior STAR RED (vimentin, orange) and abberior STAR 580 (tubulin, cyan) coupled to polyclonal secondary nanobodies (alpaca VHH single domain antibodies) from Jackson ImmunoResearch. Images of the fixed mammalian cells were acquired with the STEDYCON.
Description
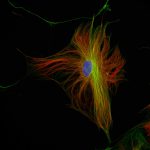
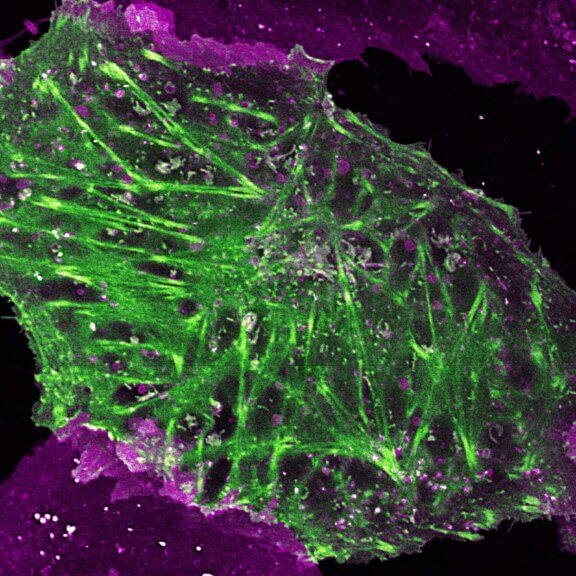
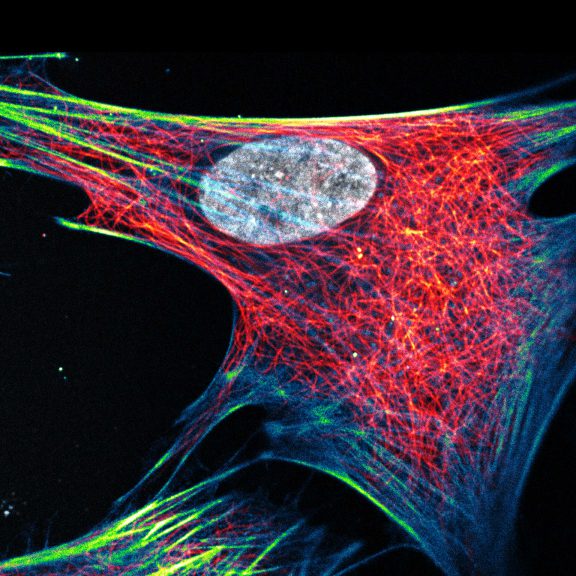
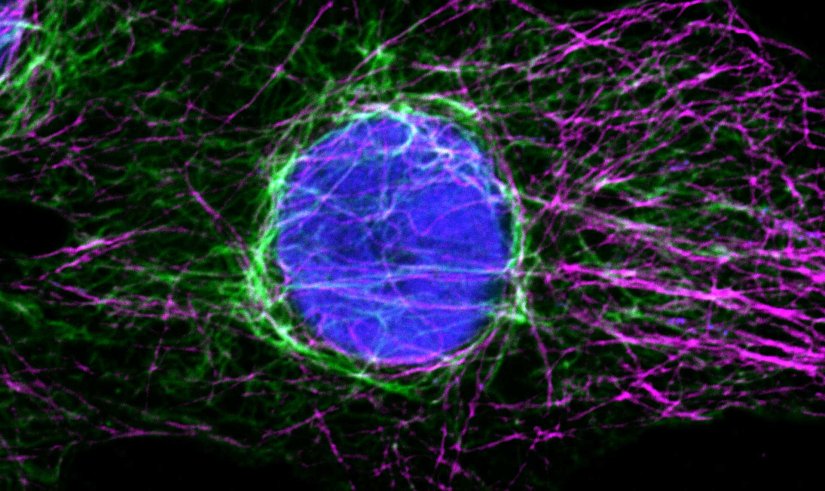
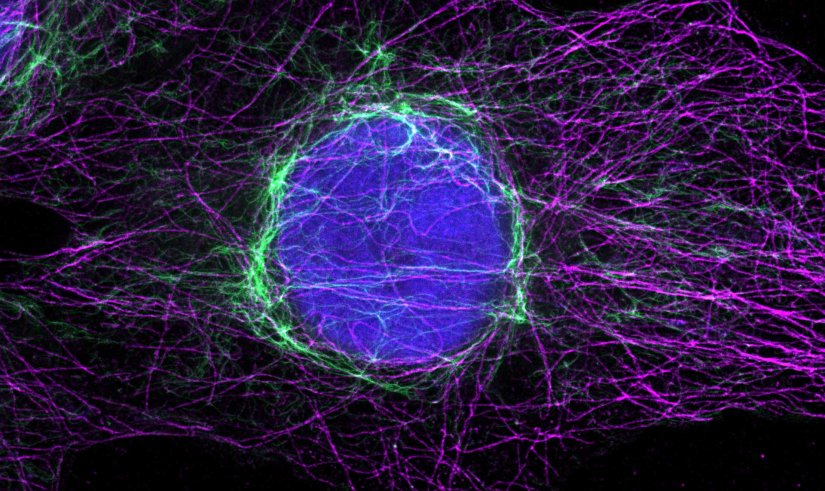
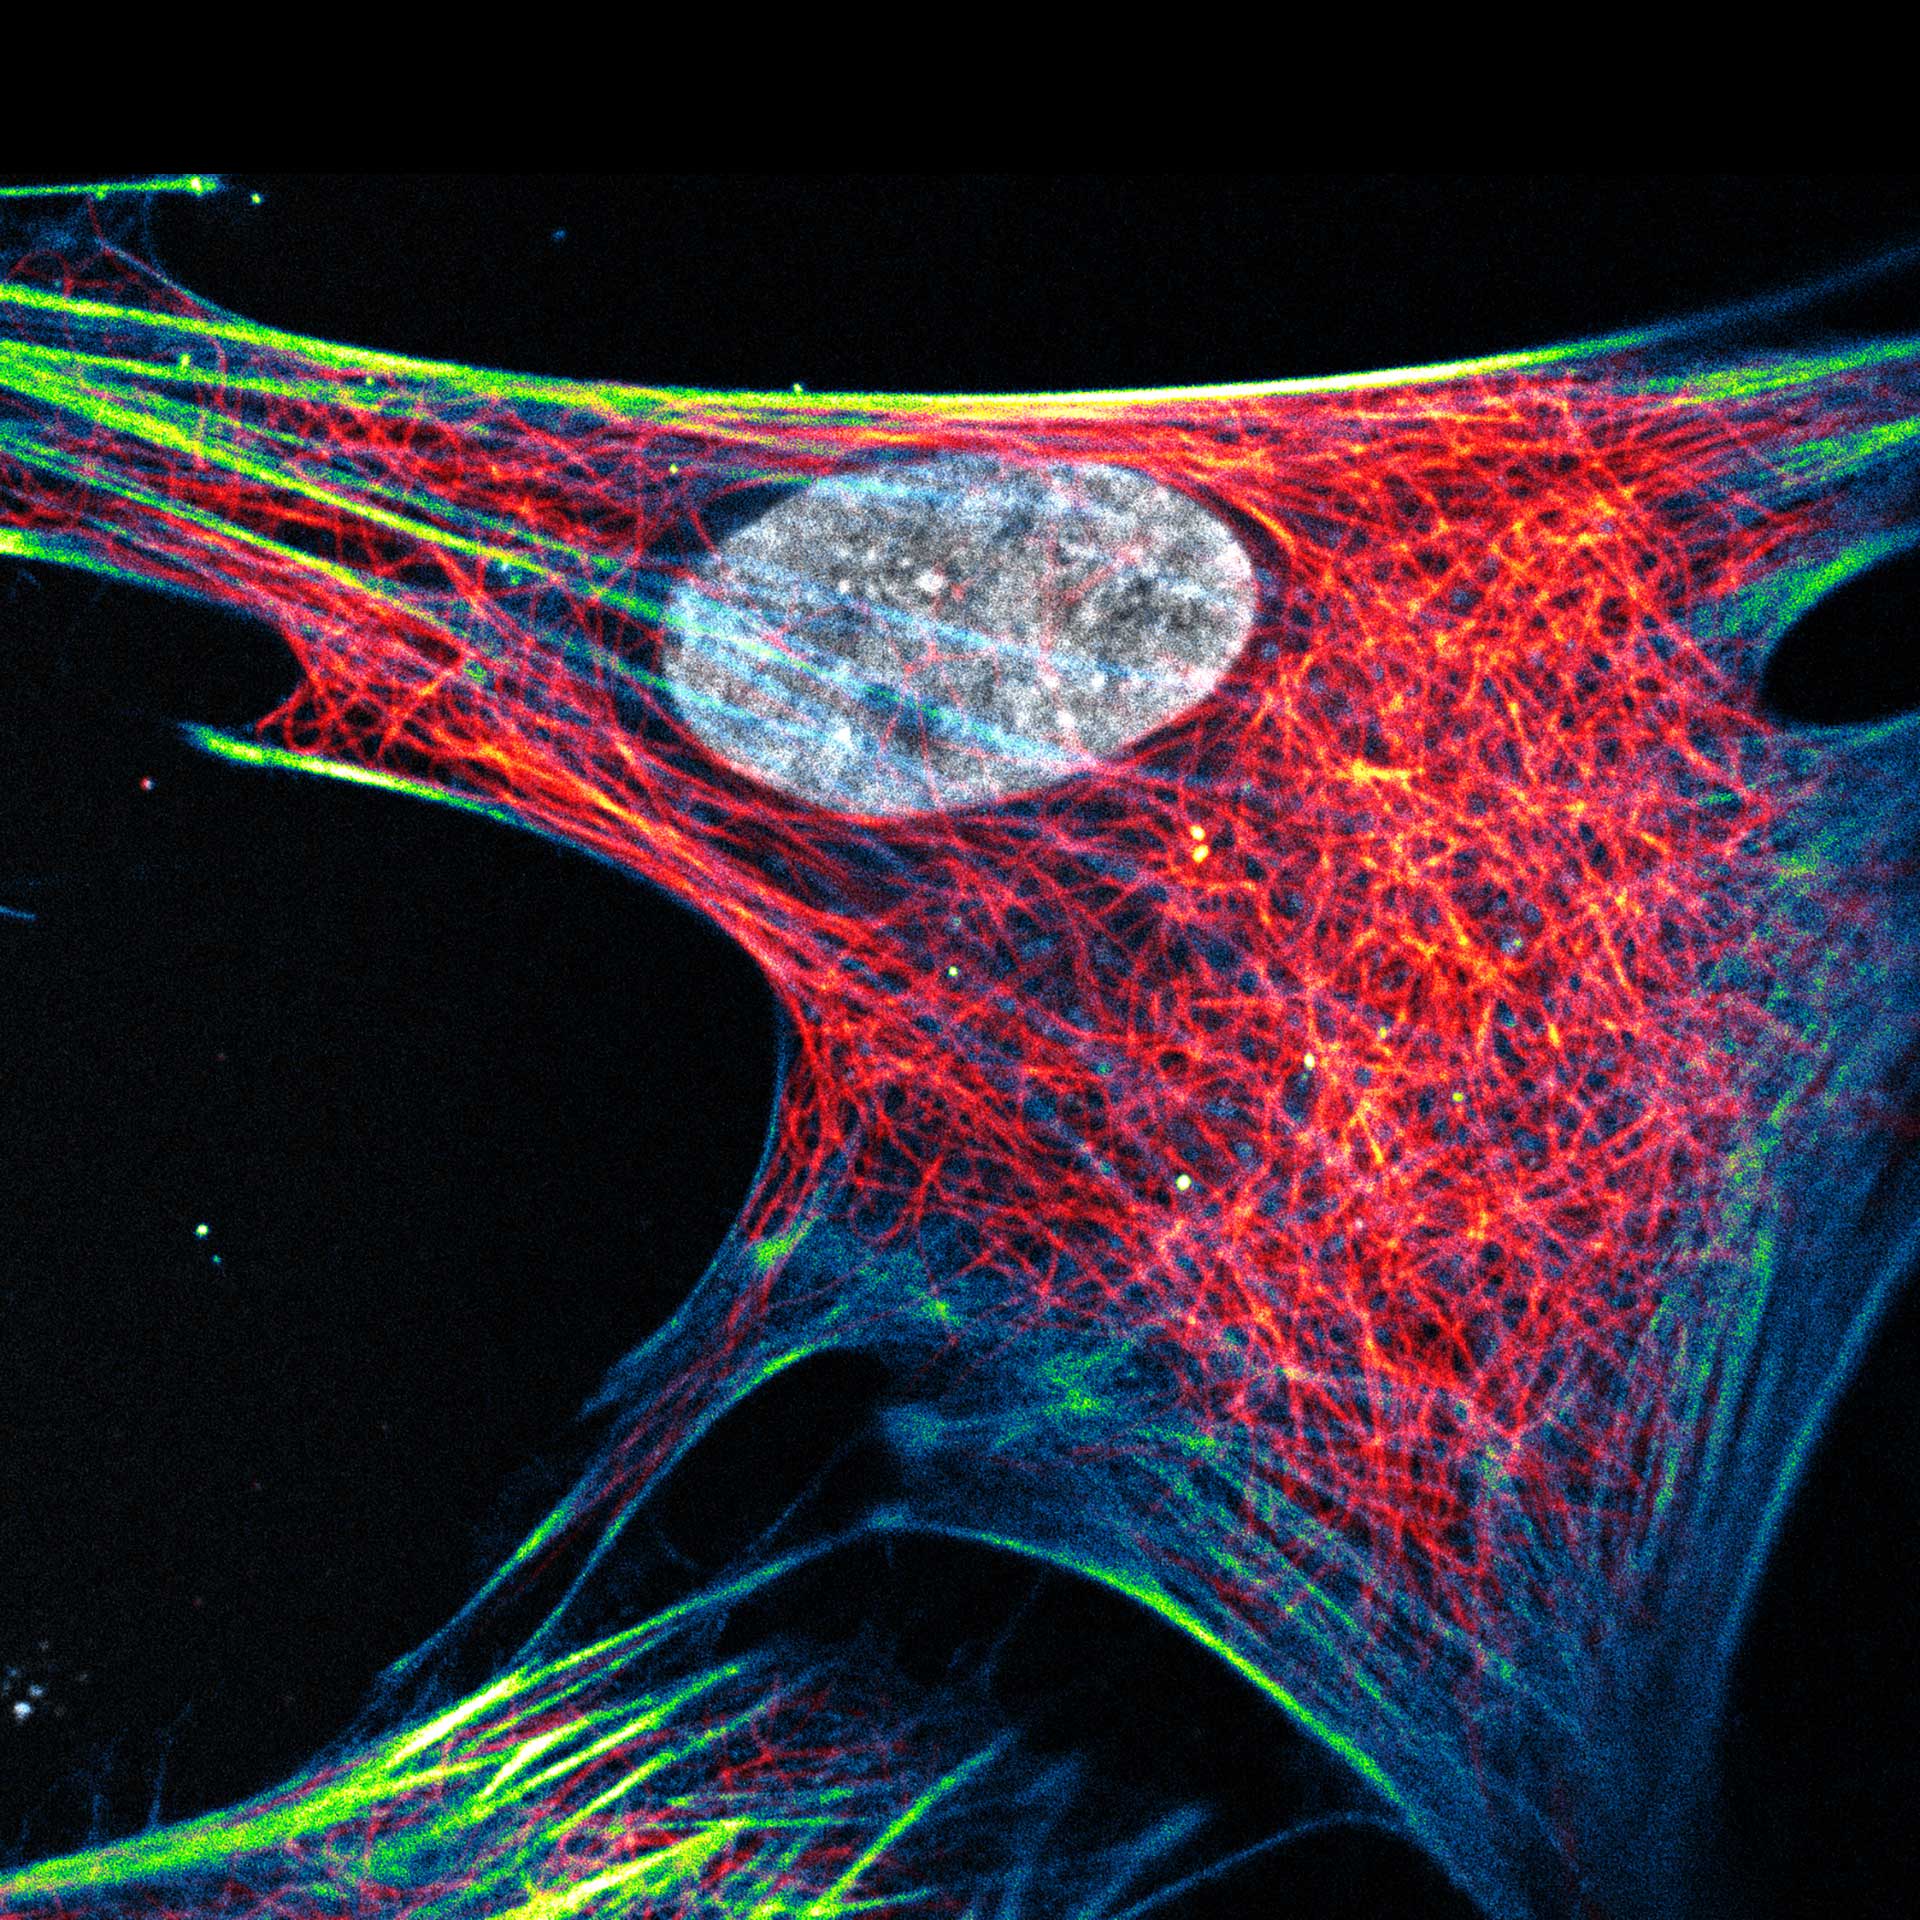
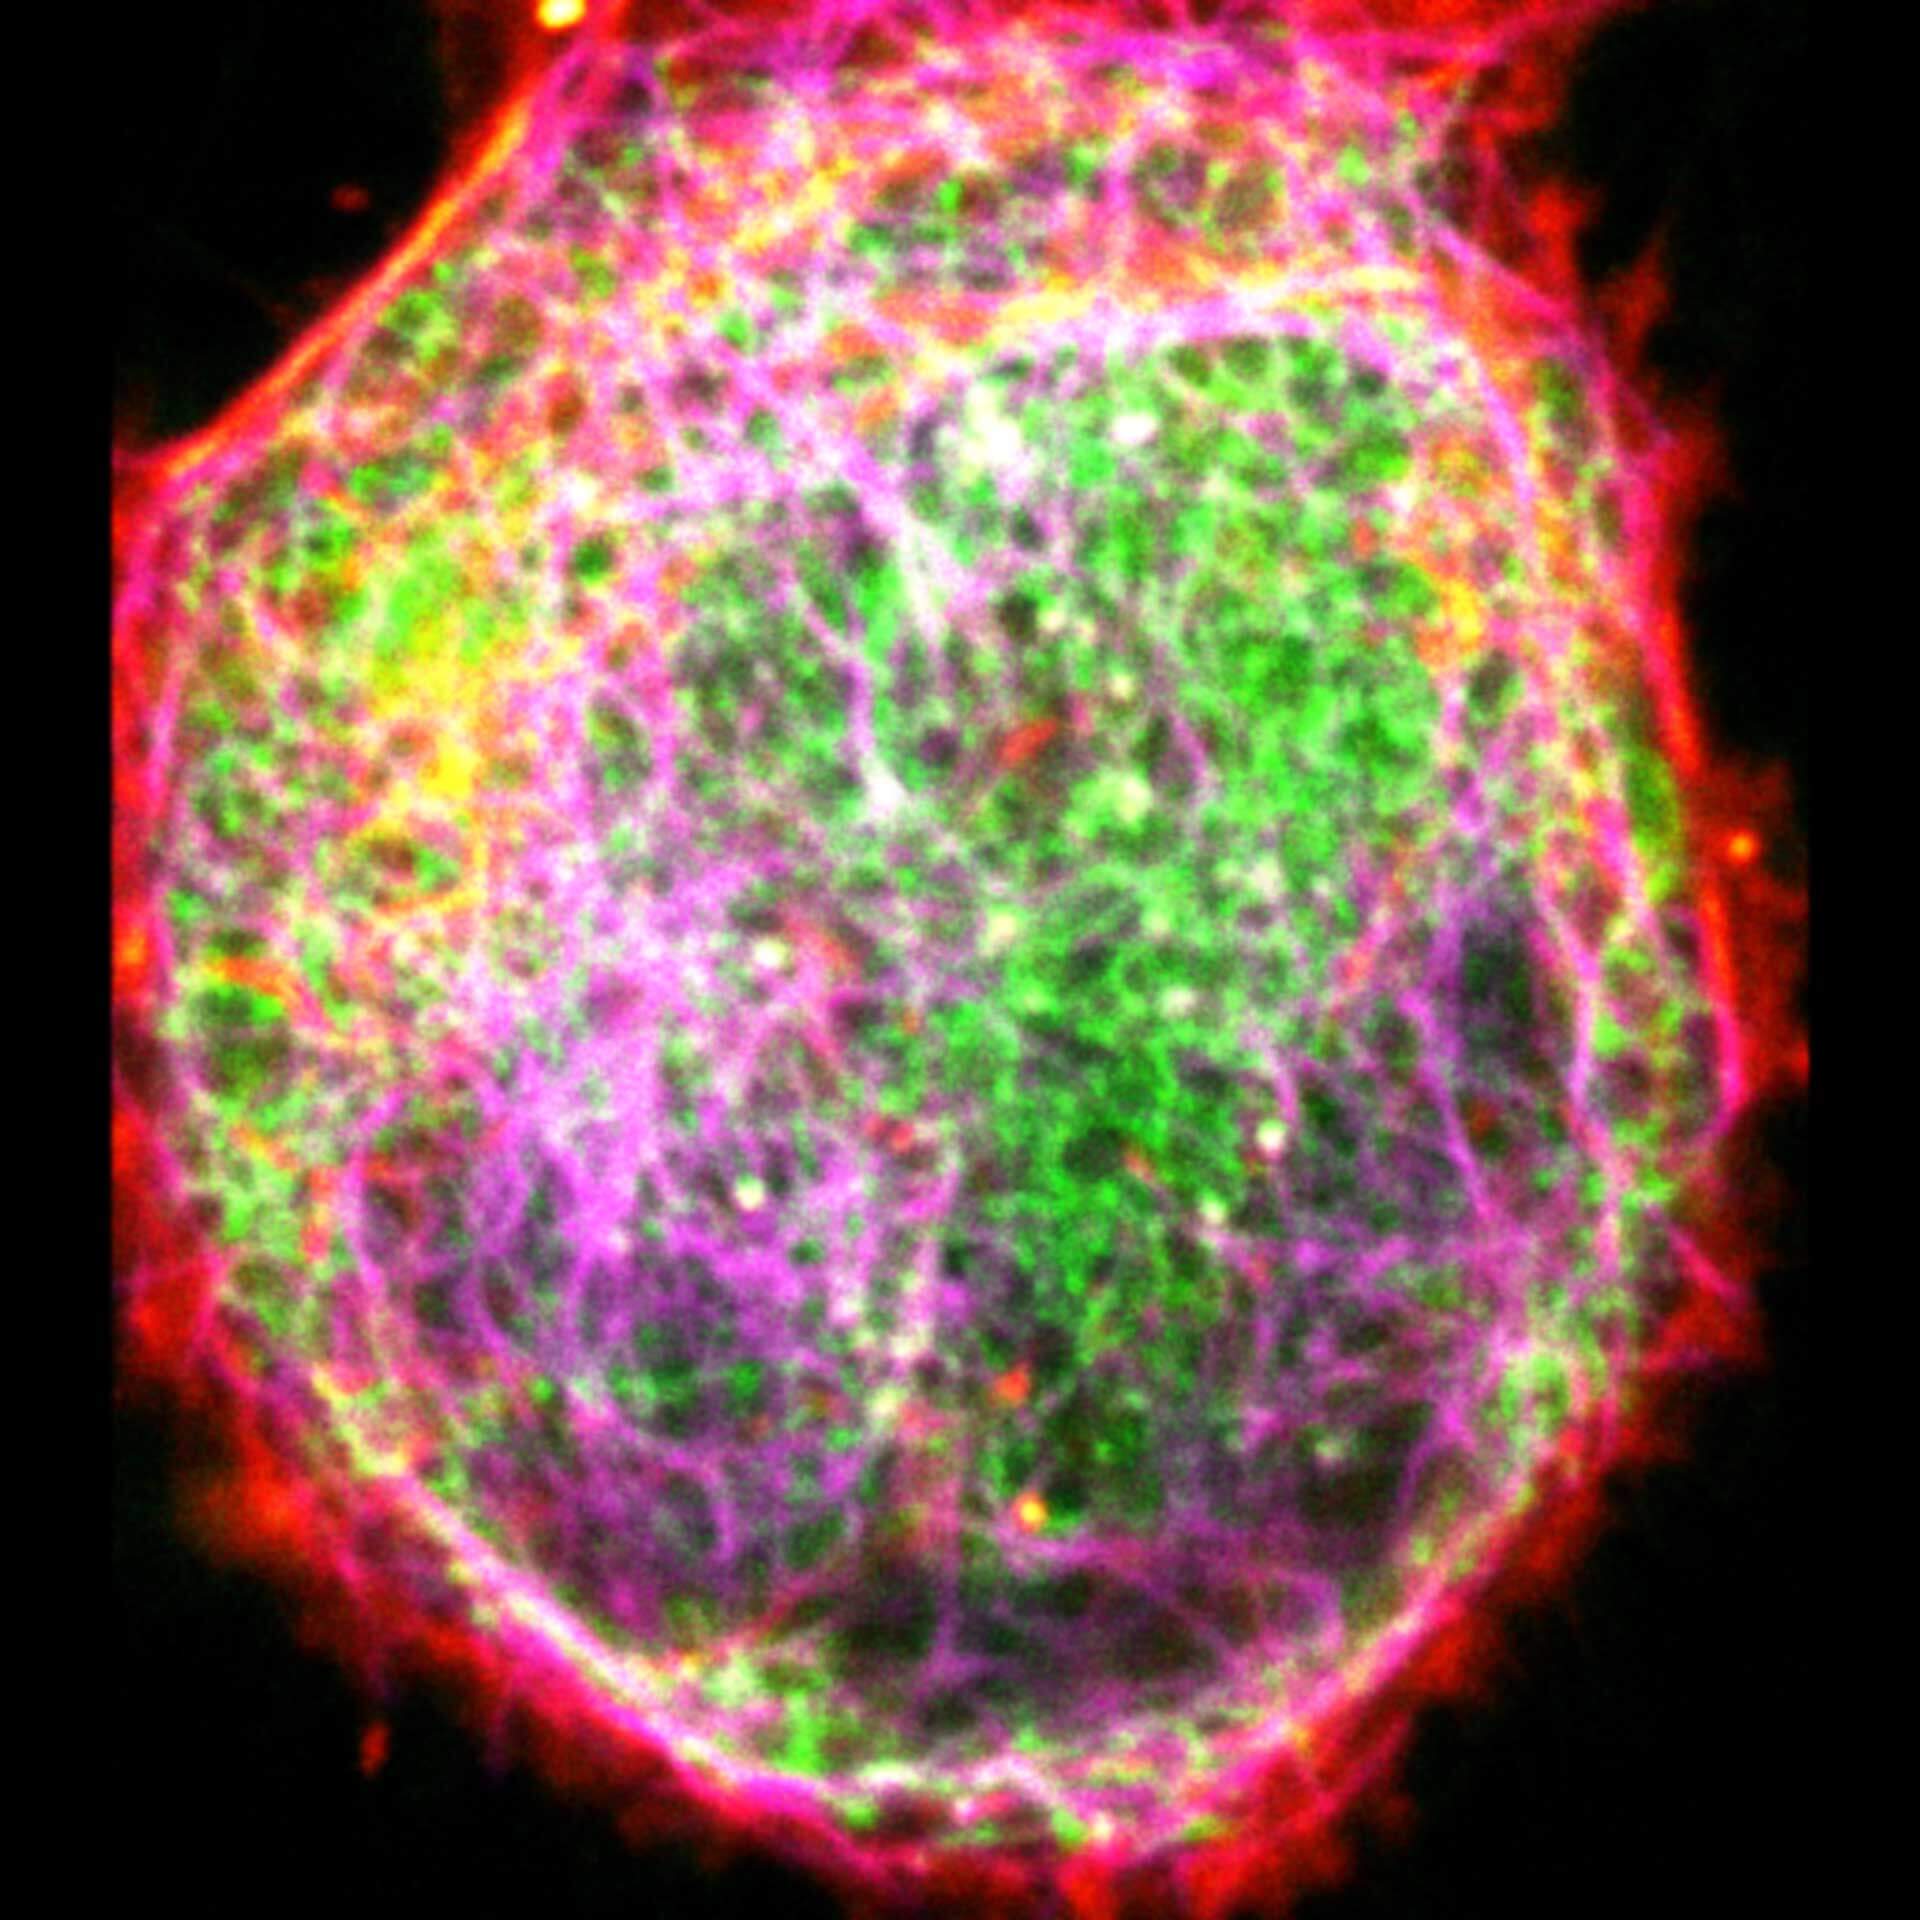
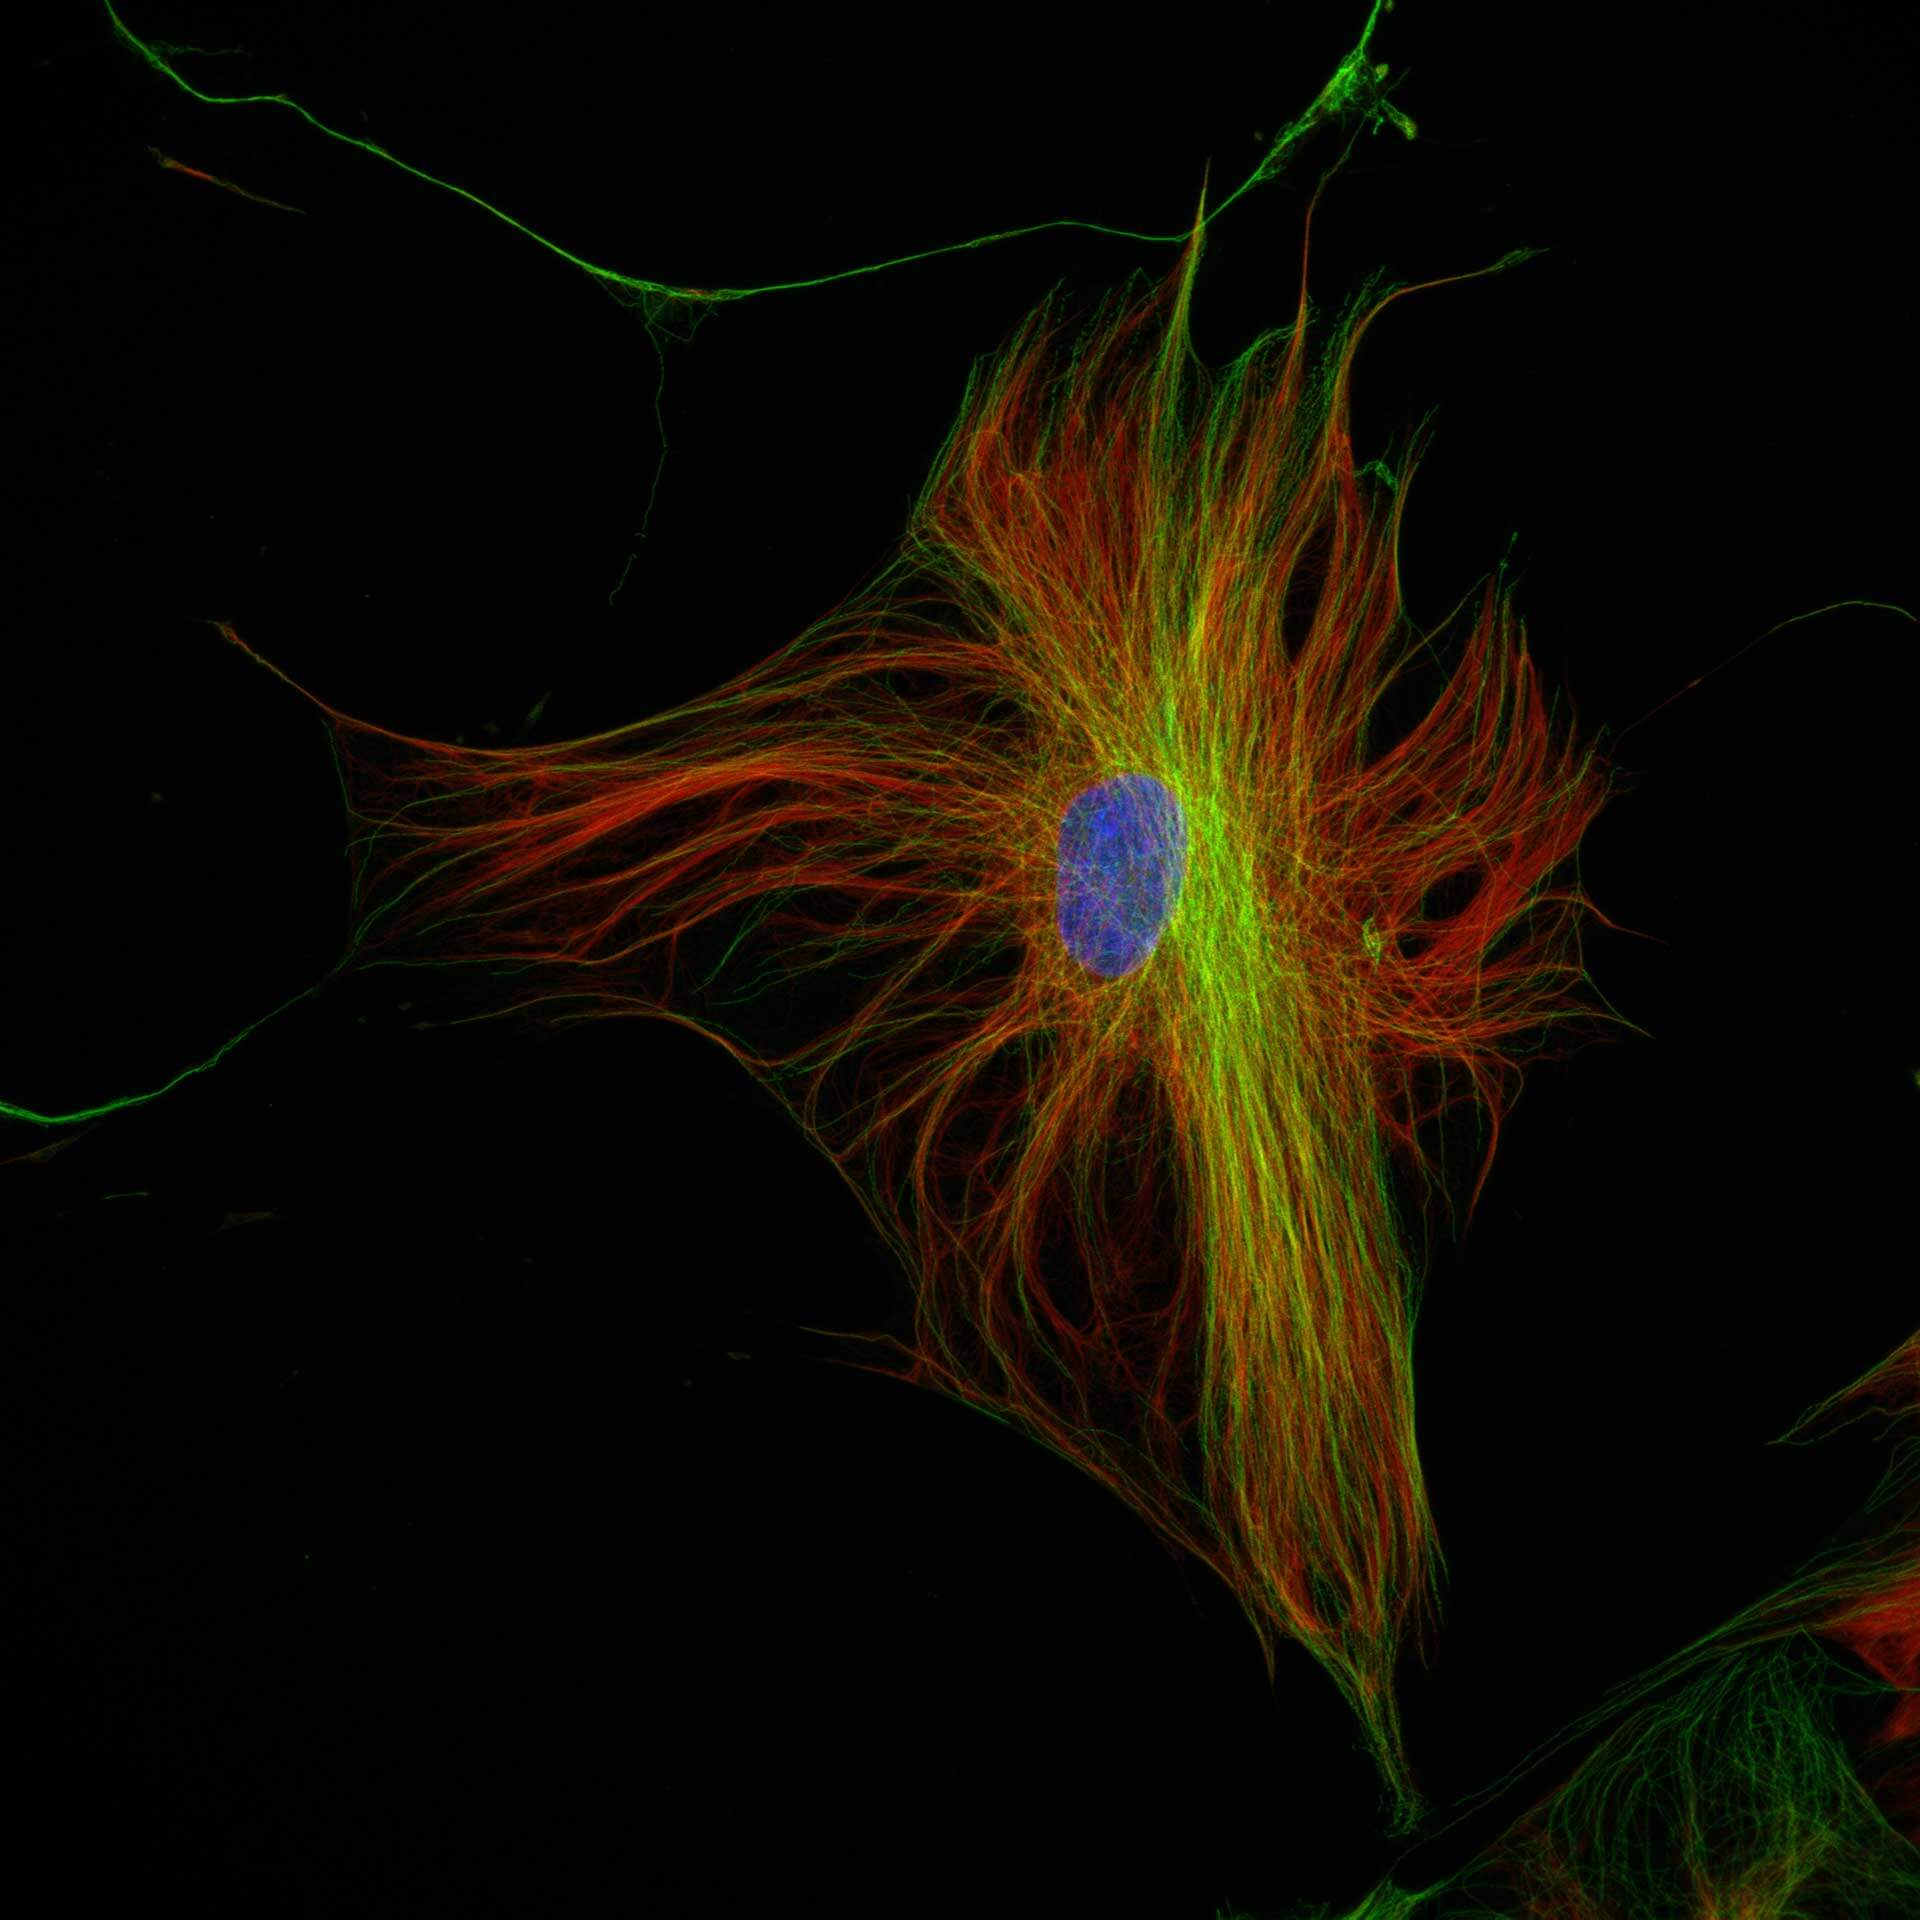
Indirect immunofluorescence staining with abberior STAR dyes coupled to polyclonal anti-mouse secondary nanobodies (alpaca VHH single domain antibodies) from Jackson ImmunoResearch shows excellent results in 3-color STED imaging. Staining was performed according to the premix & stain protocol. Vimentin (abberior STAR RED, green), tubulin (abberior STAR 580, magenta) and dsDNA (abberior STAR 460L, blue) were labeled in fixed mammalian cells and visualized with the STEDYCON.
Description
Description
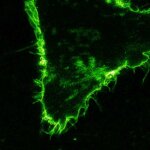
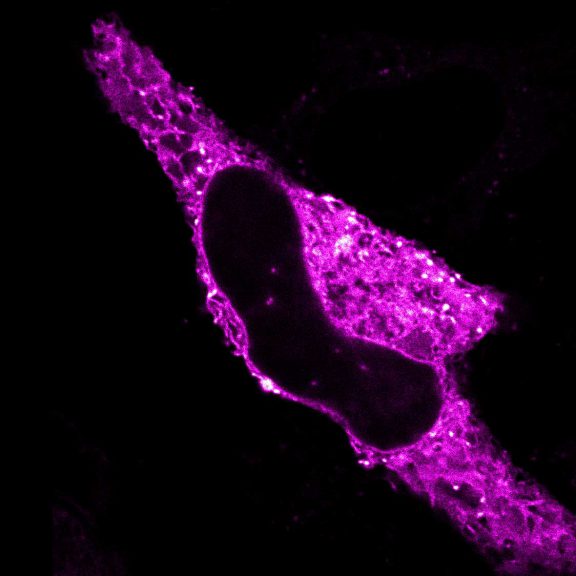
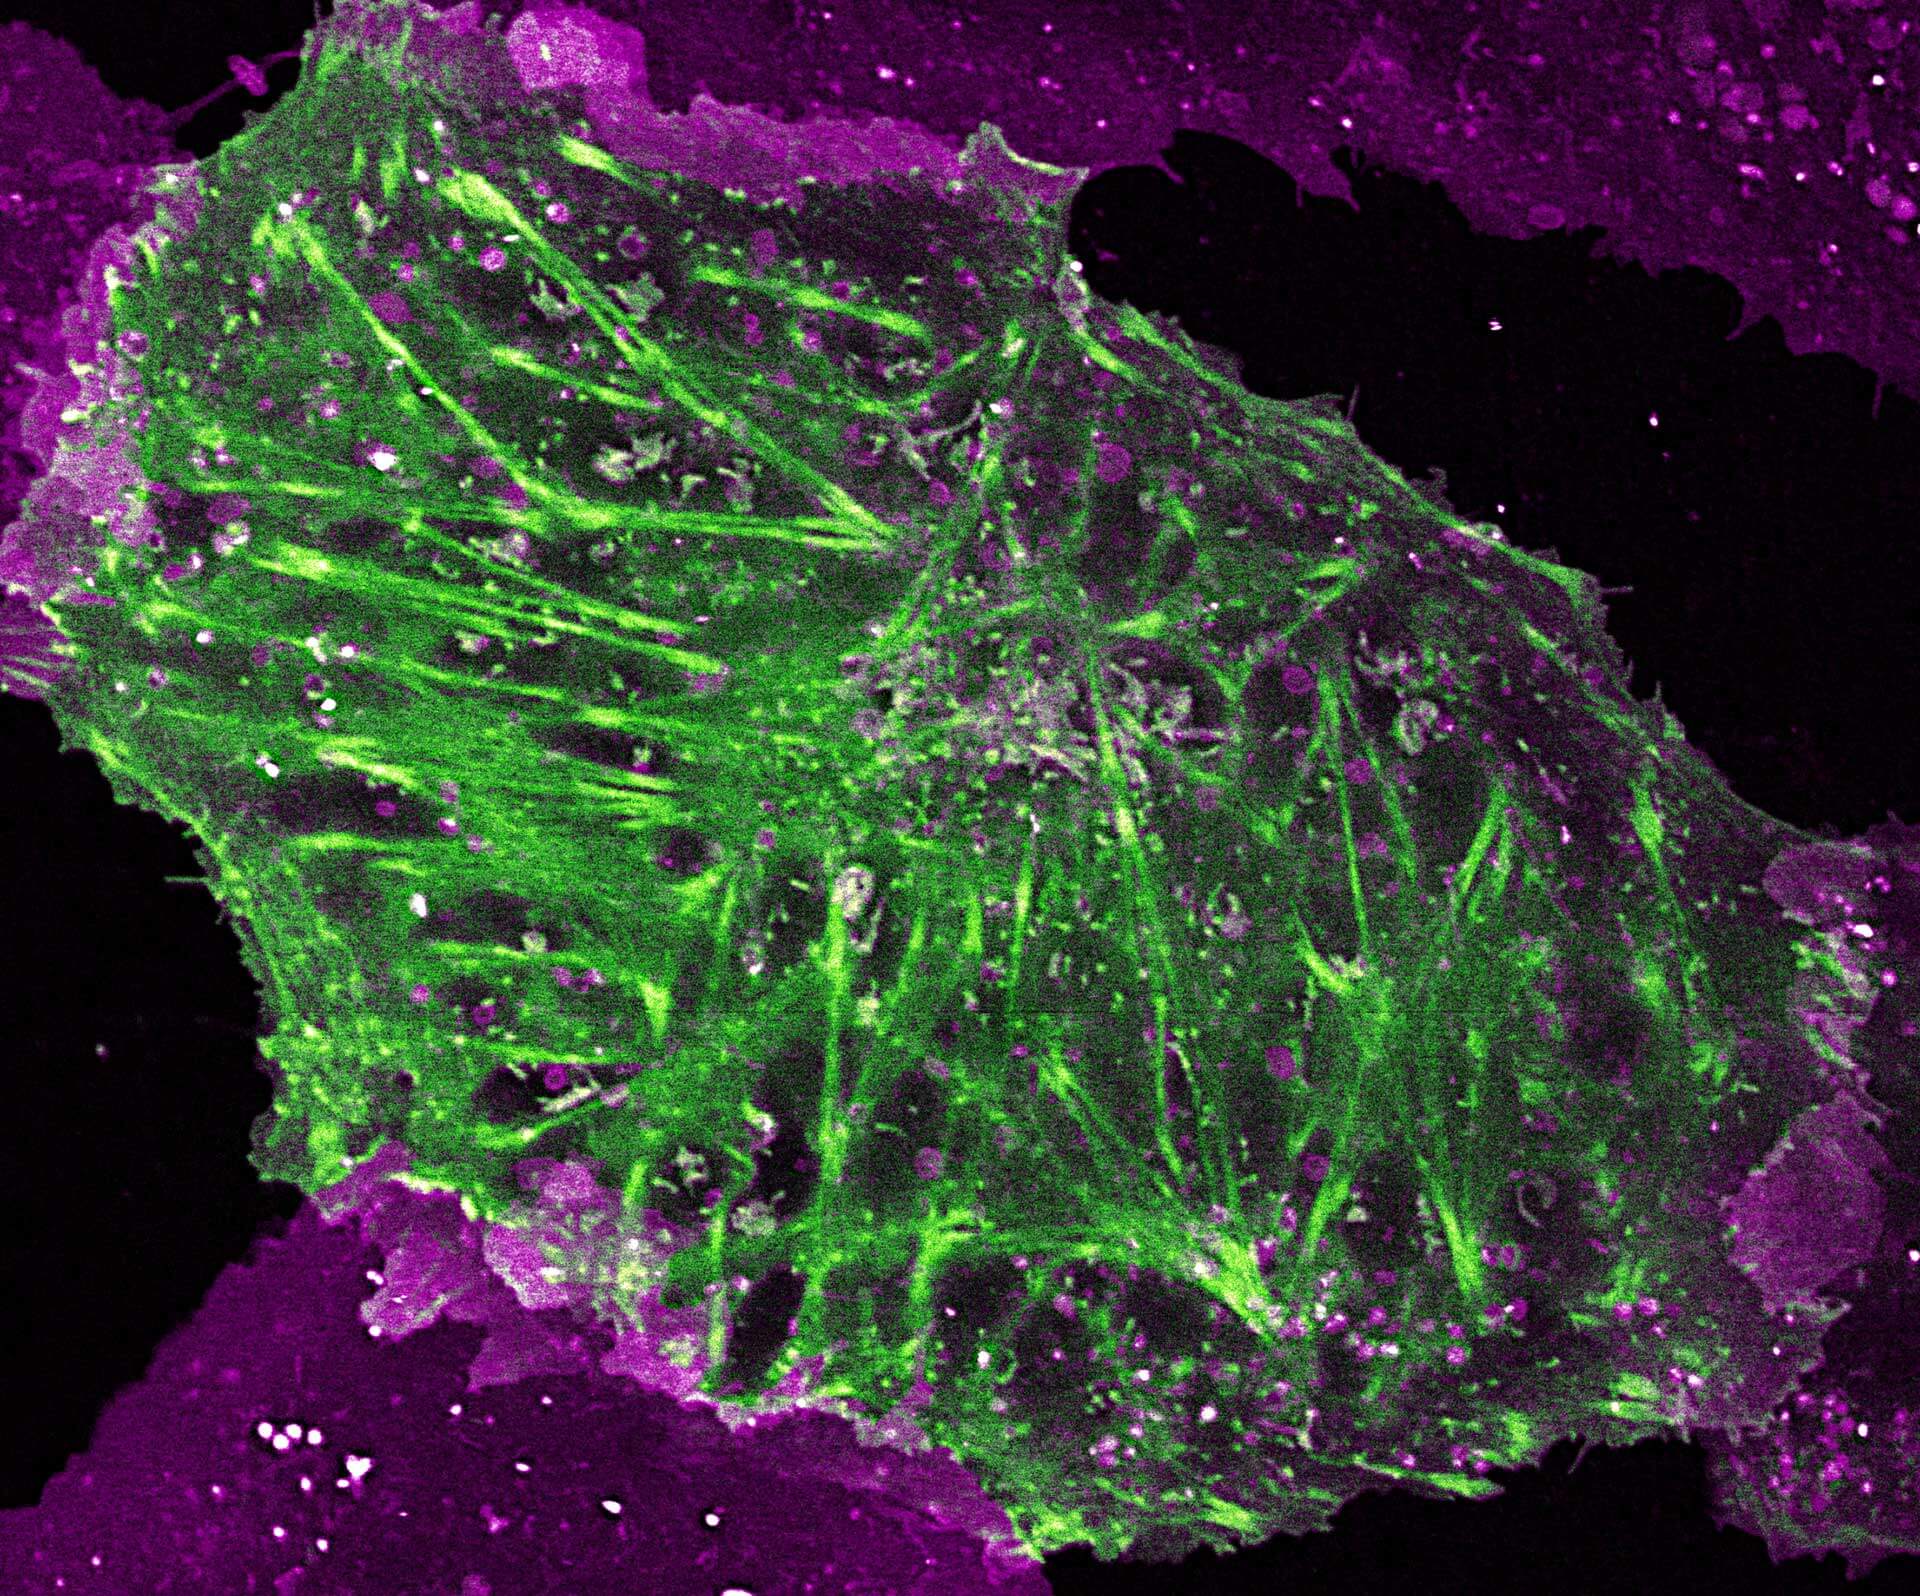
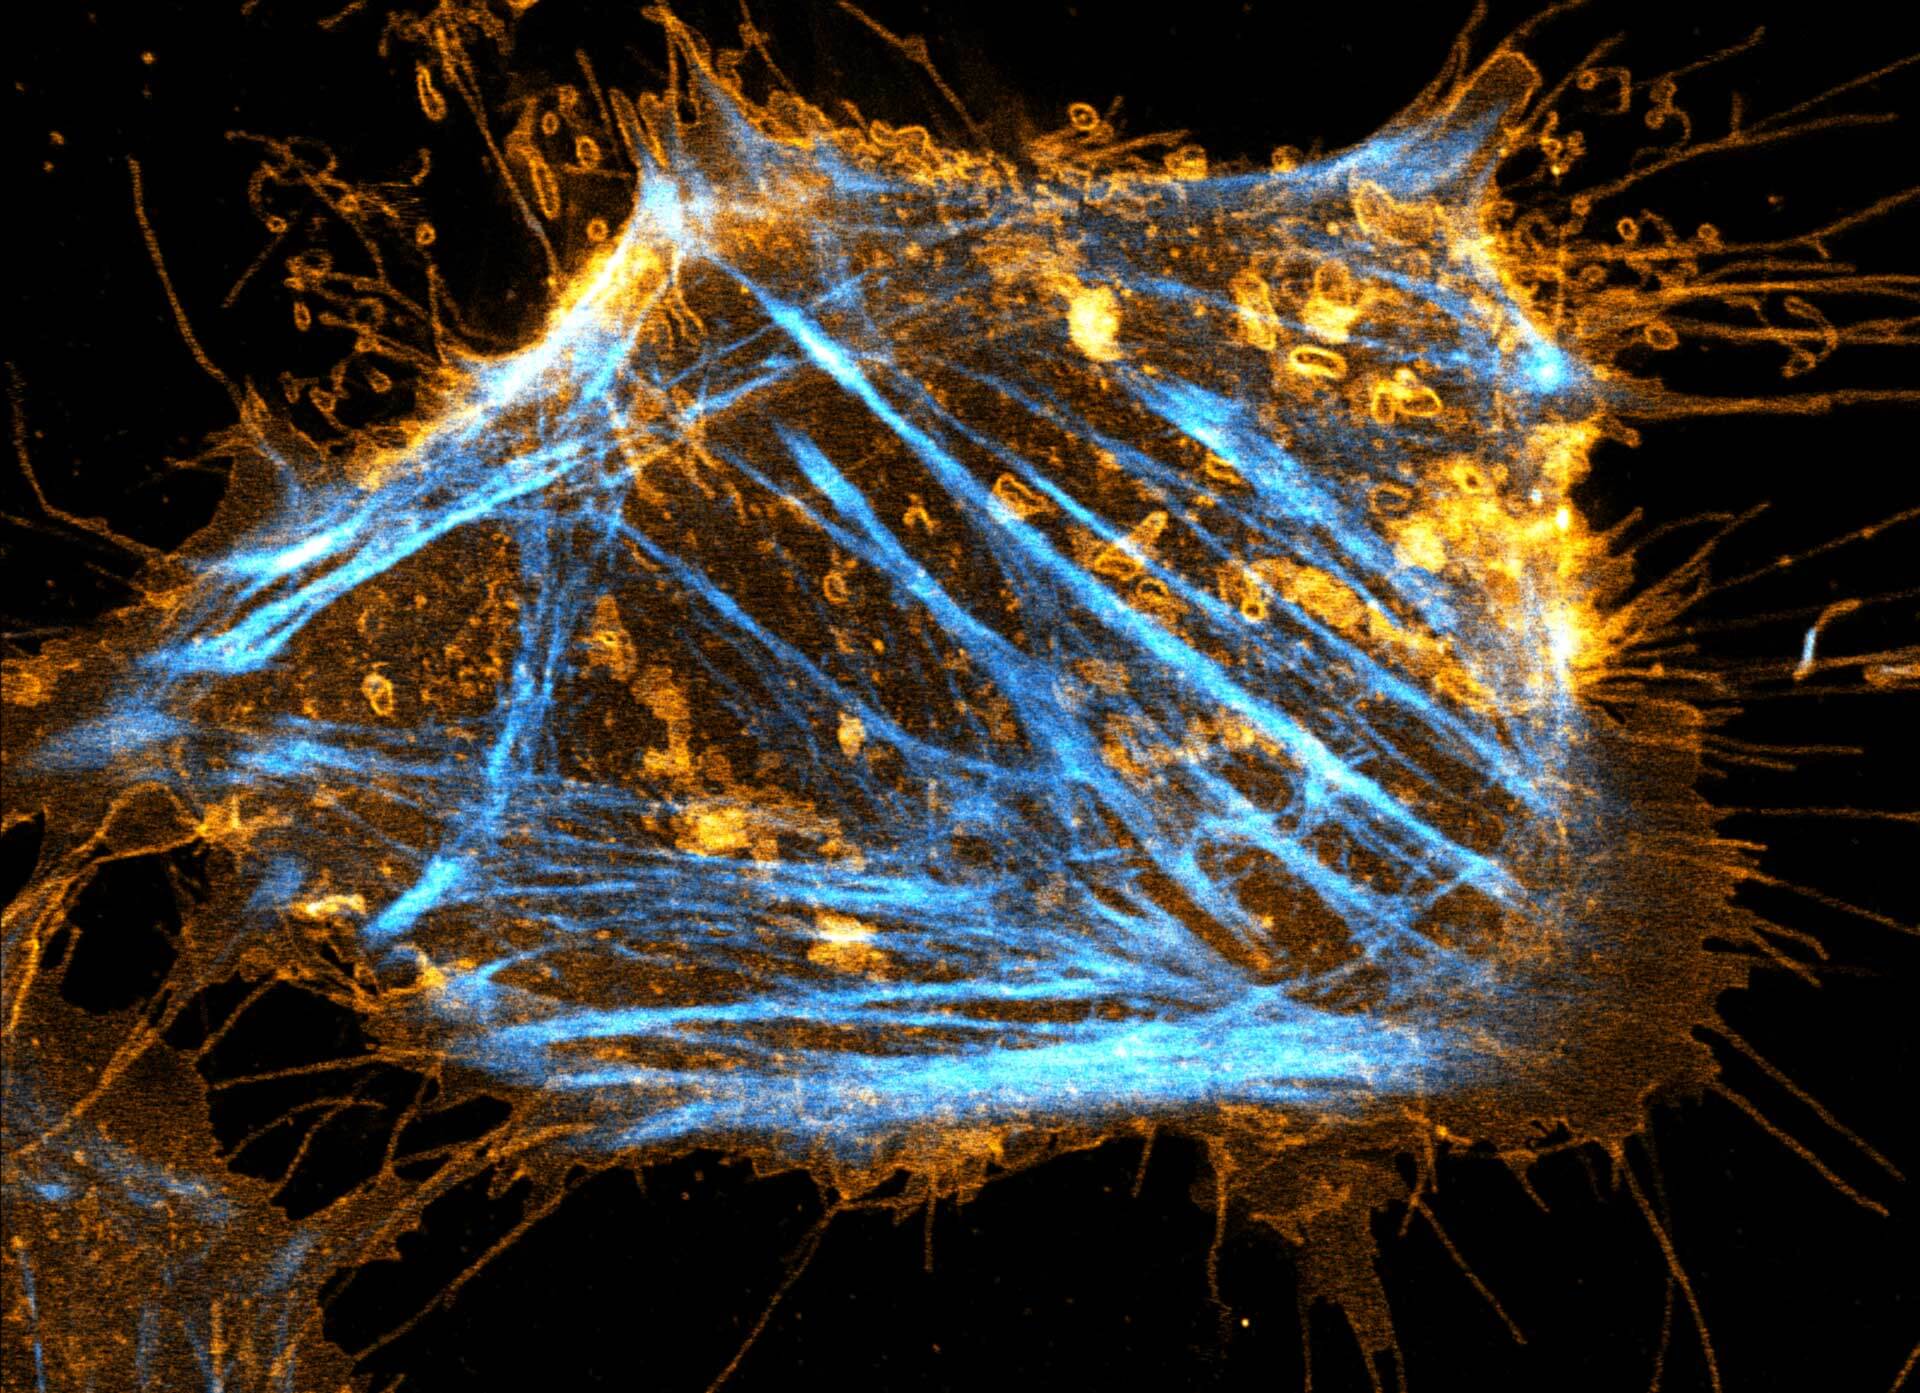
2-color STED image of a living cell expressing actin K118TAG incorporating TCO*A labeled with abberior LIVE 590 click (green). Plasma membrane is highlighted with abberior STAR RED membrane (magenta).
Description
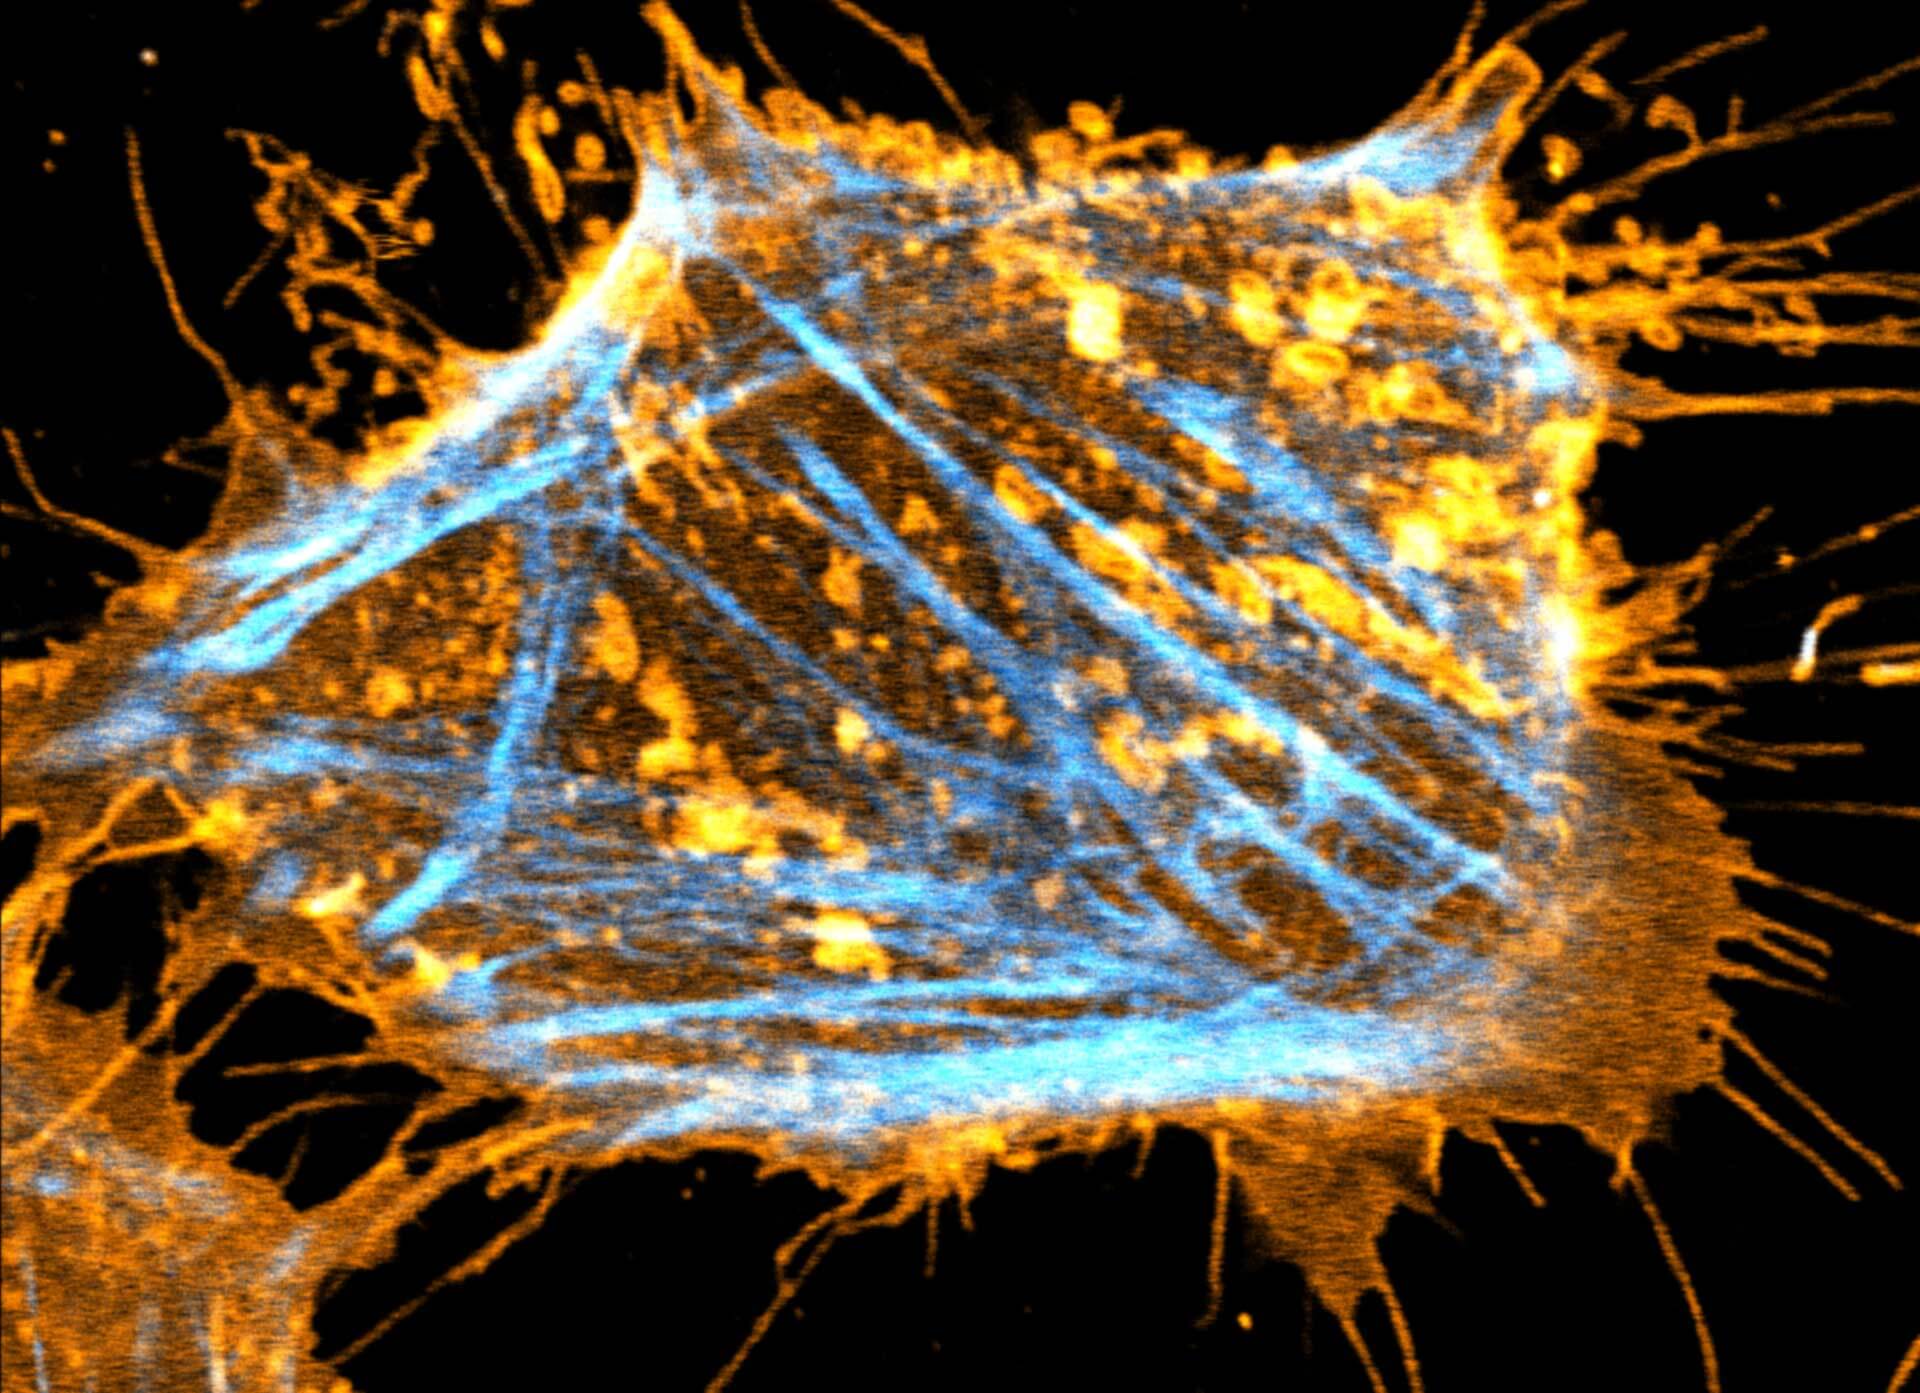
2-color STED image of a living cell expressing actinK118TAG incorporating TCO*A labeled with abberior LIVE 550 click (cyan). Tubulin filaments were stained with our direct probe abberior LIVE 610 tubulin (yellow).
Description
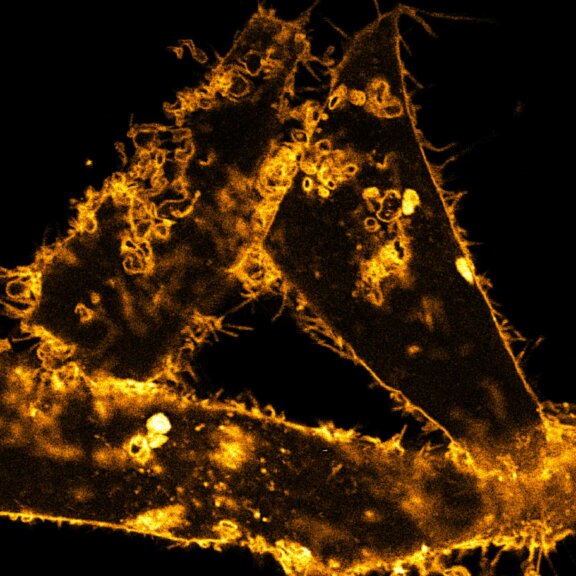
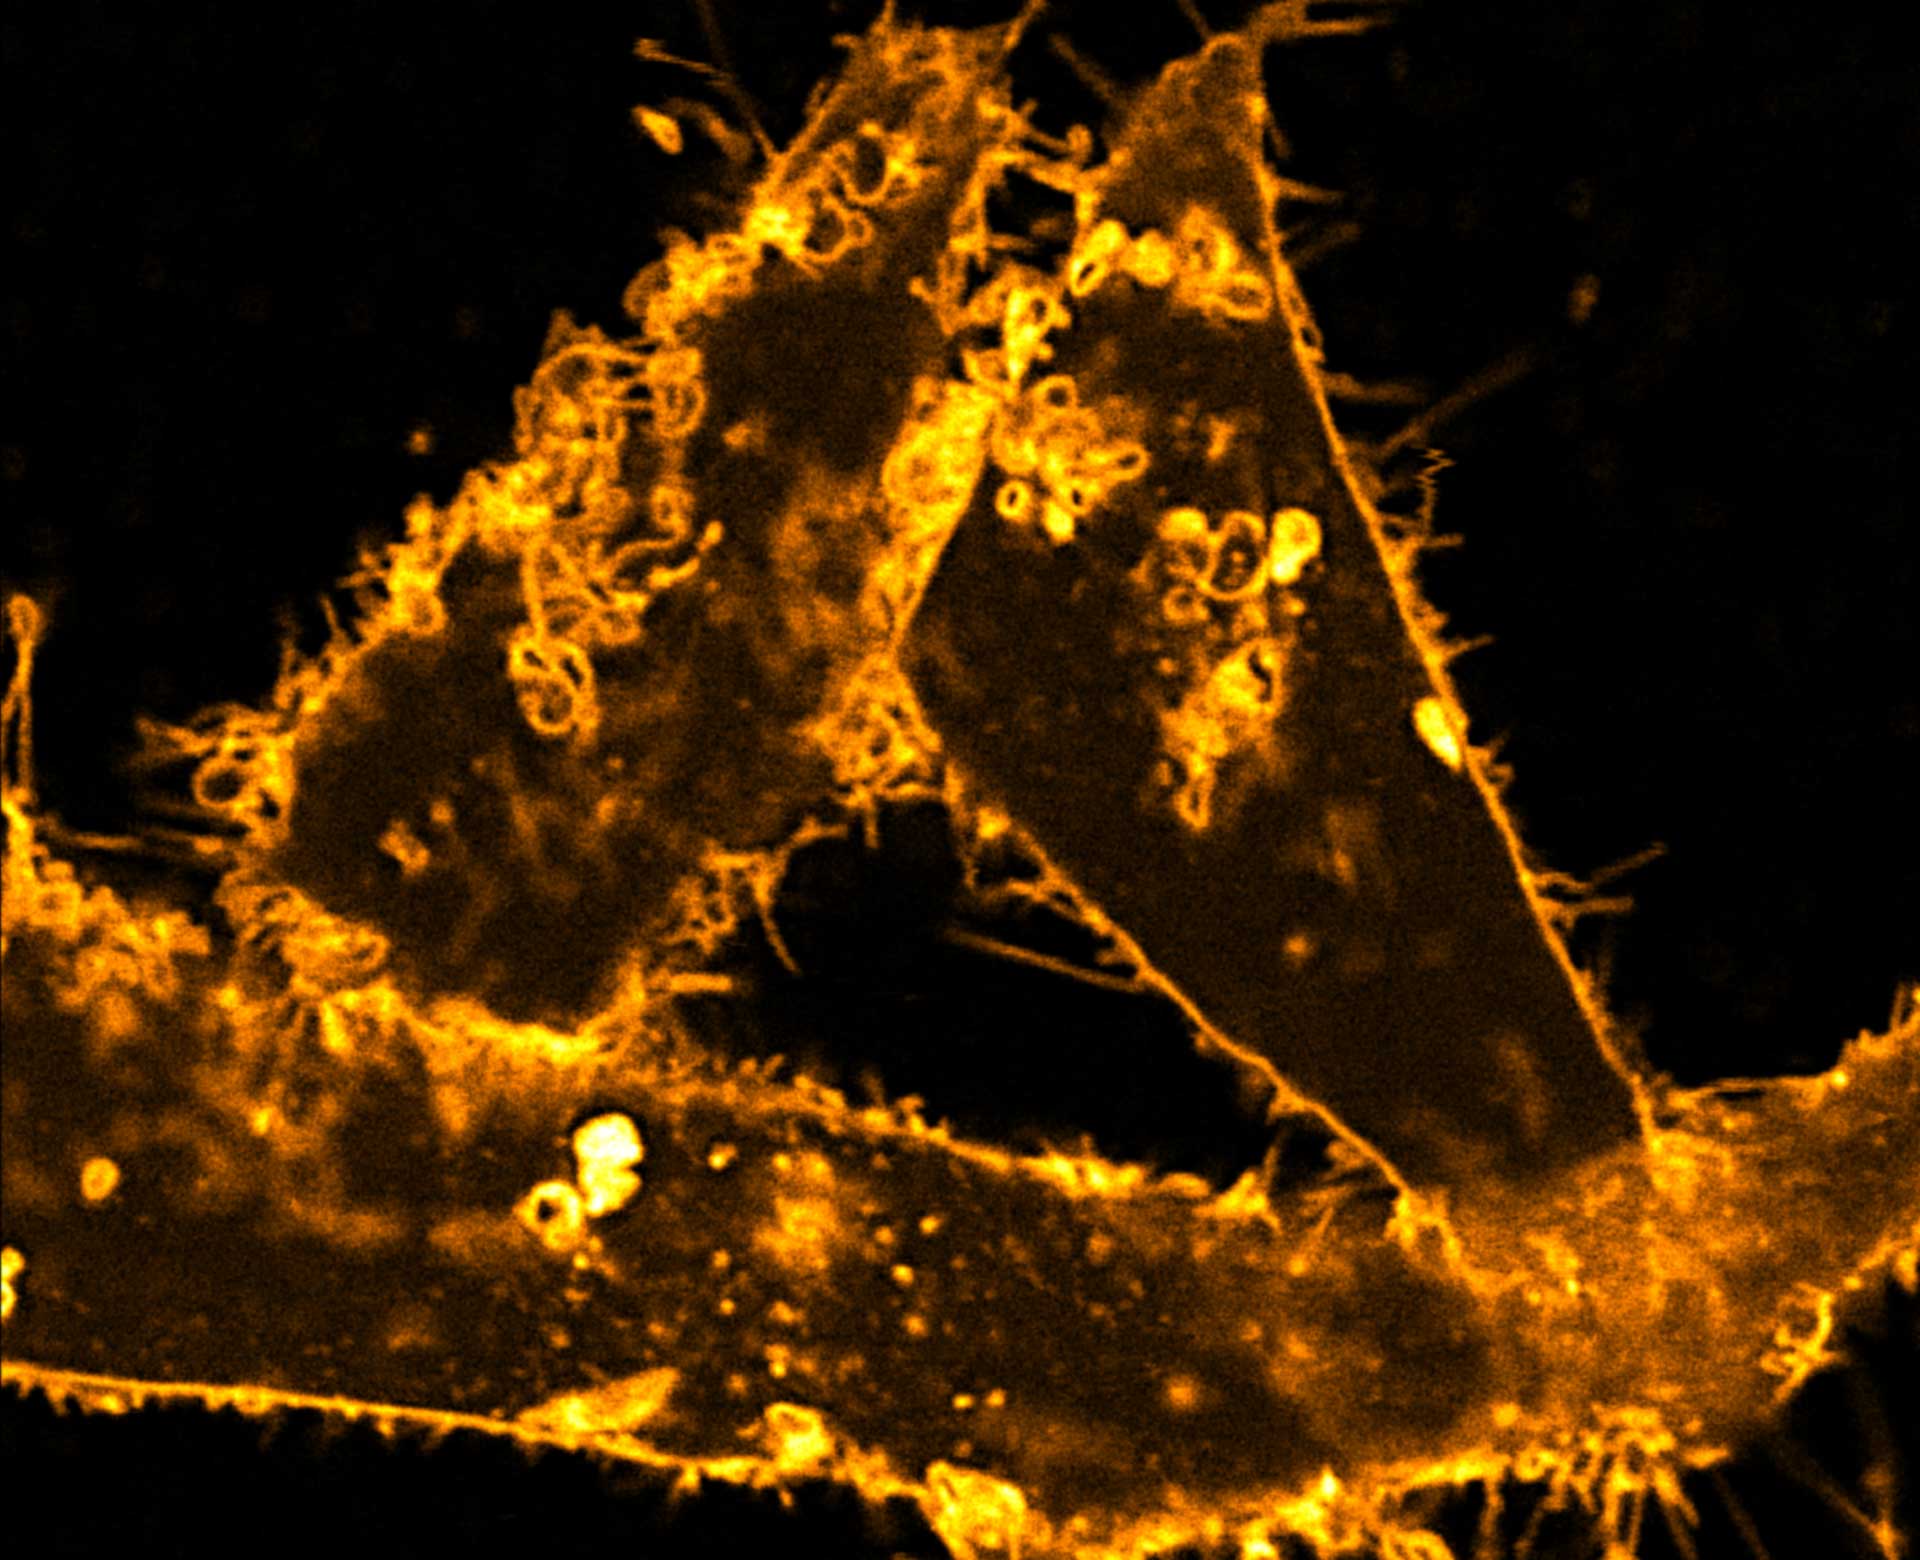
Two color live-cell STED and confocal image of a mammalian cultured cell stained with abberior STAR RED membrane (orange) and abberior LIVE 590 actin (cyan).
Description
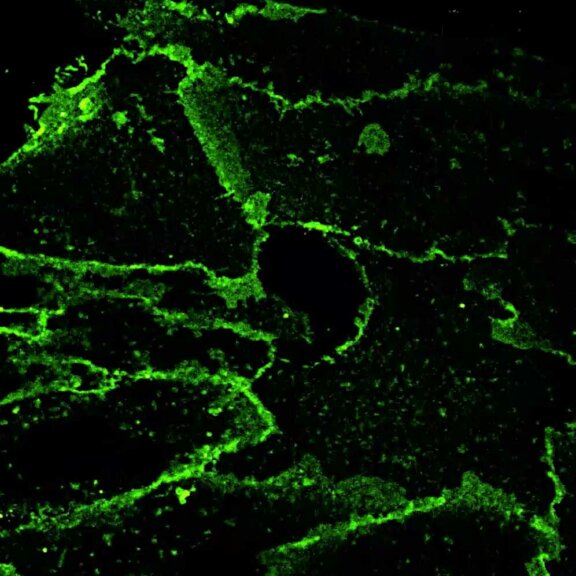
Comparison of STED and confocal of a living mammalian cell stained with abberior STAR ORANGE membrane.
Description
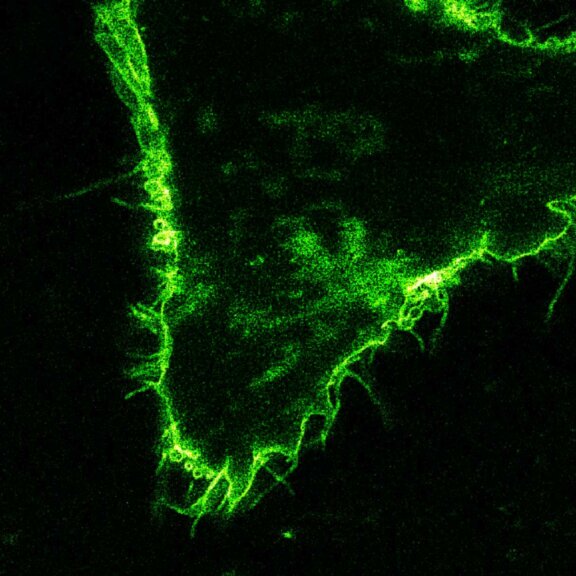
Comparison of STED and confocal of a living mammalian cell stained with abberior STAR 488 membrane. Images were acquired with our FACILITY and STED @ 595 nm.
Description
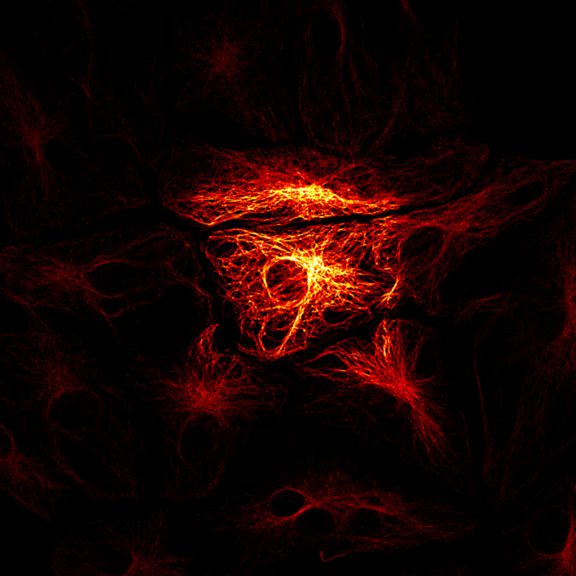
abberior CAGE 552 is a caged dye which is initially nonfluorescent and colorless substance which, upon photolysis with UV light, readily transforms irreversibly into a red and highly fluorescent dye.
The cytoskeleton is visible after UV induced uncaging of abberior CAGE 552.
Description
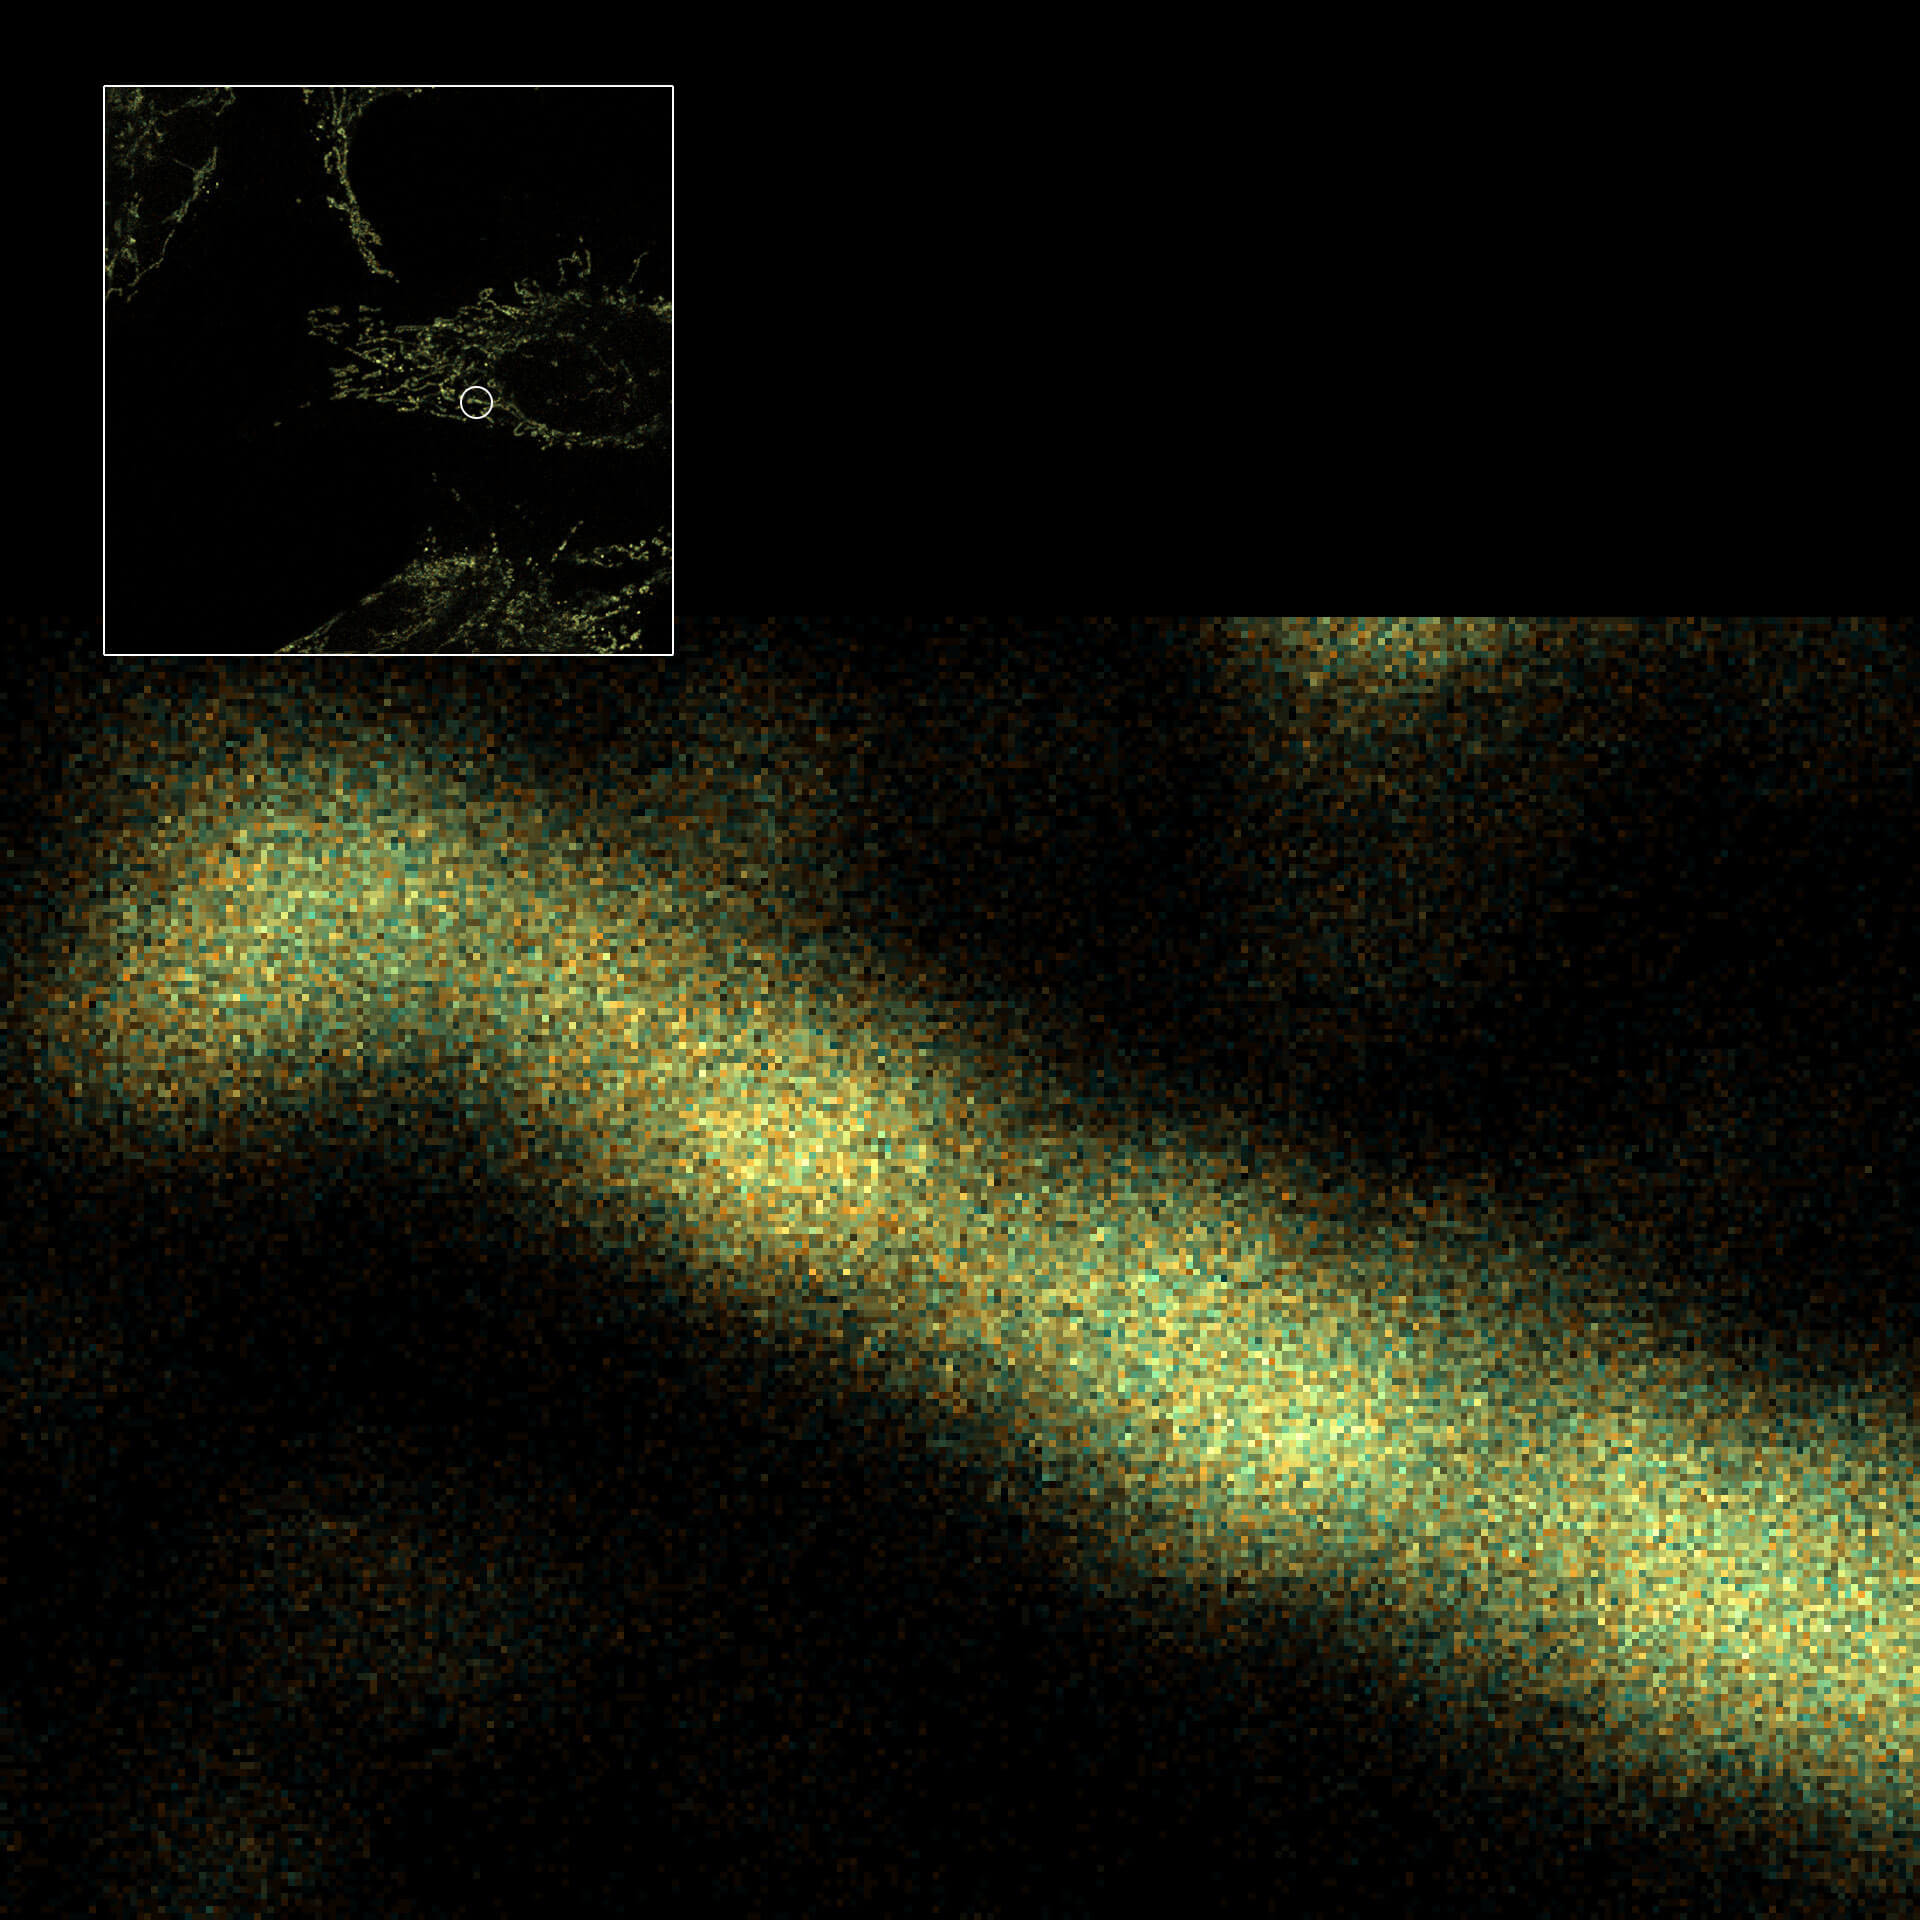
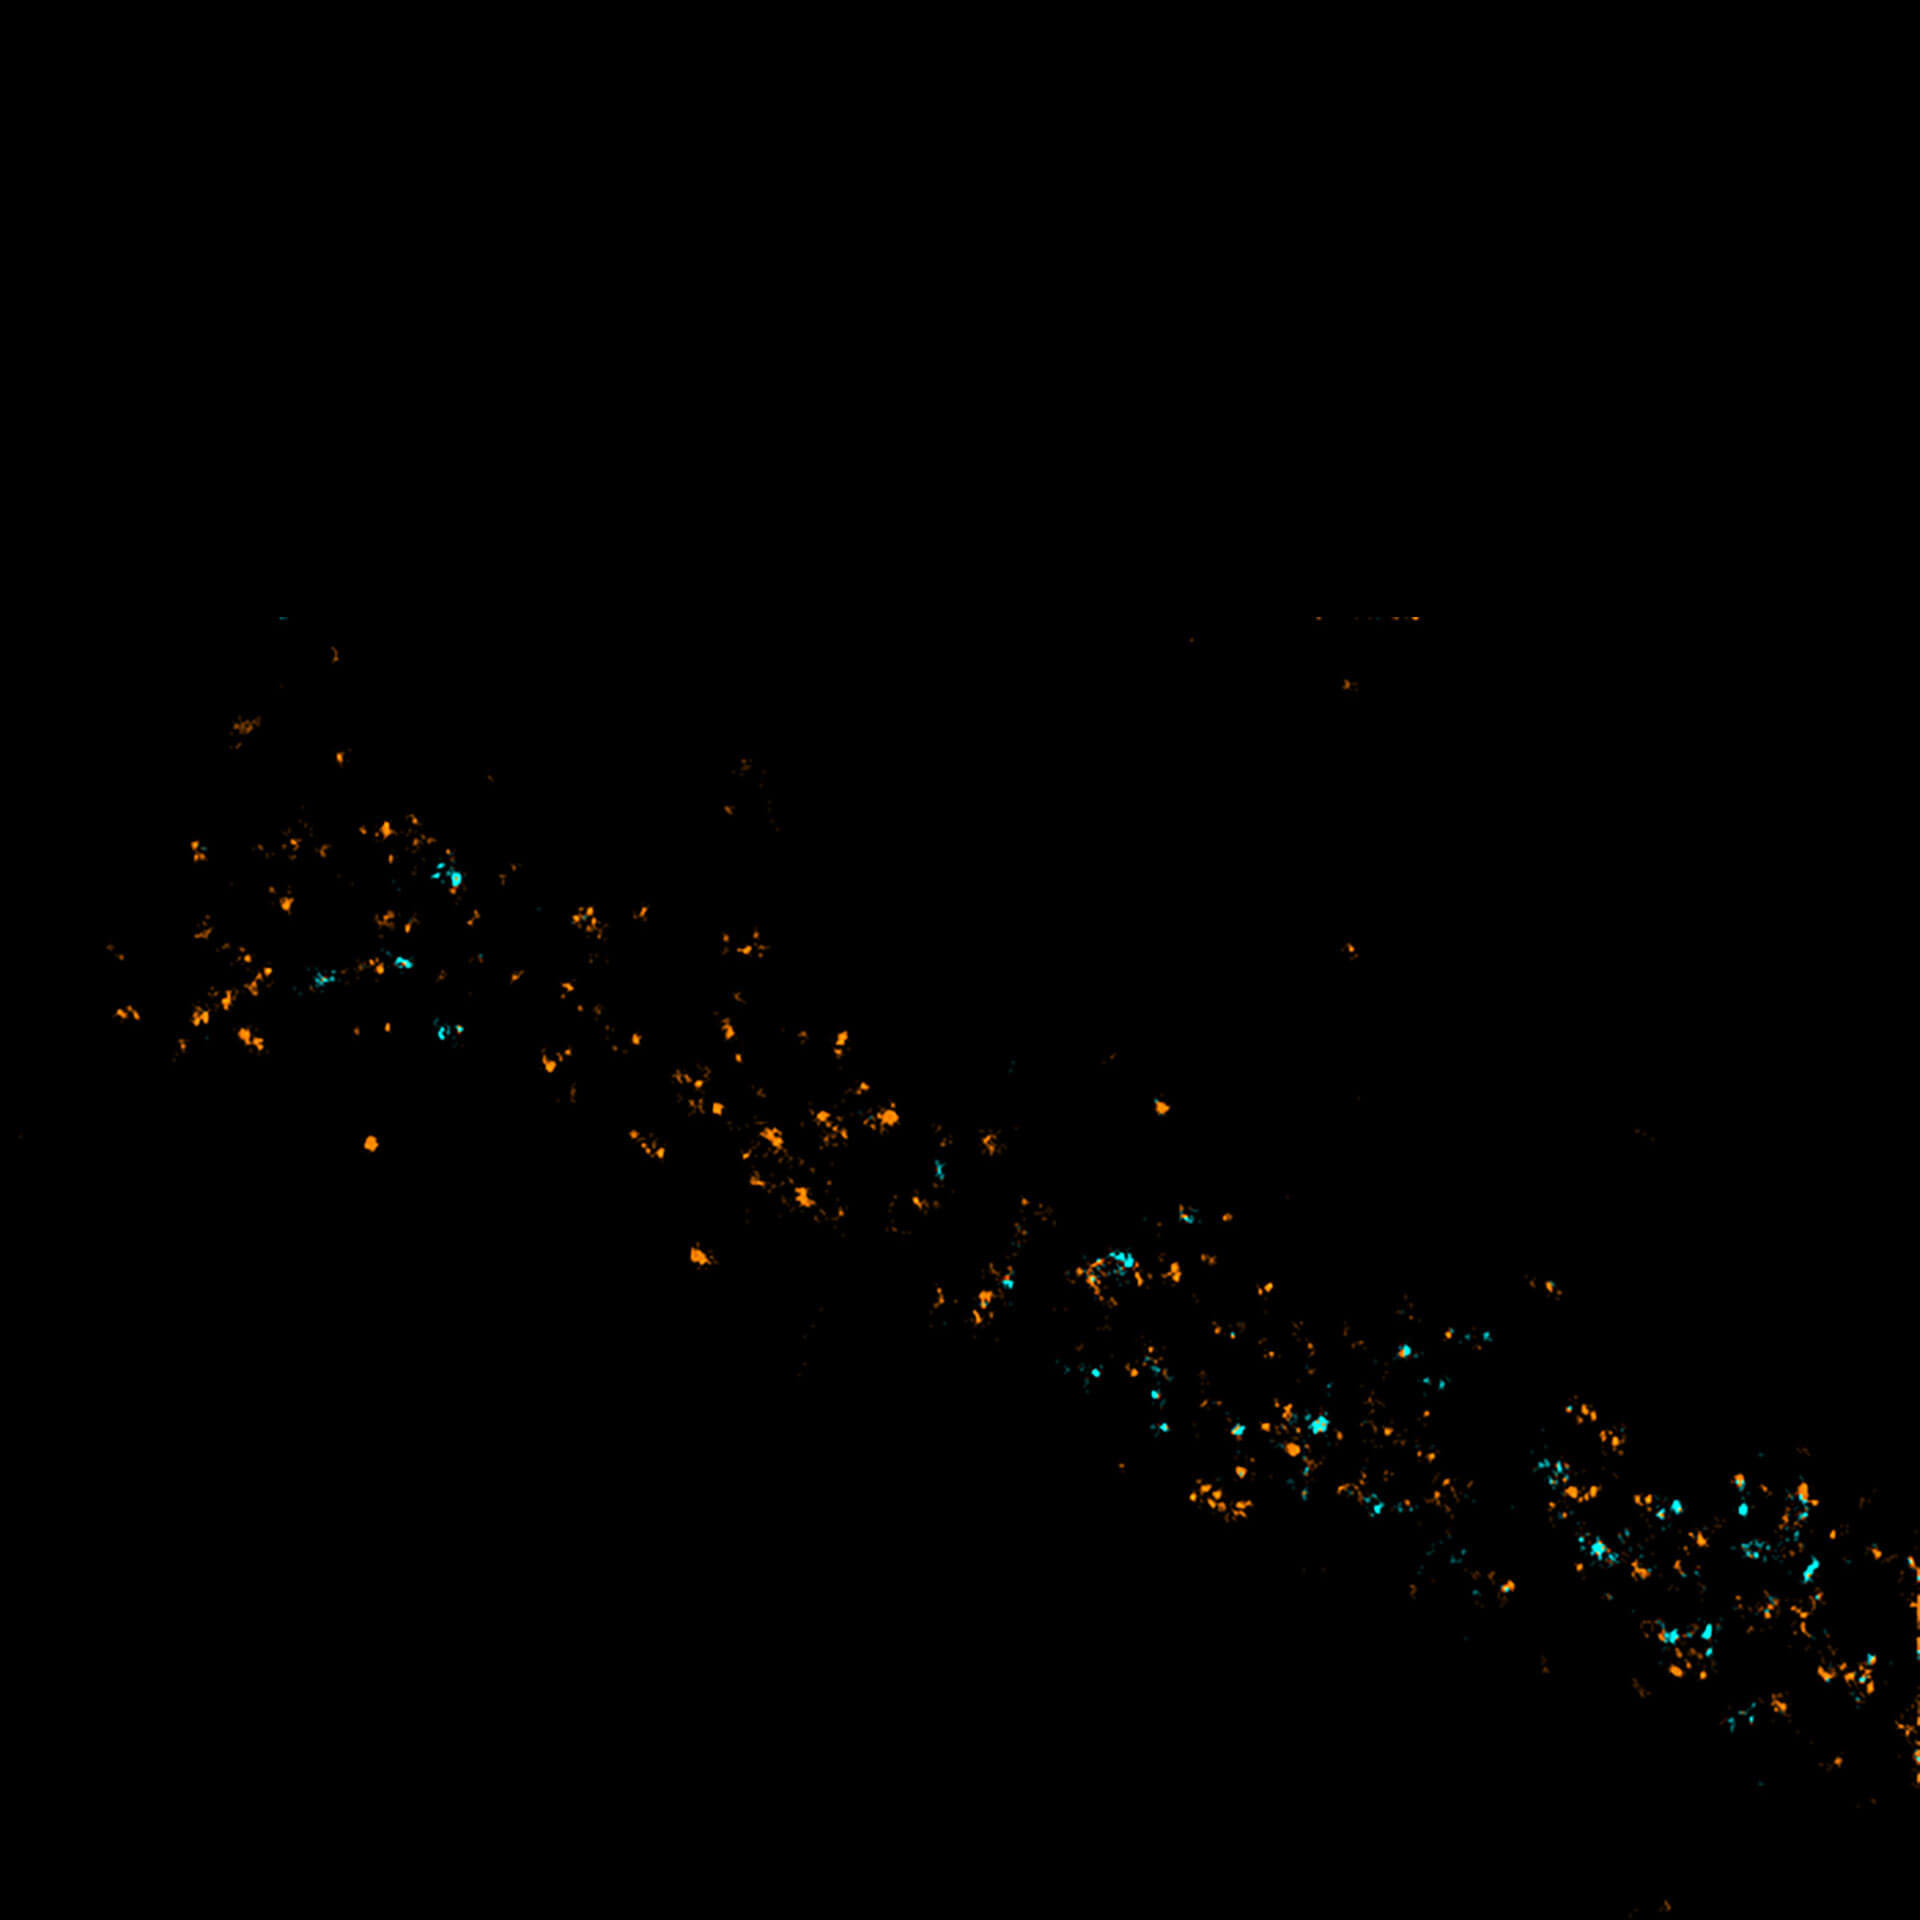
Two-color MINFLUX revealing an inner and outer mitochondrial membrane marker. Cultured mammalian cell labeled with indirect immunofluorescence using secondary antibodies coupled to abberior FLUX 640 (orange) and FLUX 680 (cyan). MINFLUX enables the visualization and separation of both structures.
Description
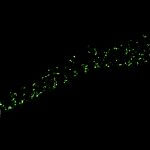
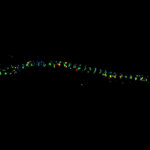
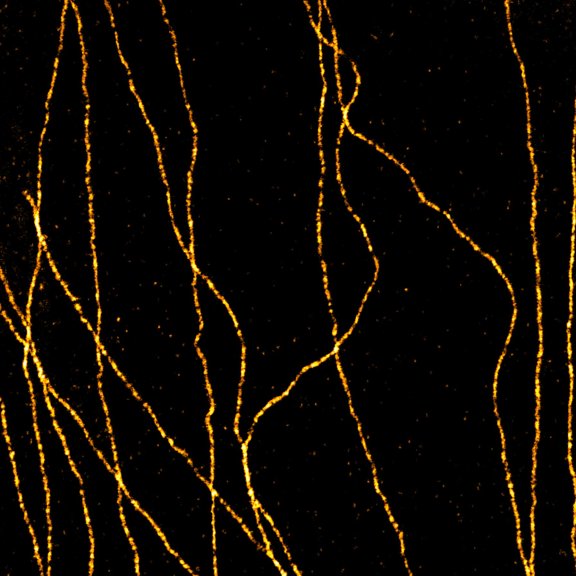
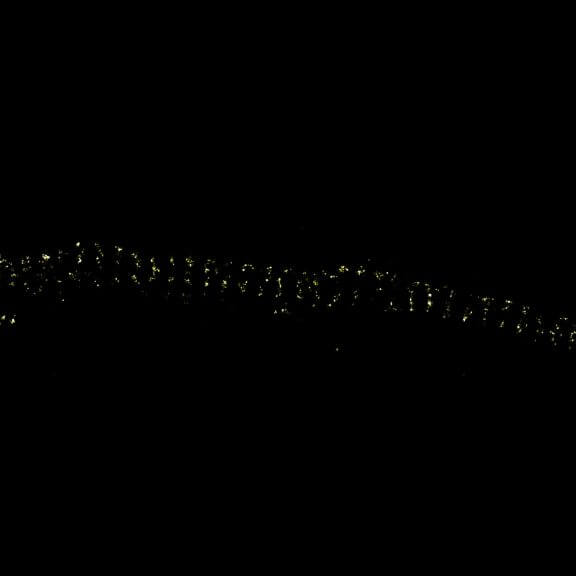
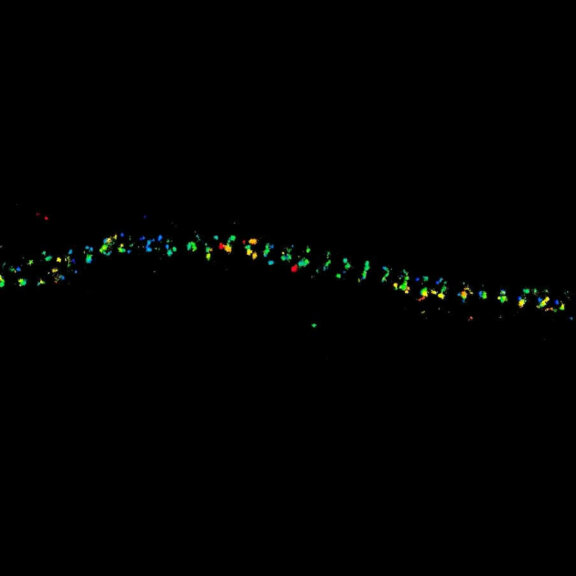
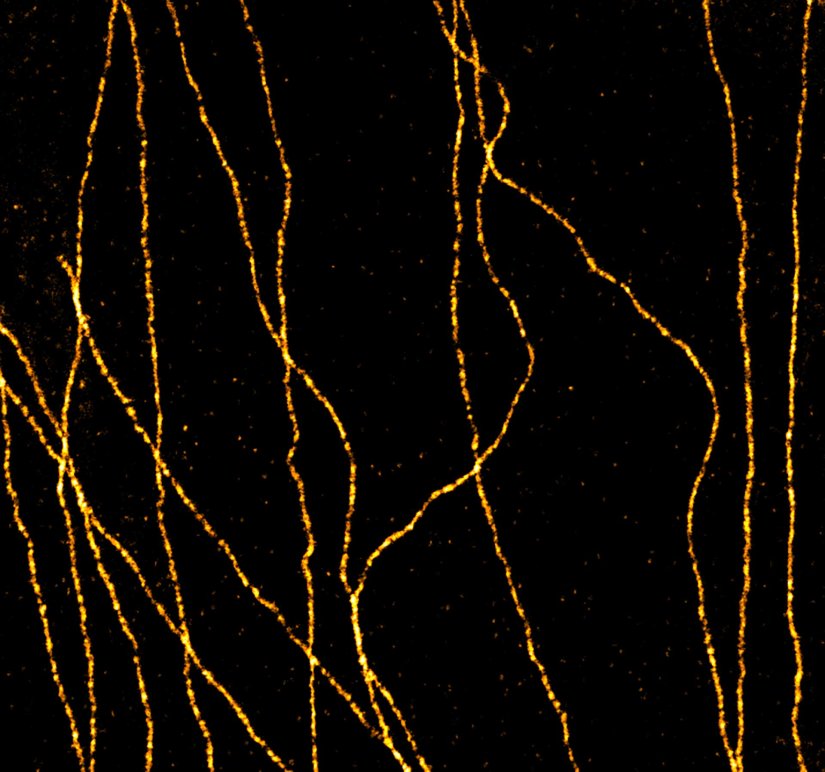
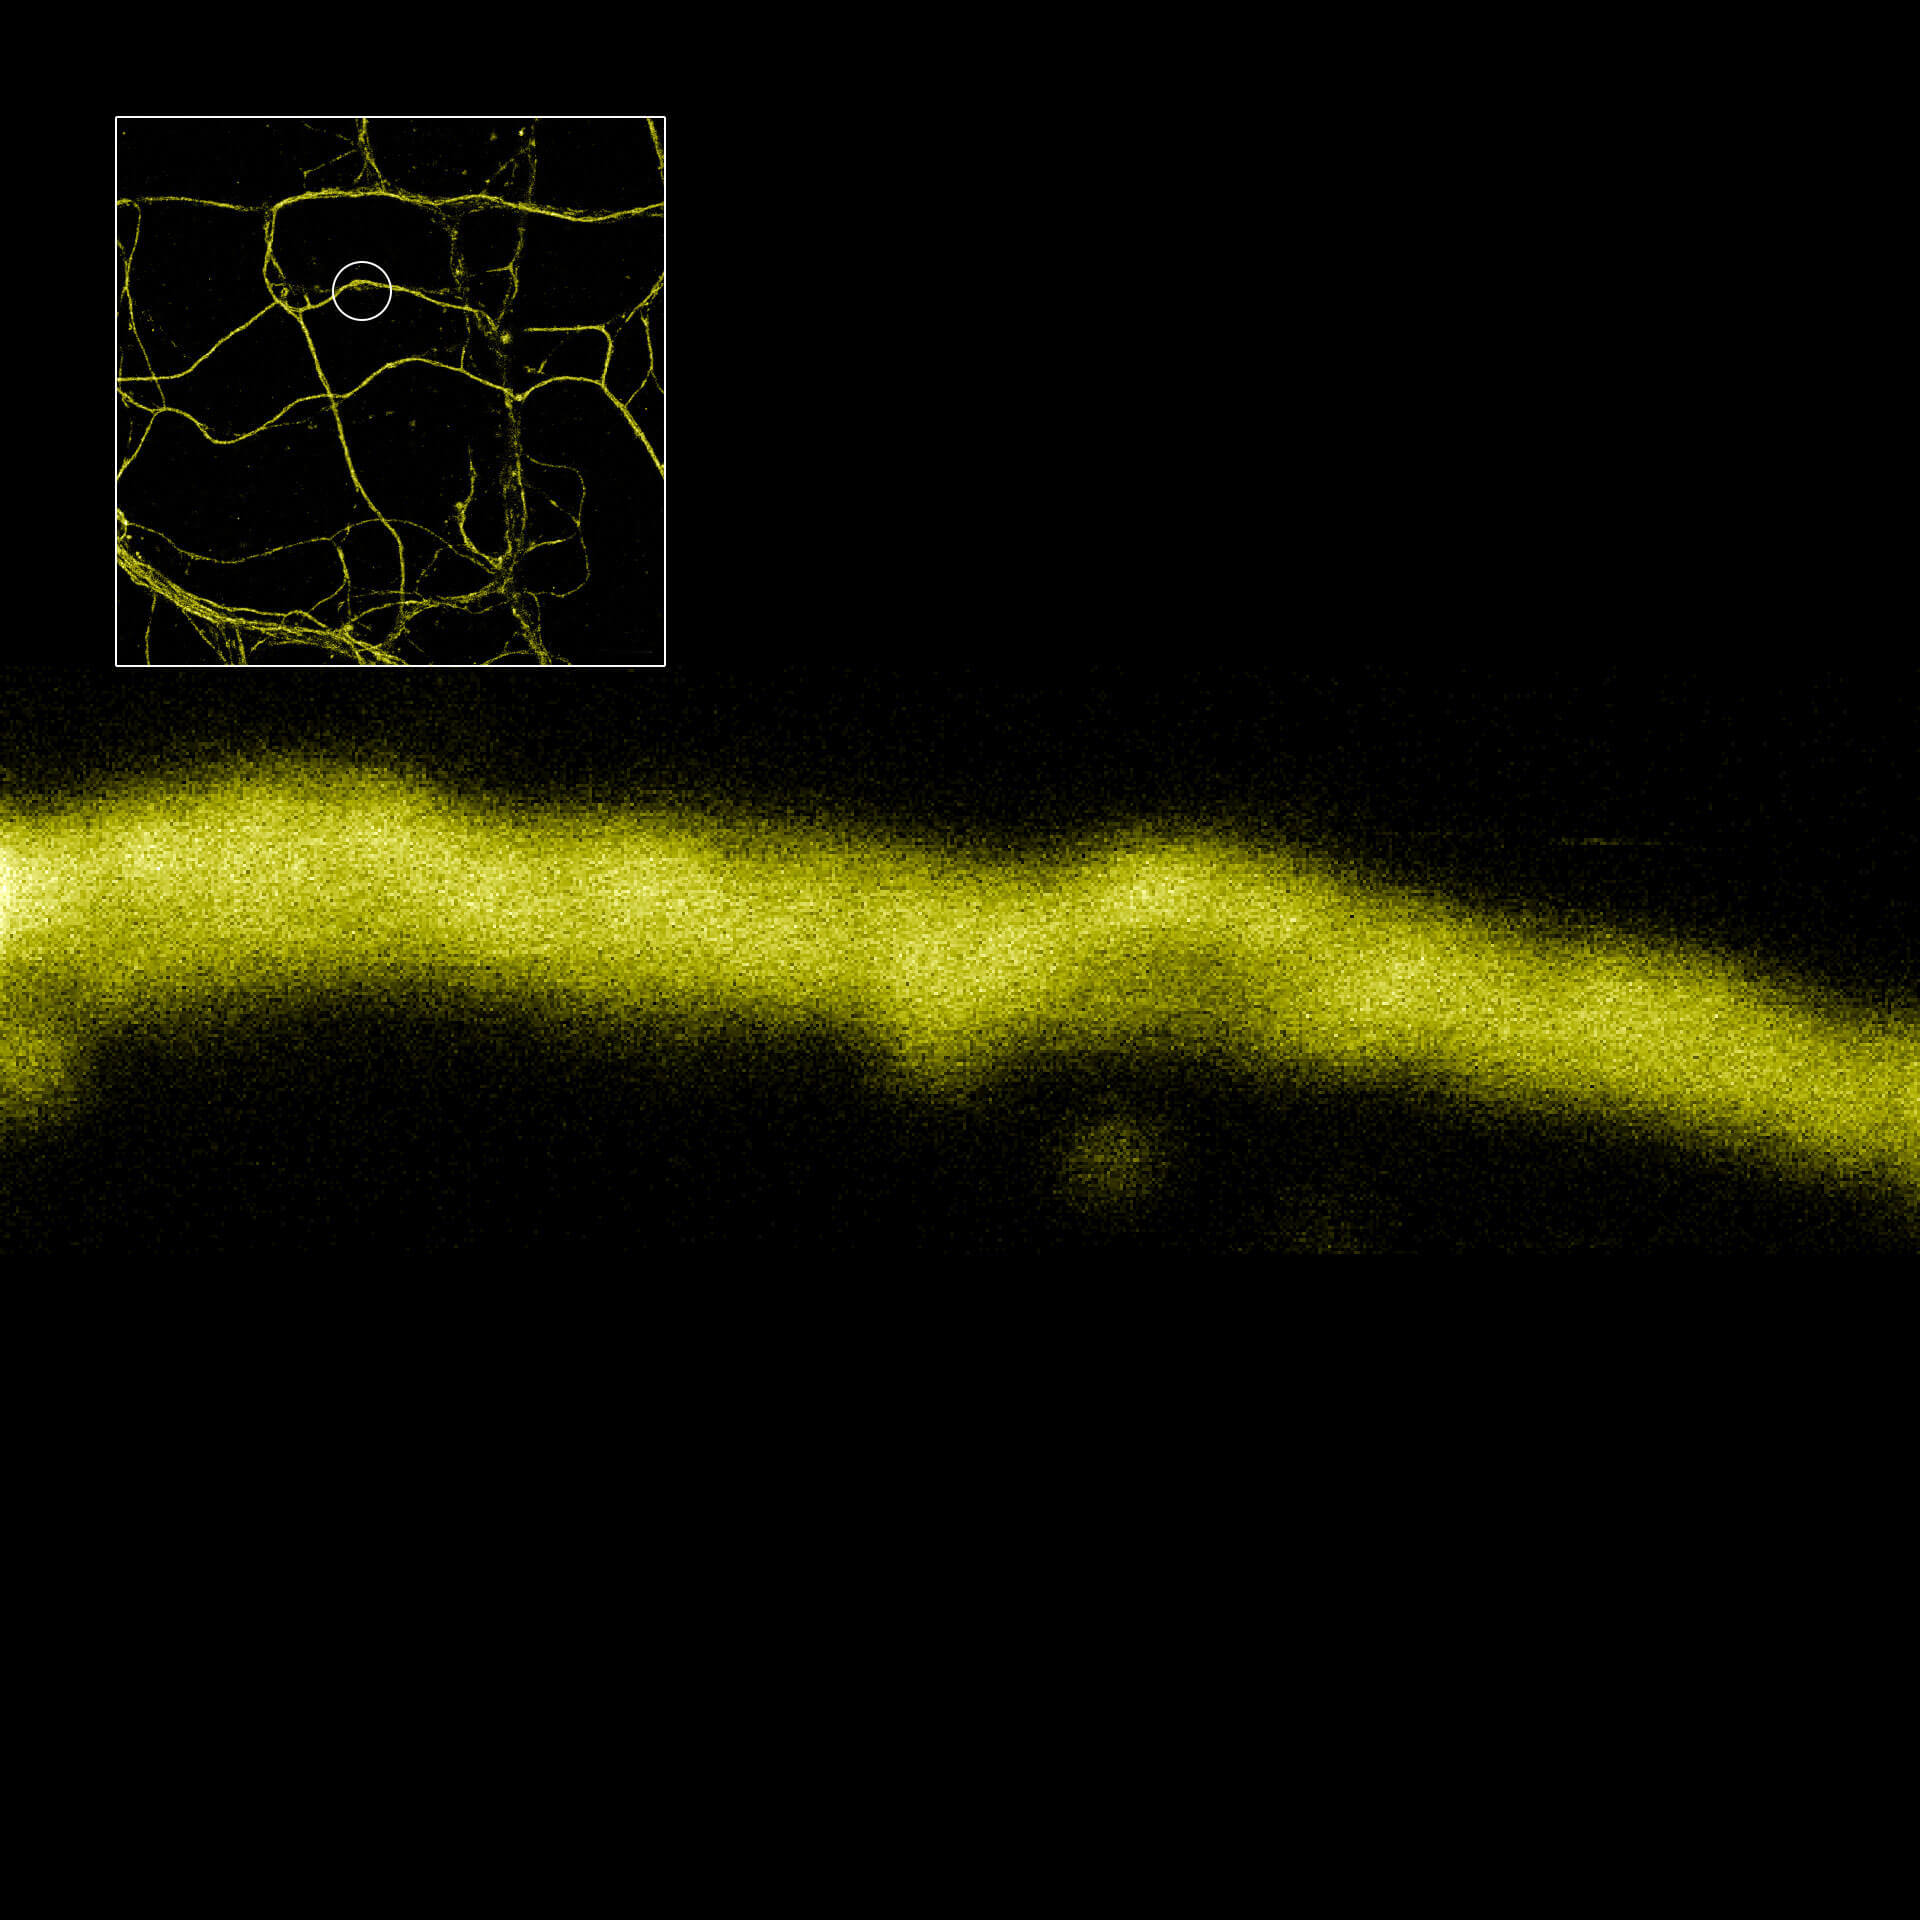
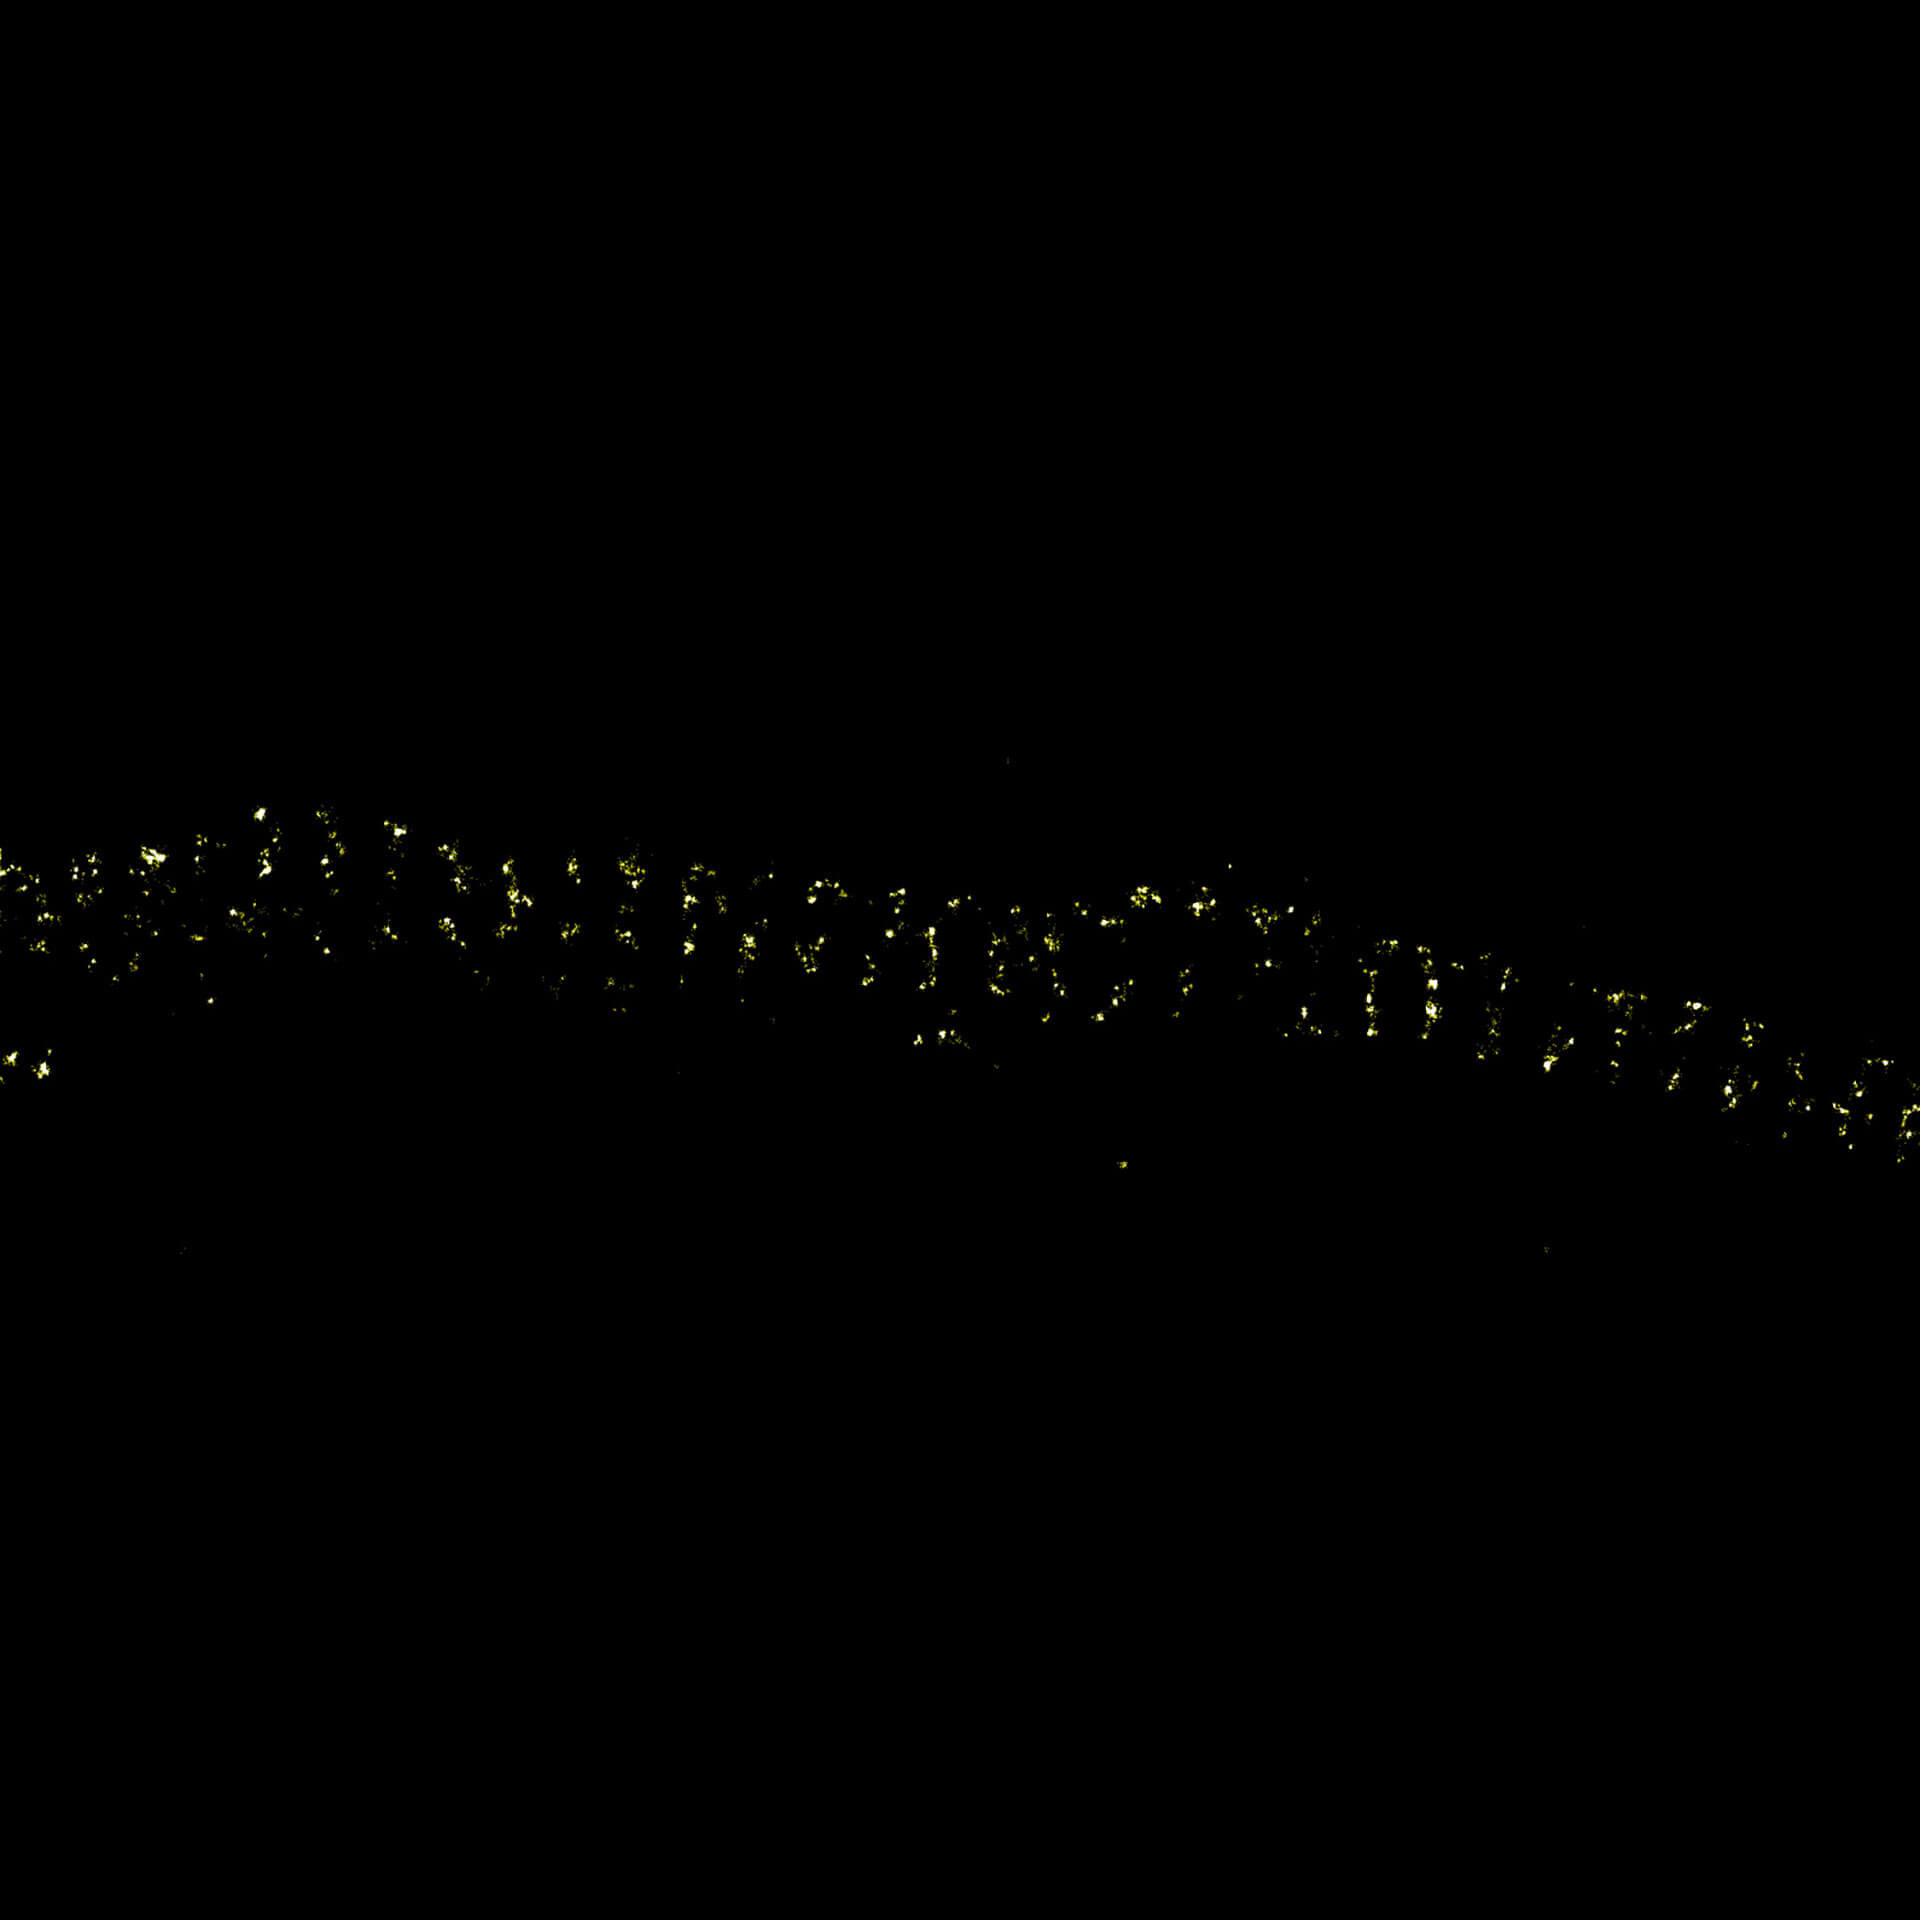
MINFLUX imaging of βII spectrin in a primary hippocampal neuron labeled with abberior FLUX 680 by indirect immunofluorescence. Please note the periodic arrangement of spectrin along the axon.
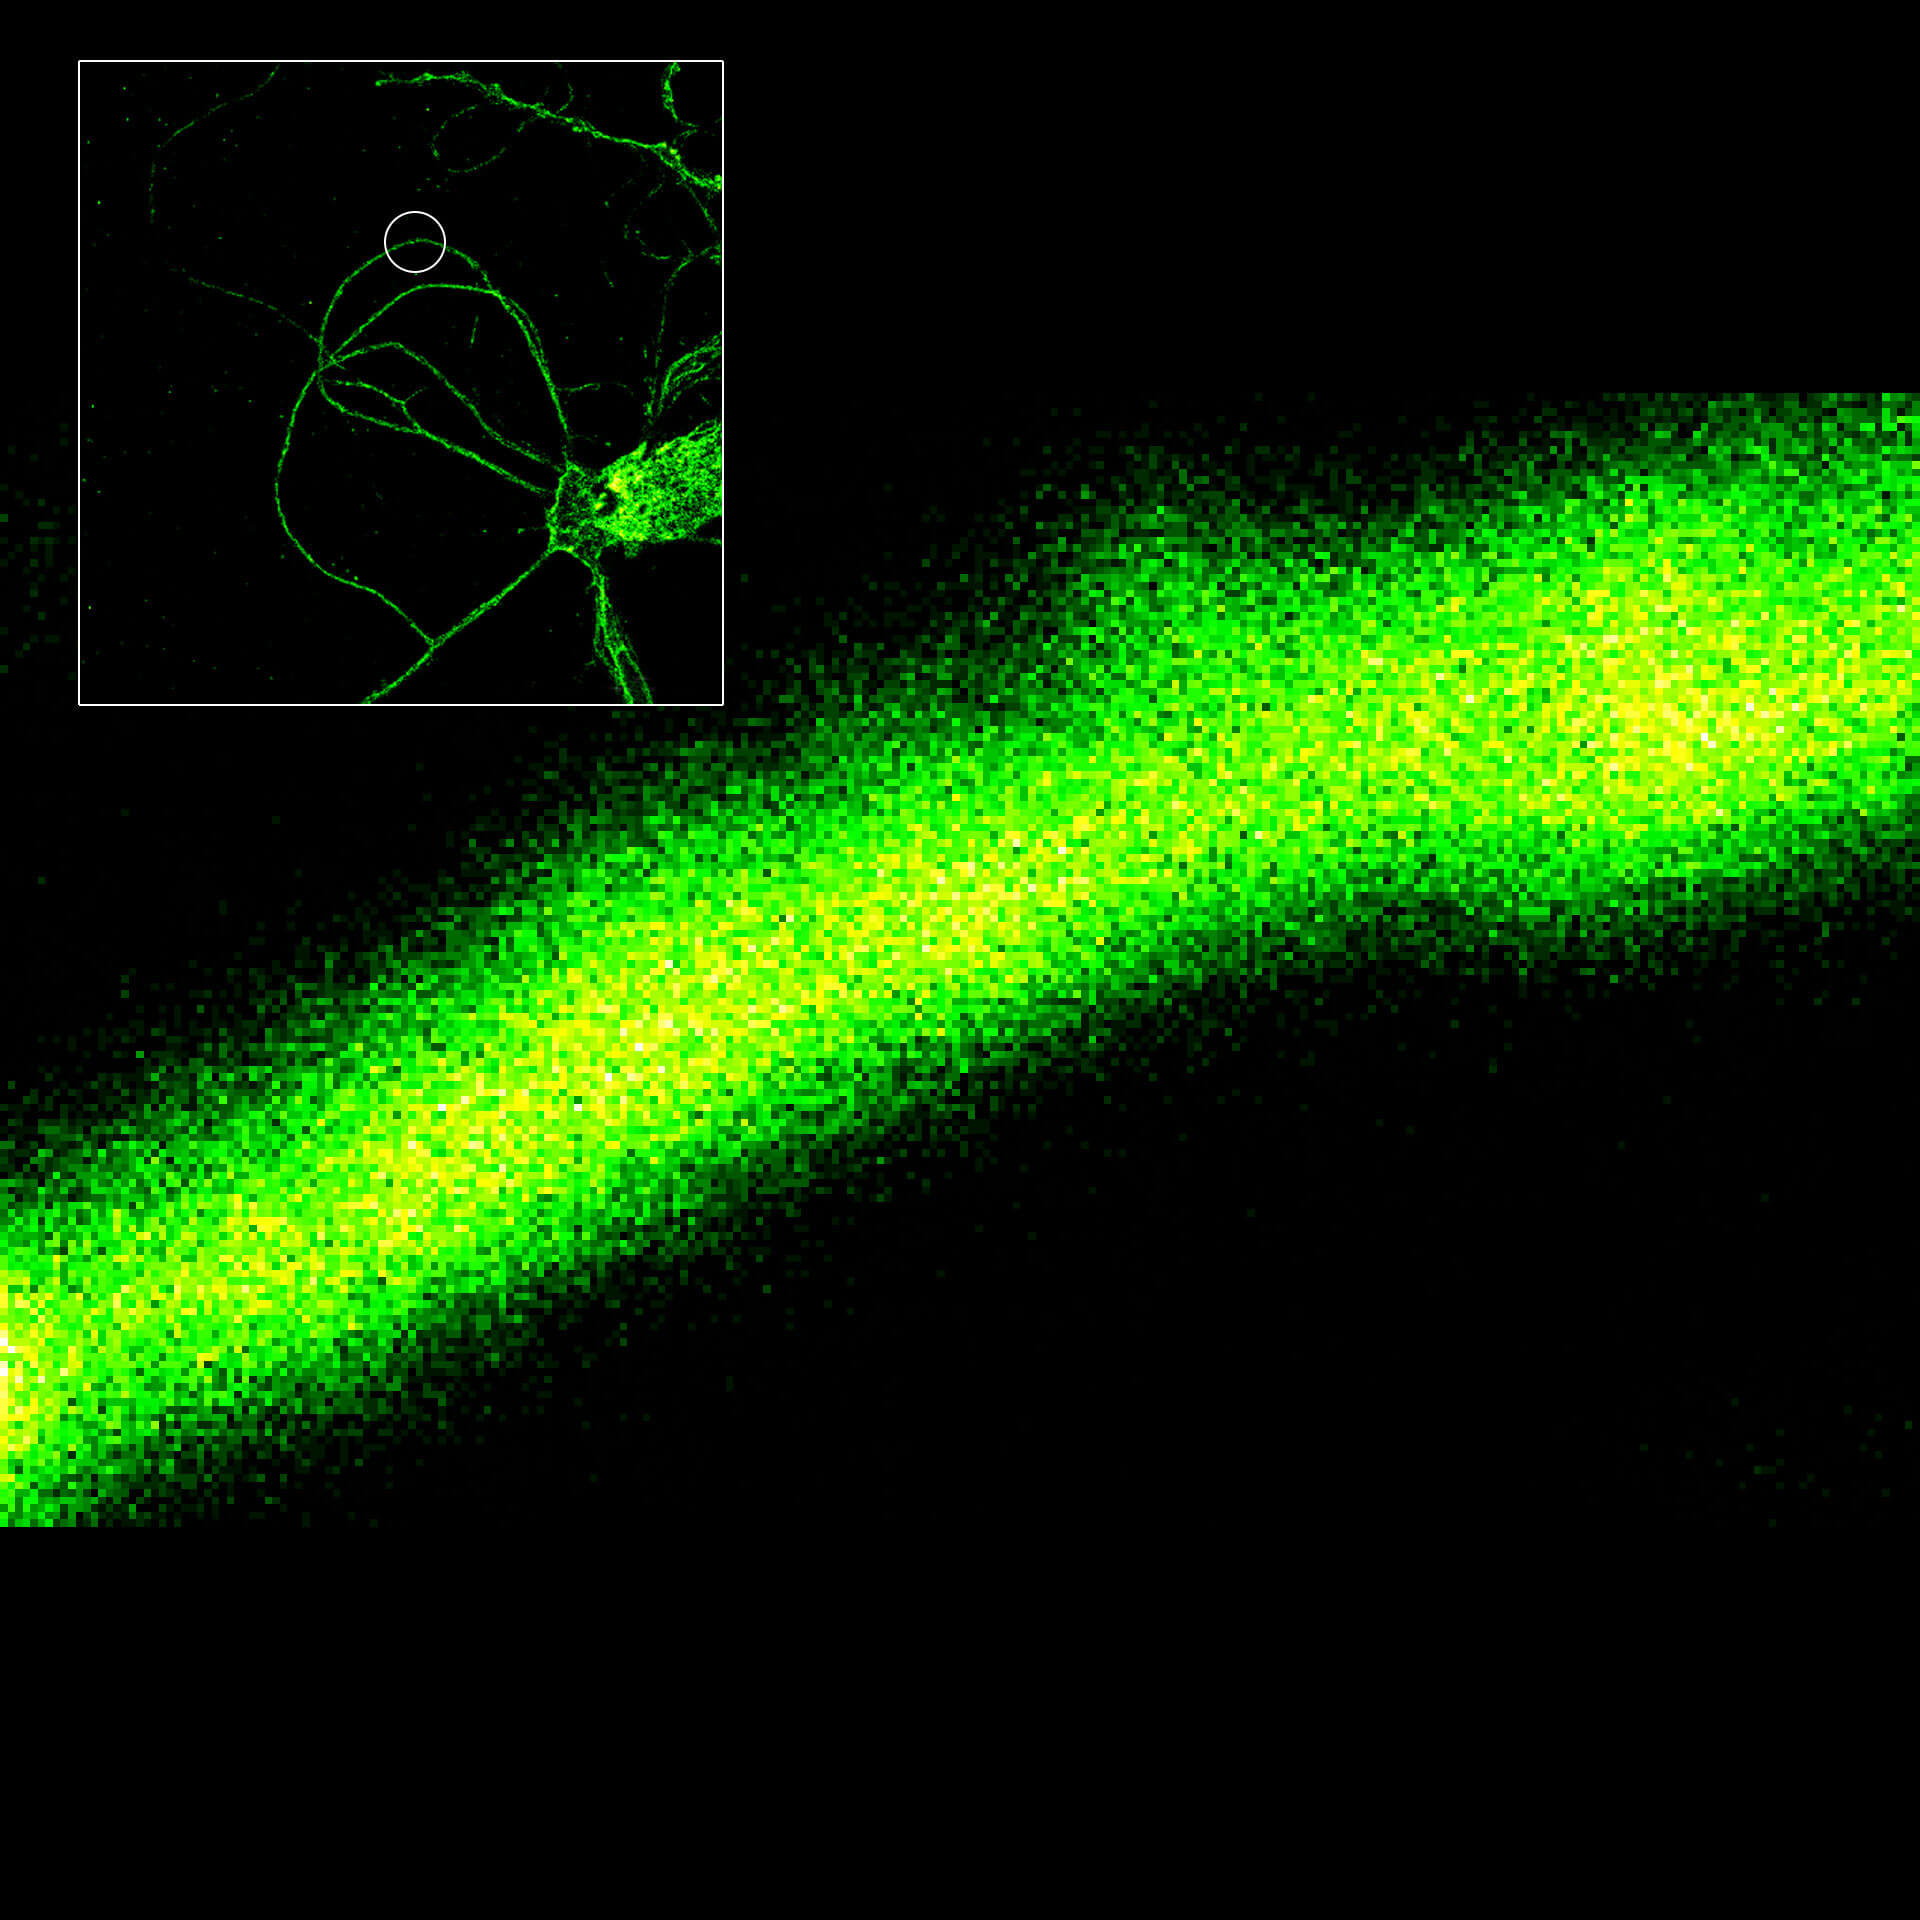
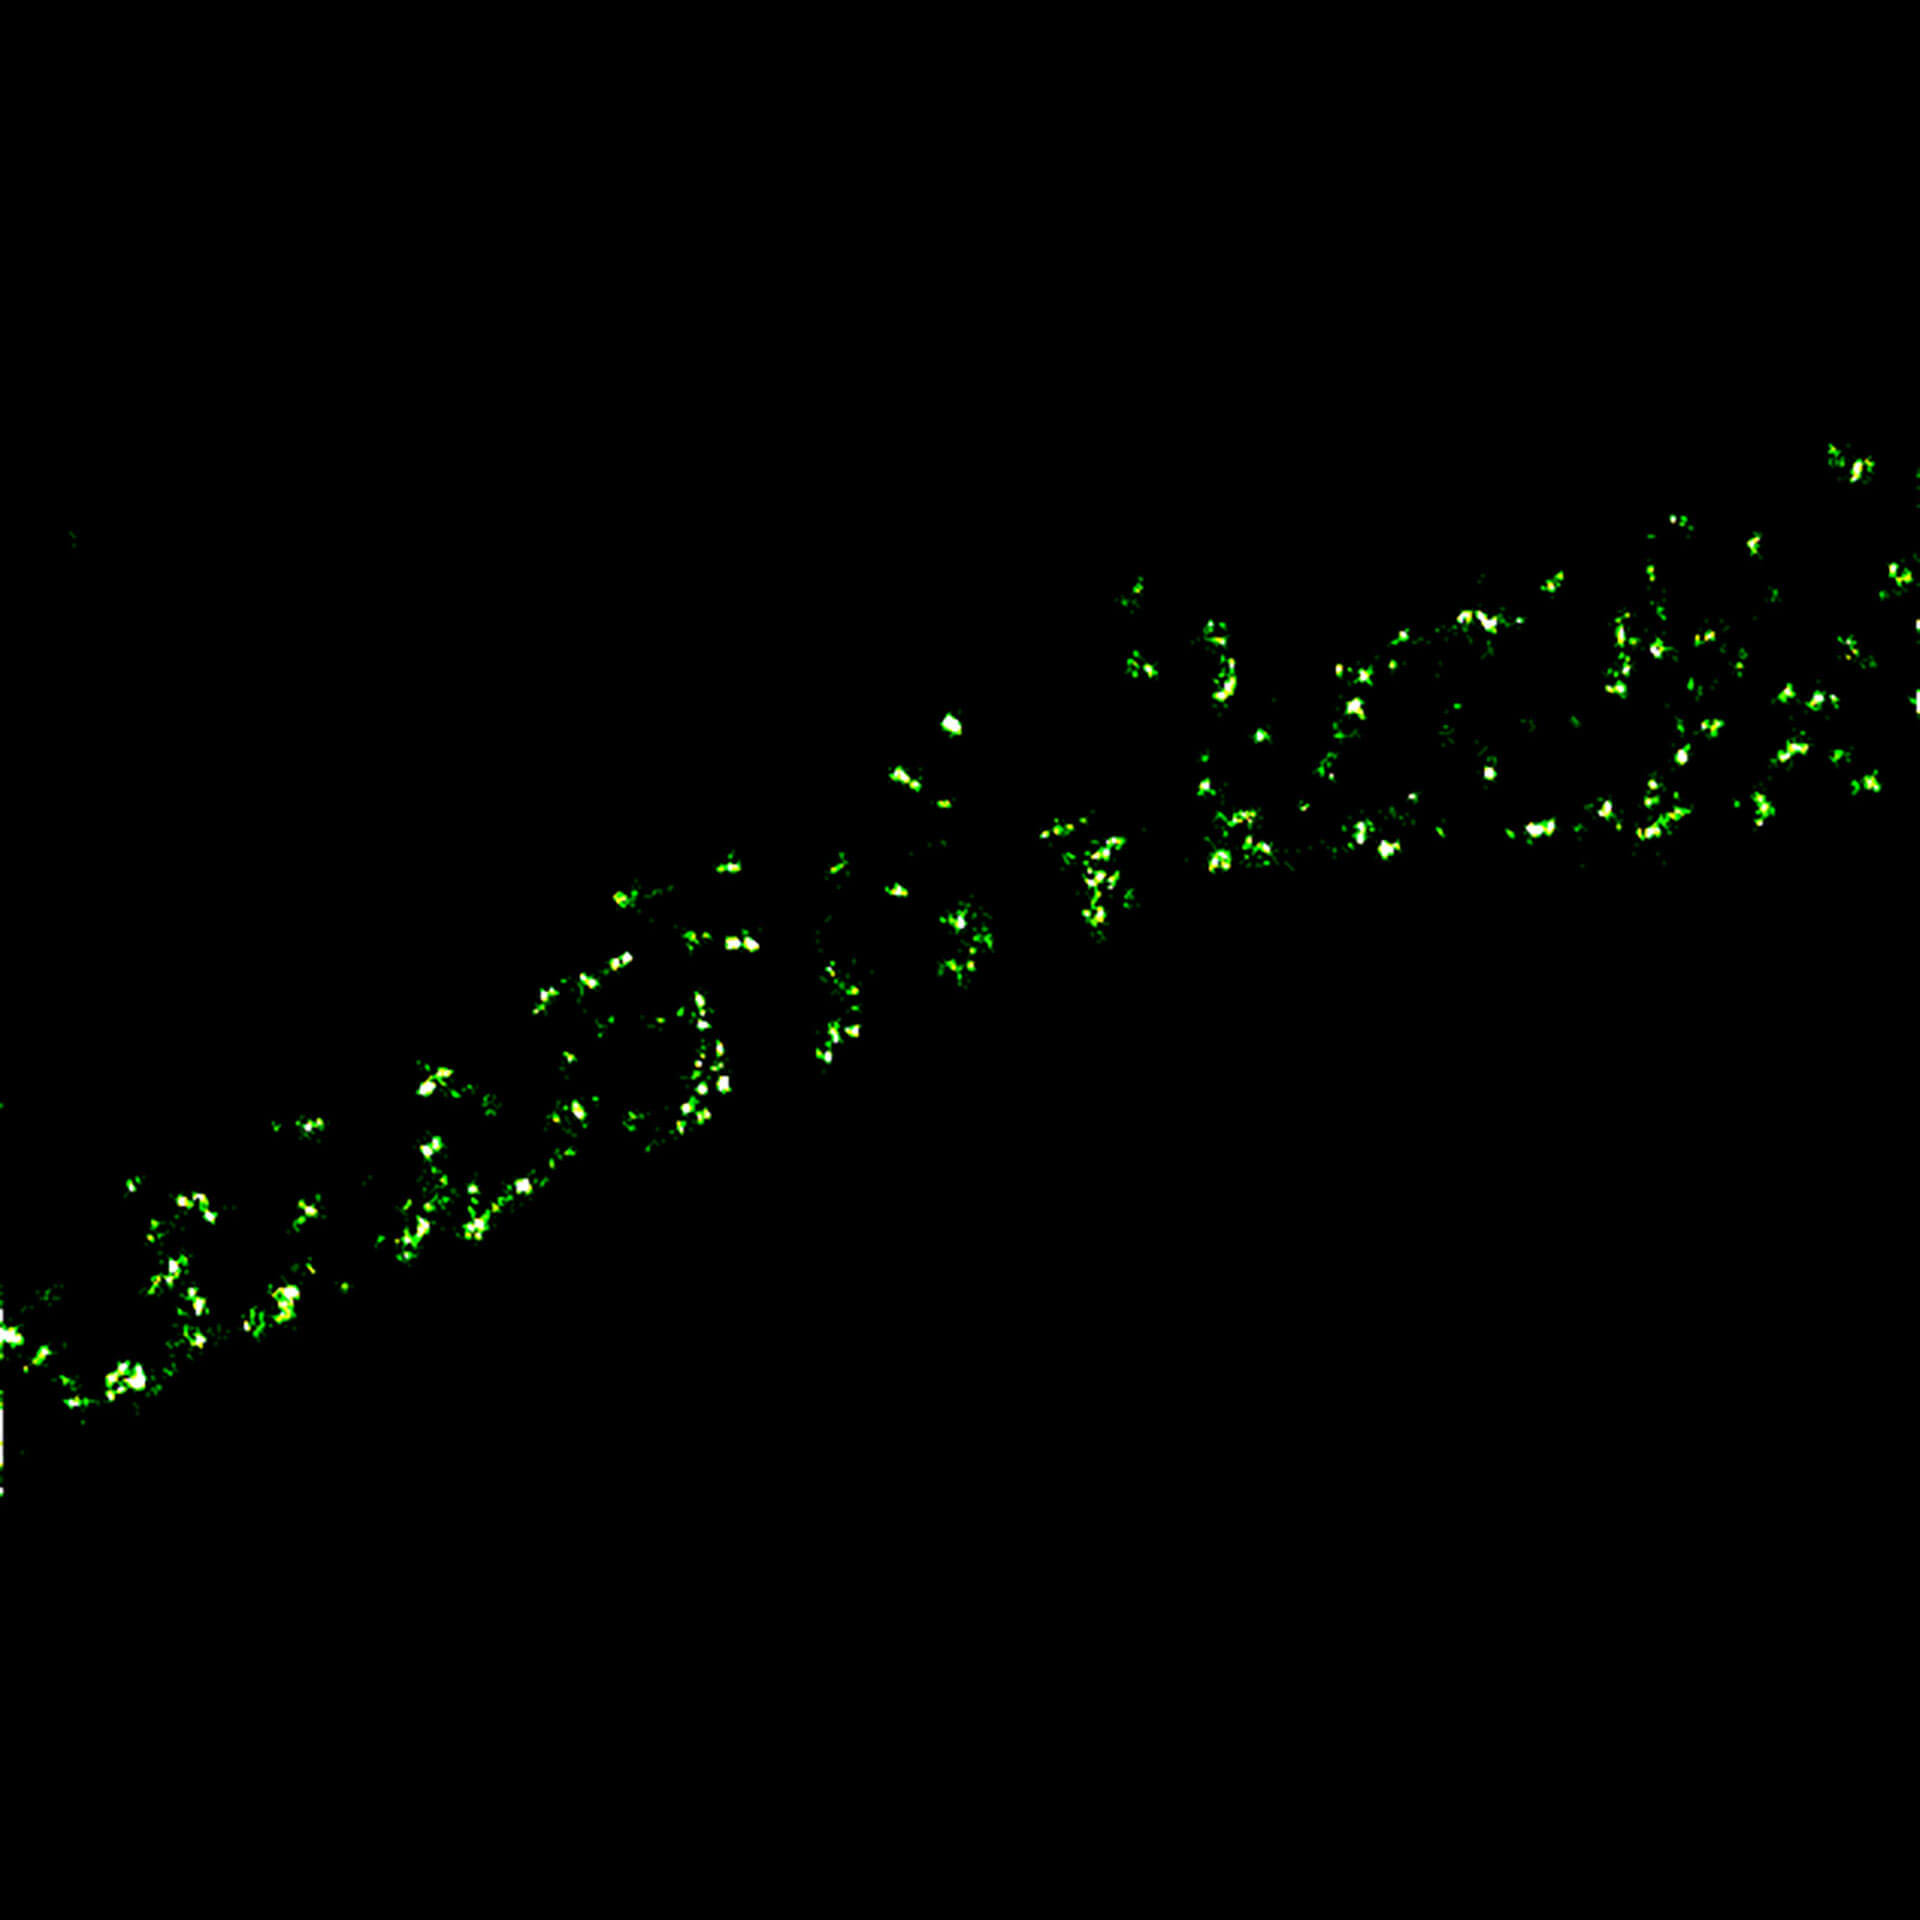
Description
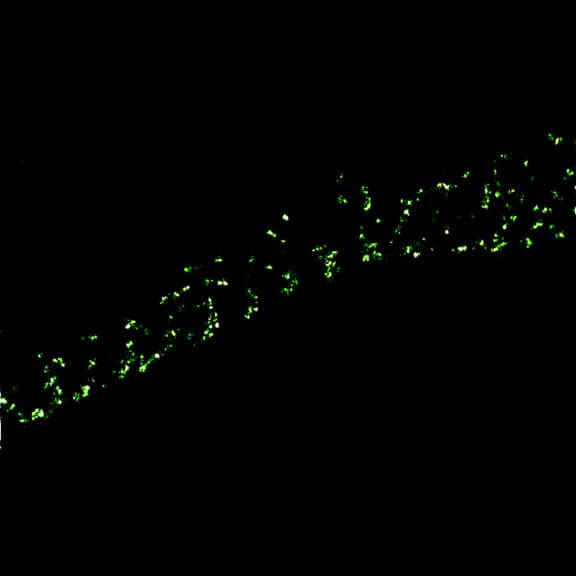
MINFLUX image of axonal βII spectrin labeled with abberior FLUX 660 in primary hippocampal neurons. Note the periodic arrangement of spectrin along the axon, and the absence of any details in the confocal counterpart image.
Description
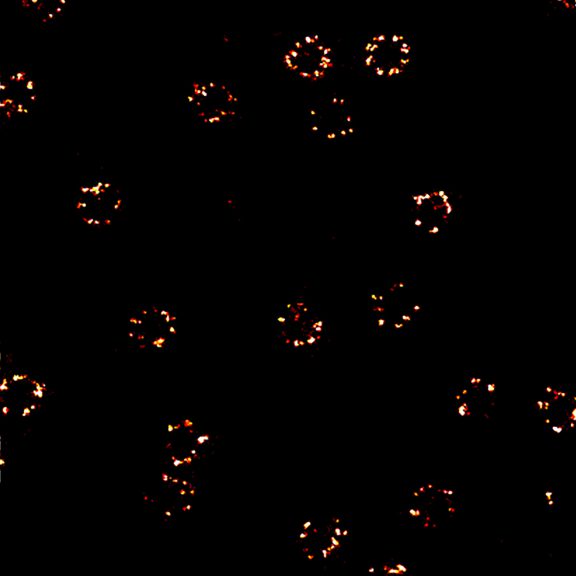
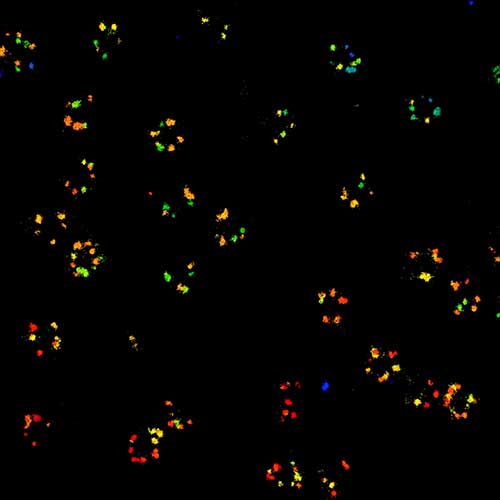
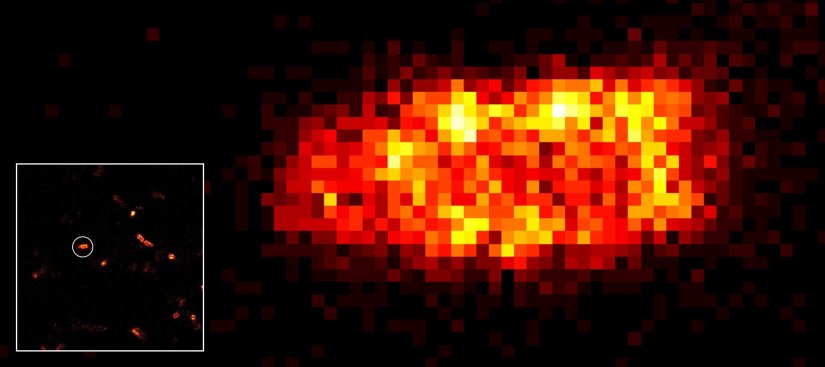
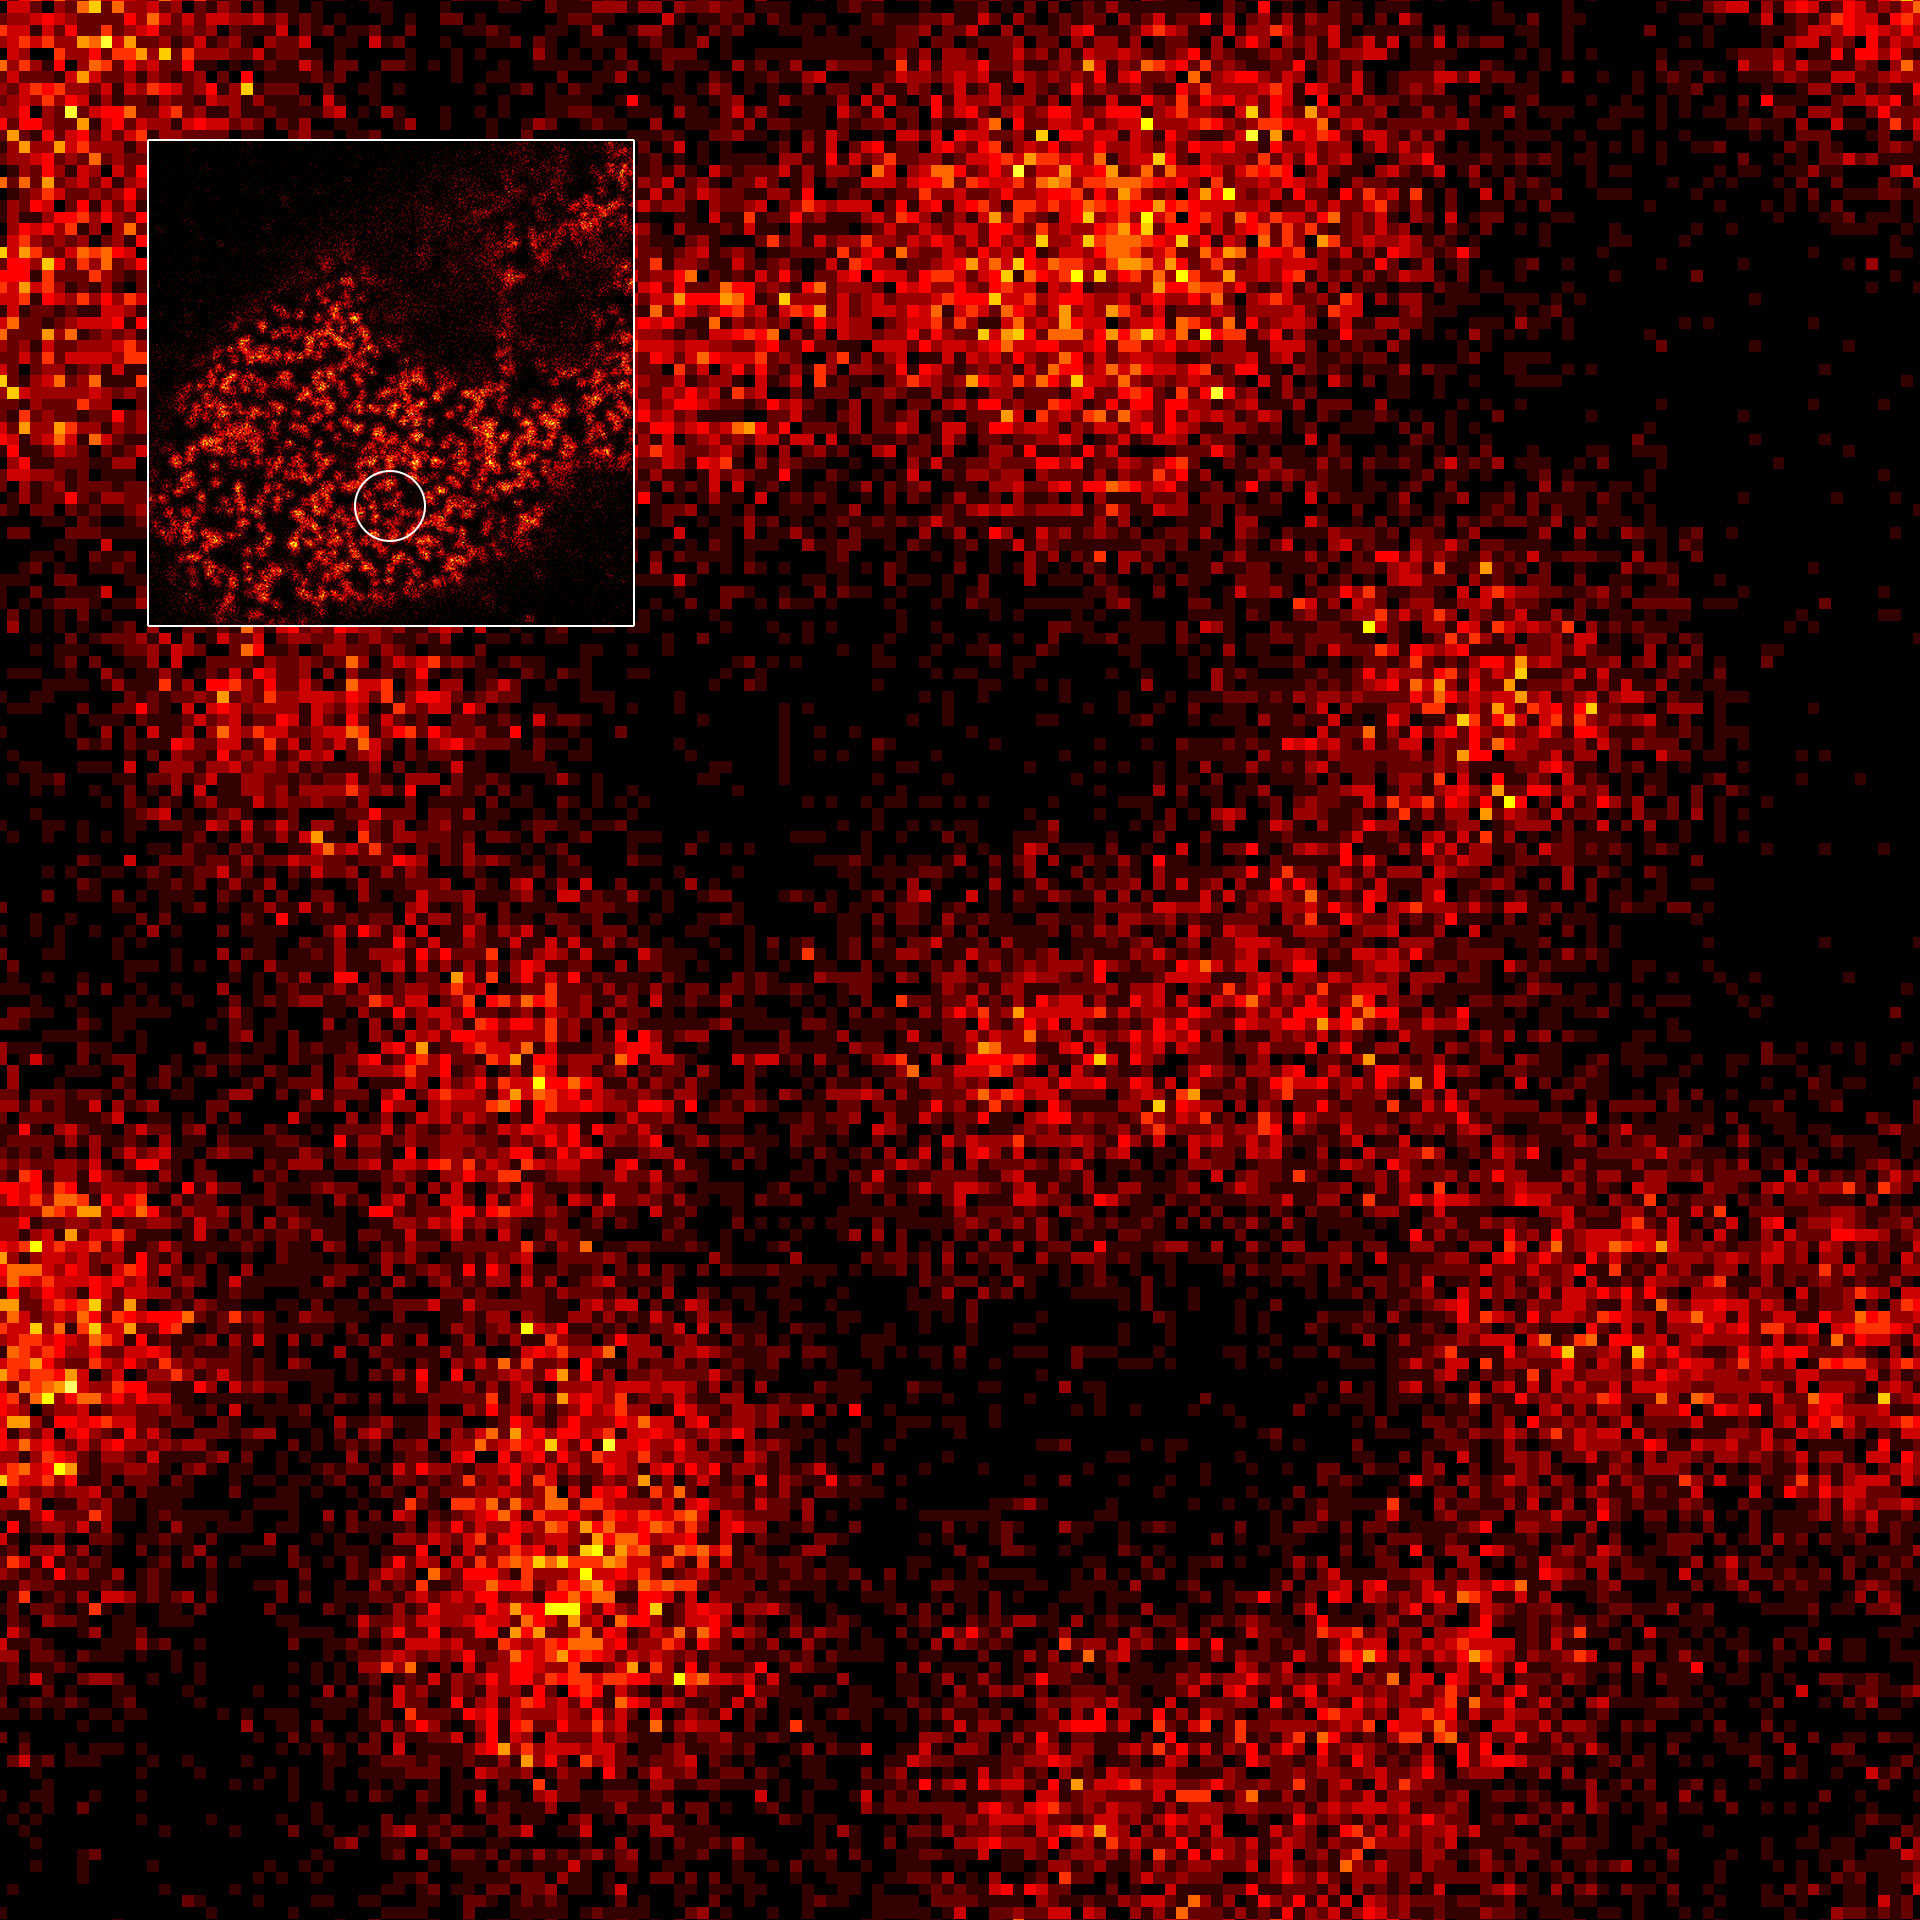
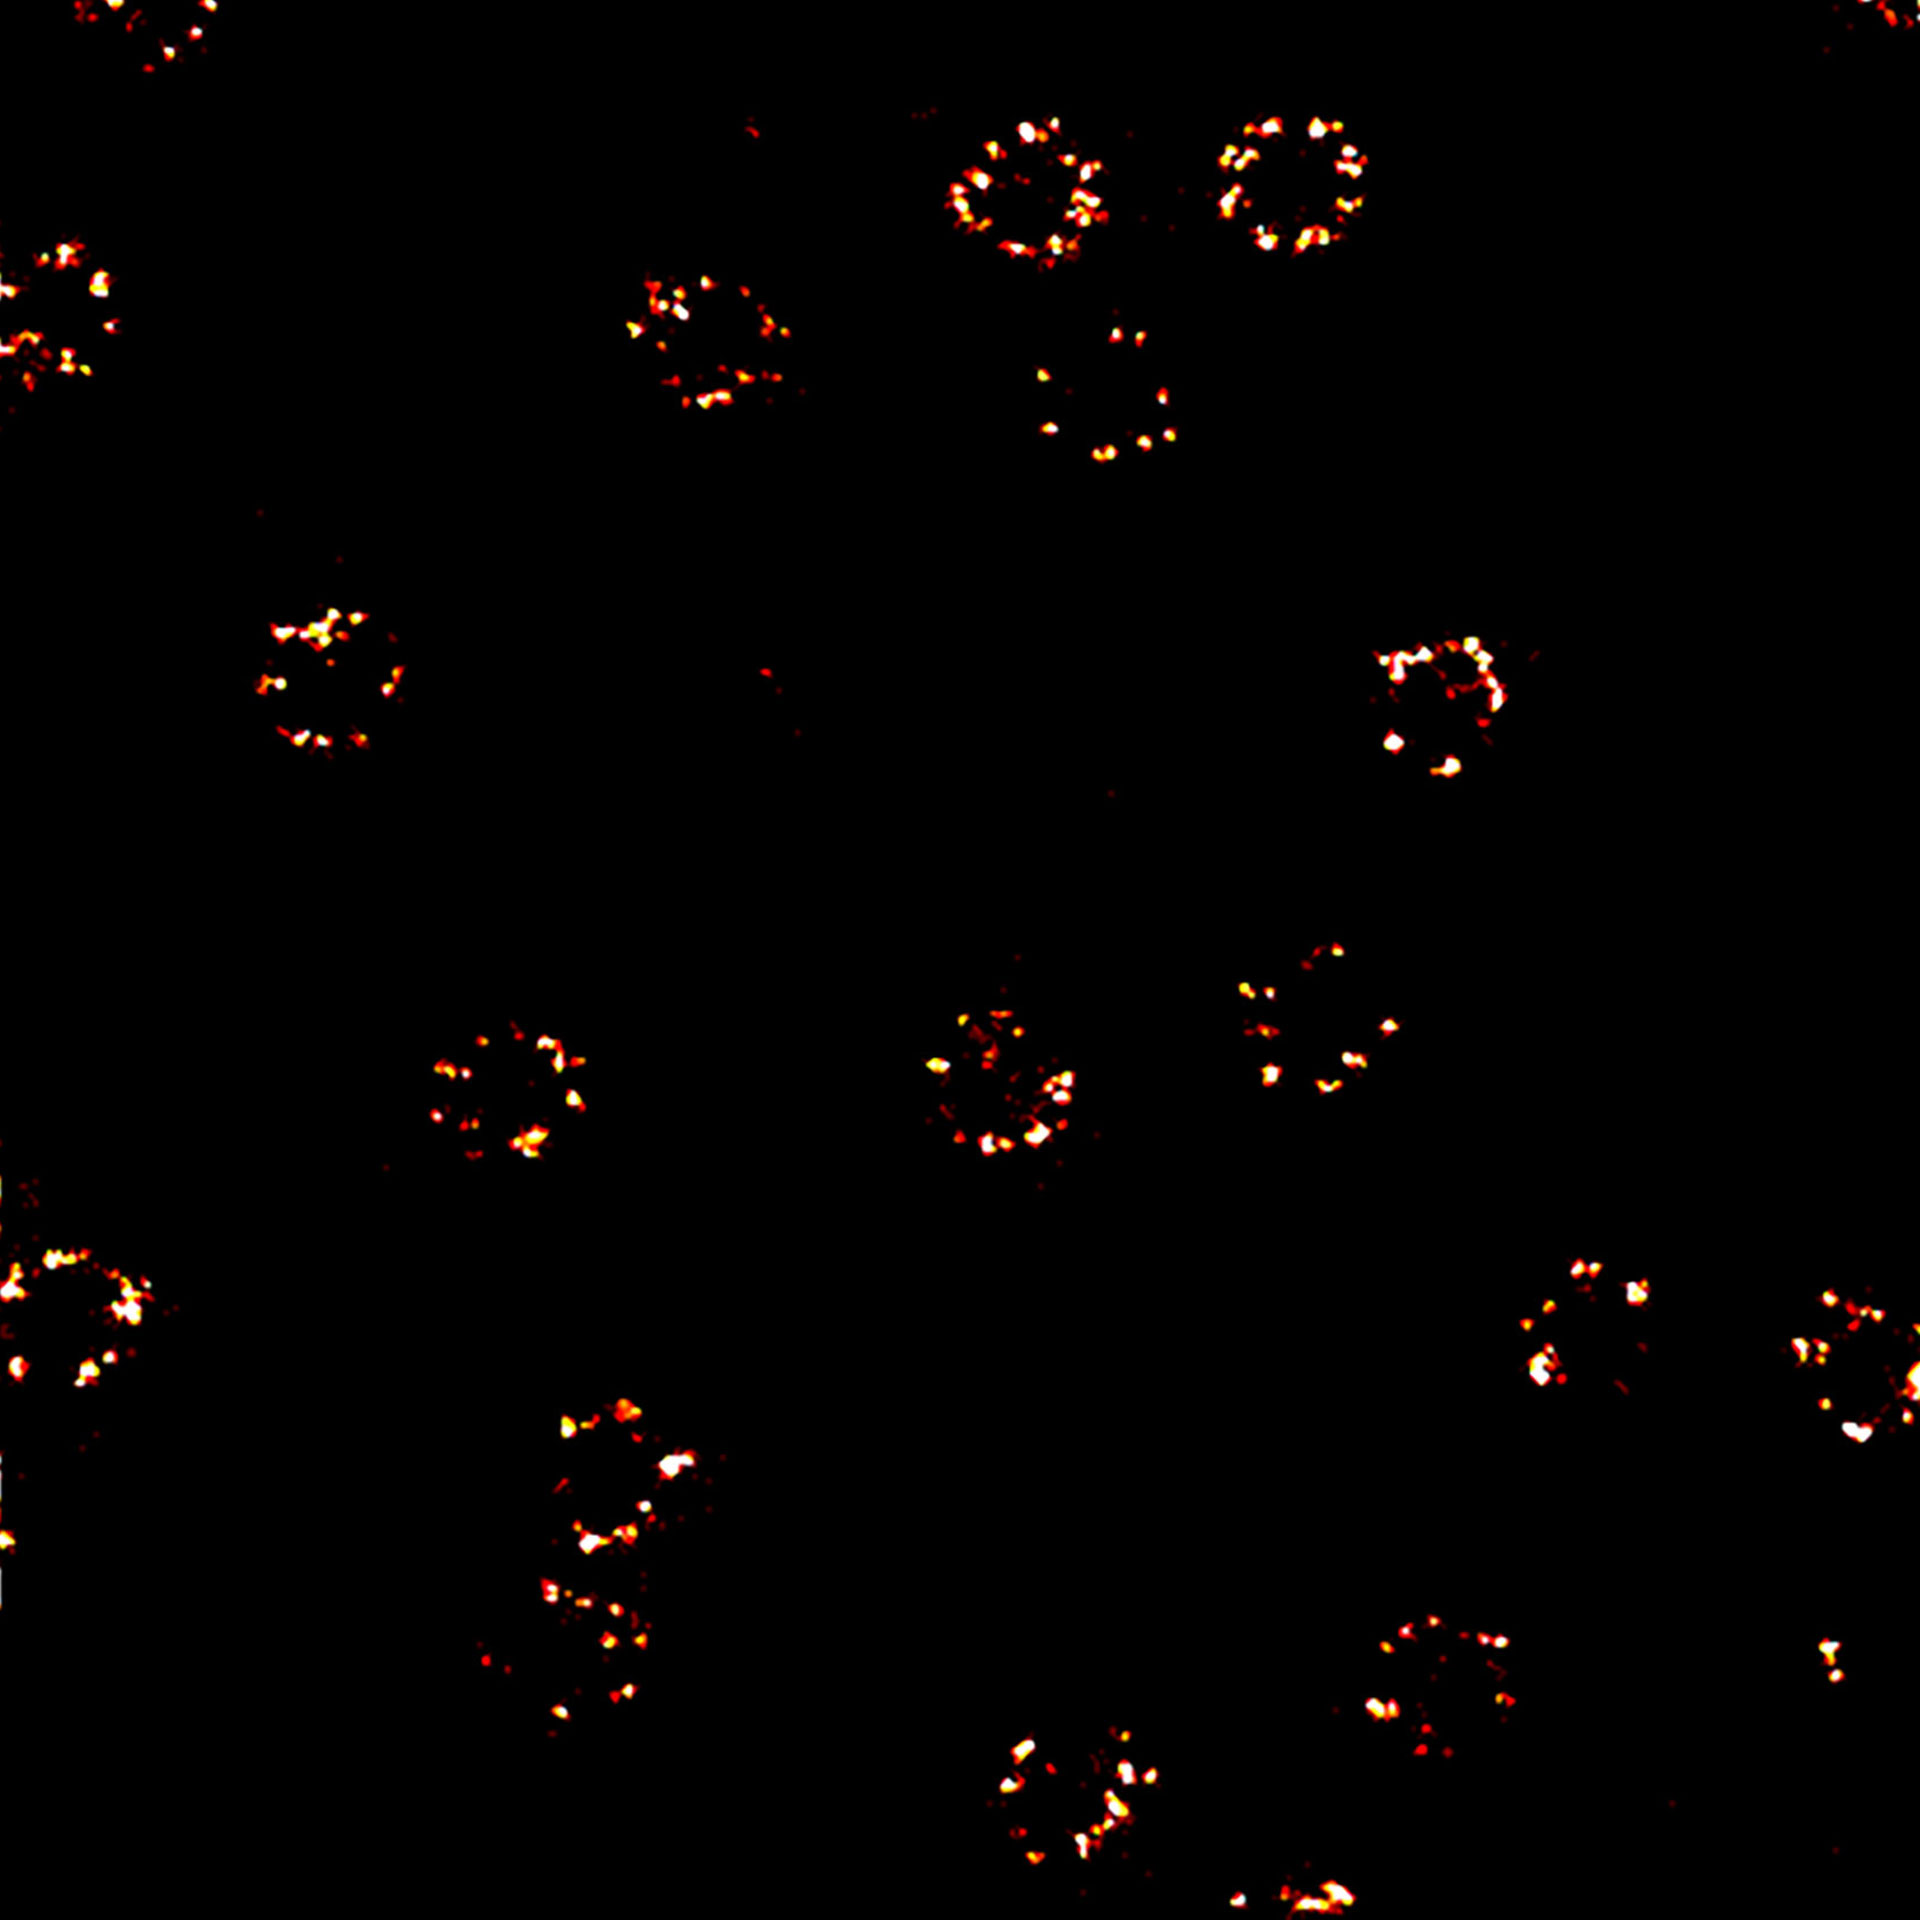
2D MINFLUX nanoscopy of the nuclear pore complex subunits. Fixed mammalian cells expressing SNAP-tag® NUP96 were labeled with abberior FLUX 647 SNAP. In contrast to confocal microscopy, 2D MINFLUX allows to visualize the shape and arrangement of individual subunits of the nuclear pore complex.

Description
2D MINFLUX imaging of the peroxisomal membrane protein PMP70 labeled with abberior FLUX 640 in fixed mammalian cells using indirect immunofluorescence.
Description
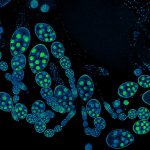
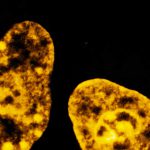
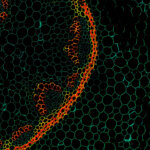
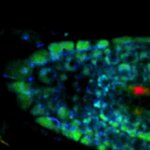
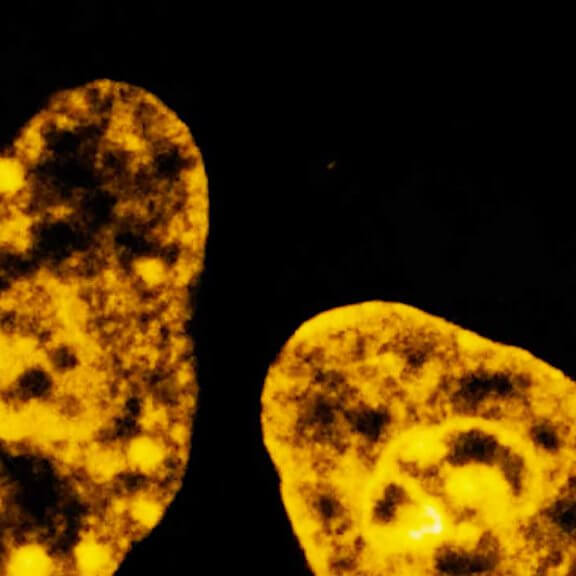
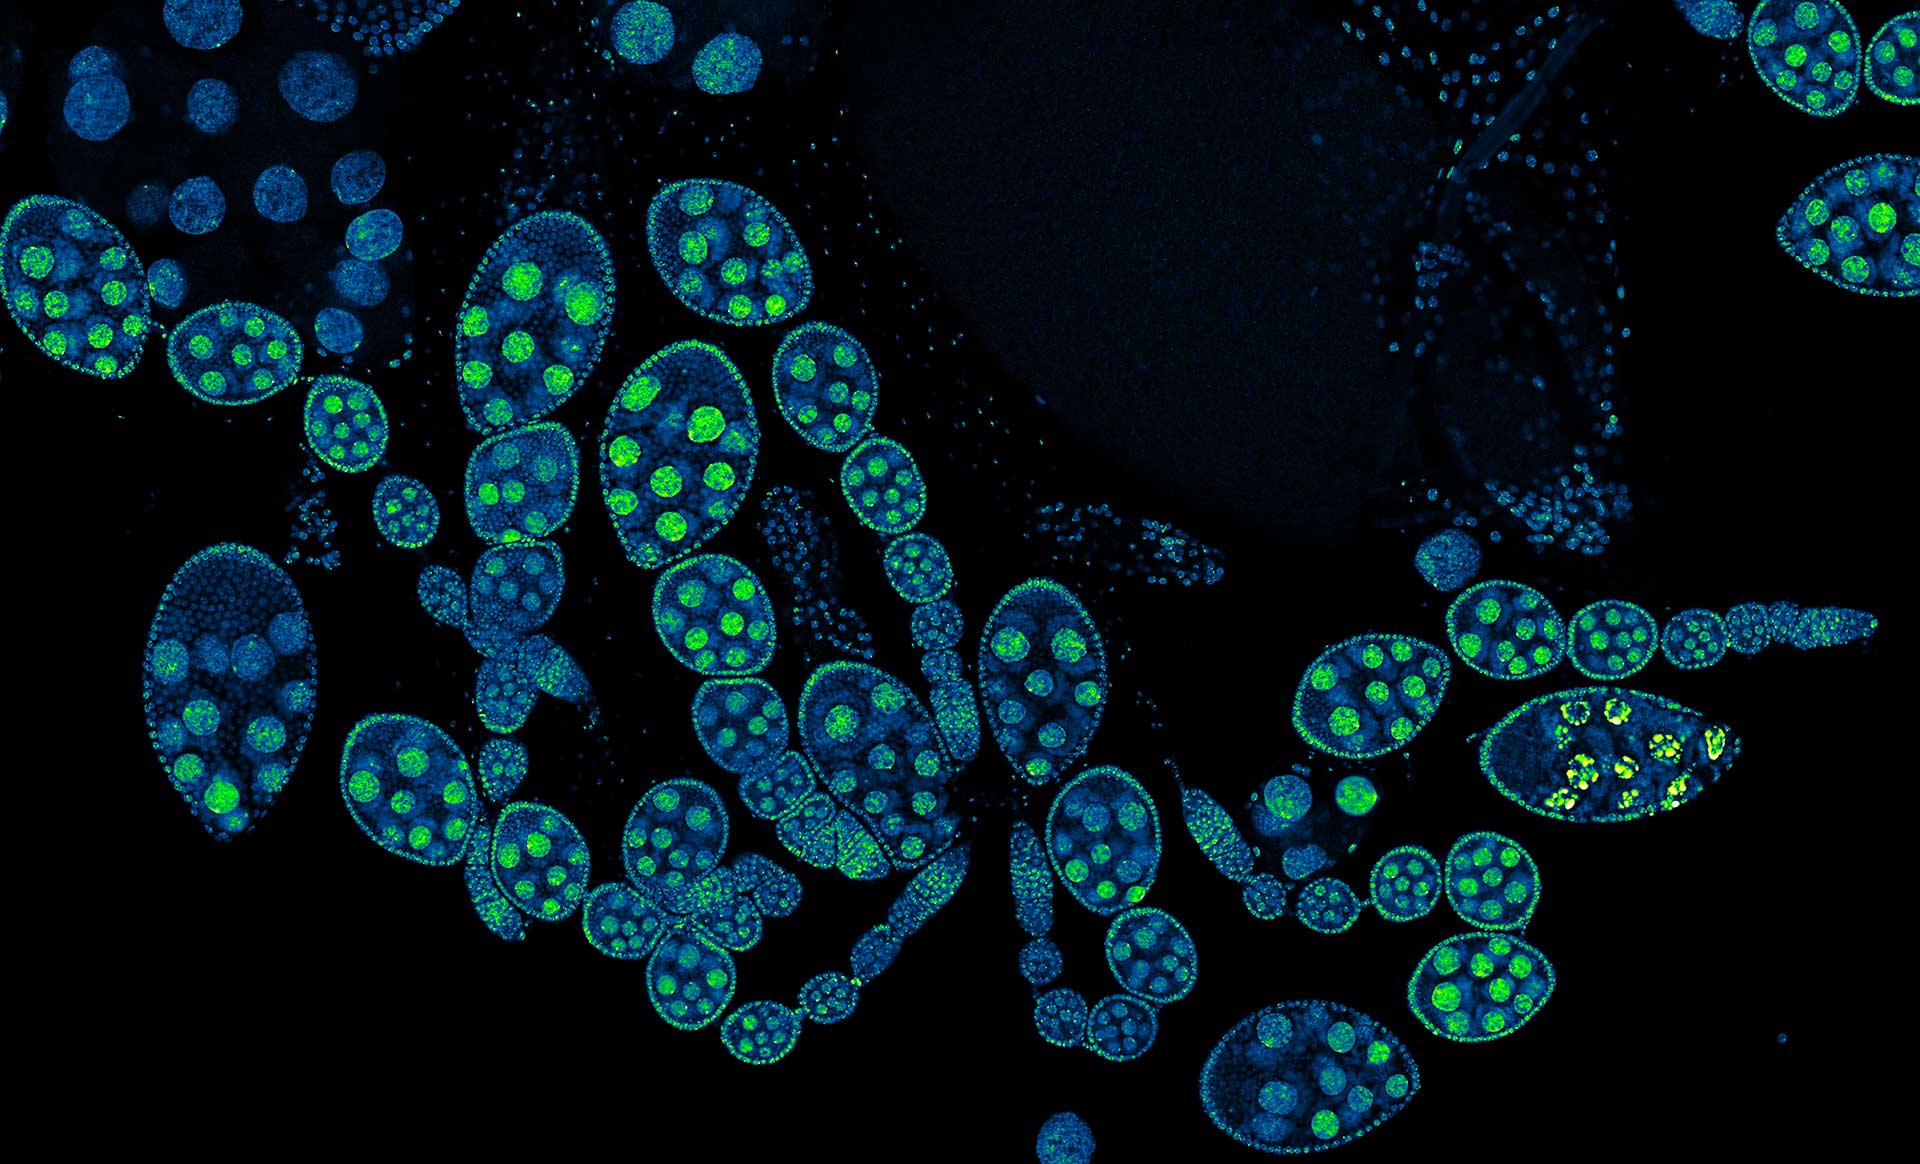
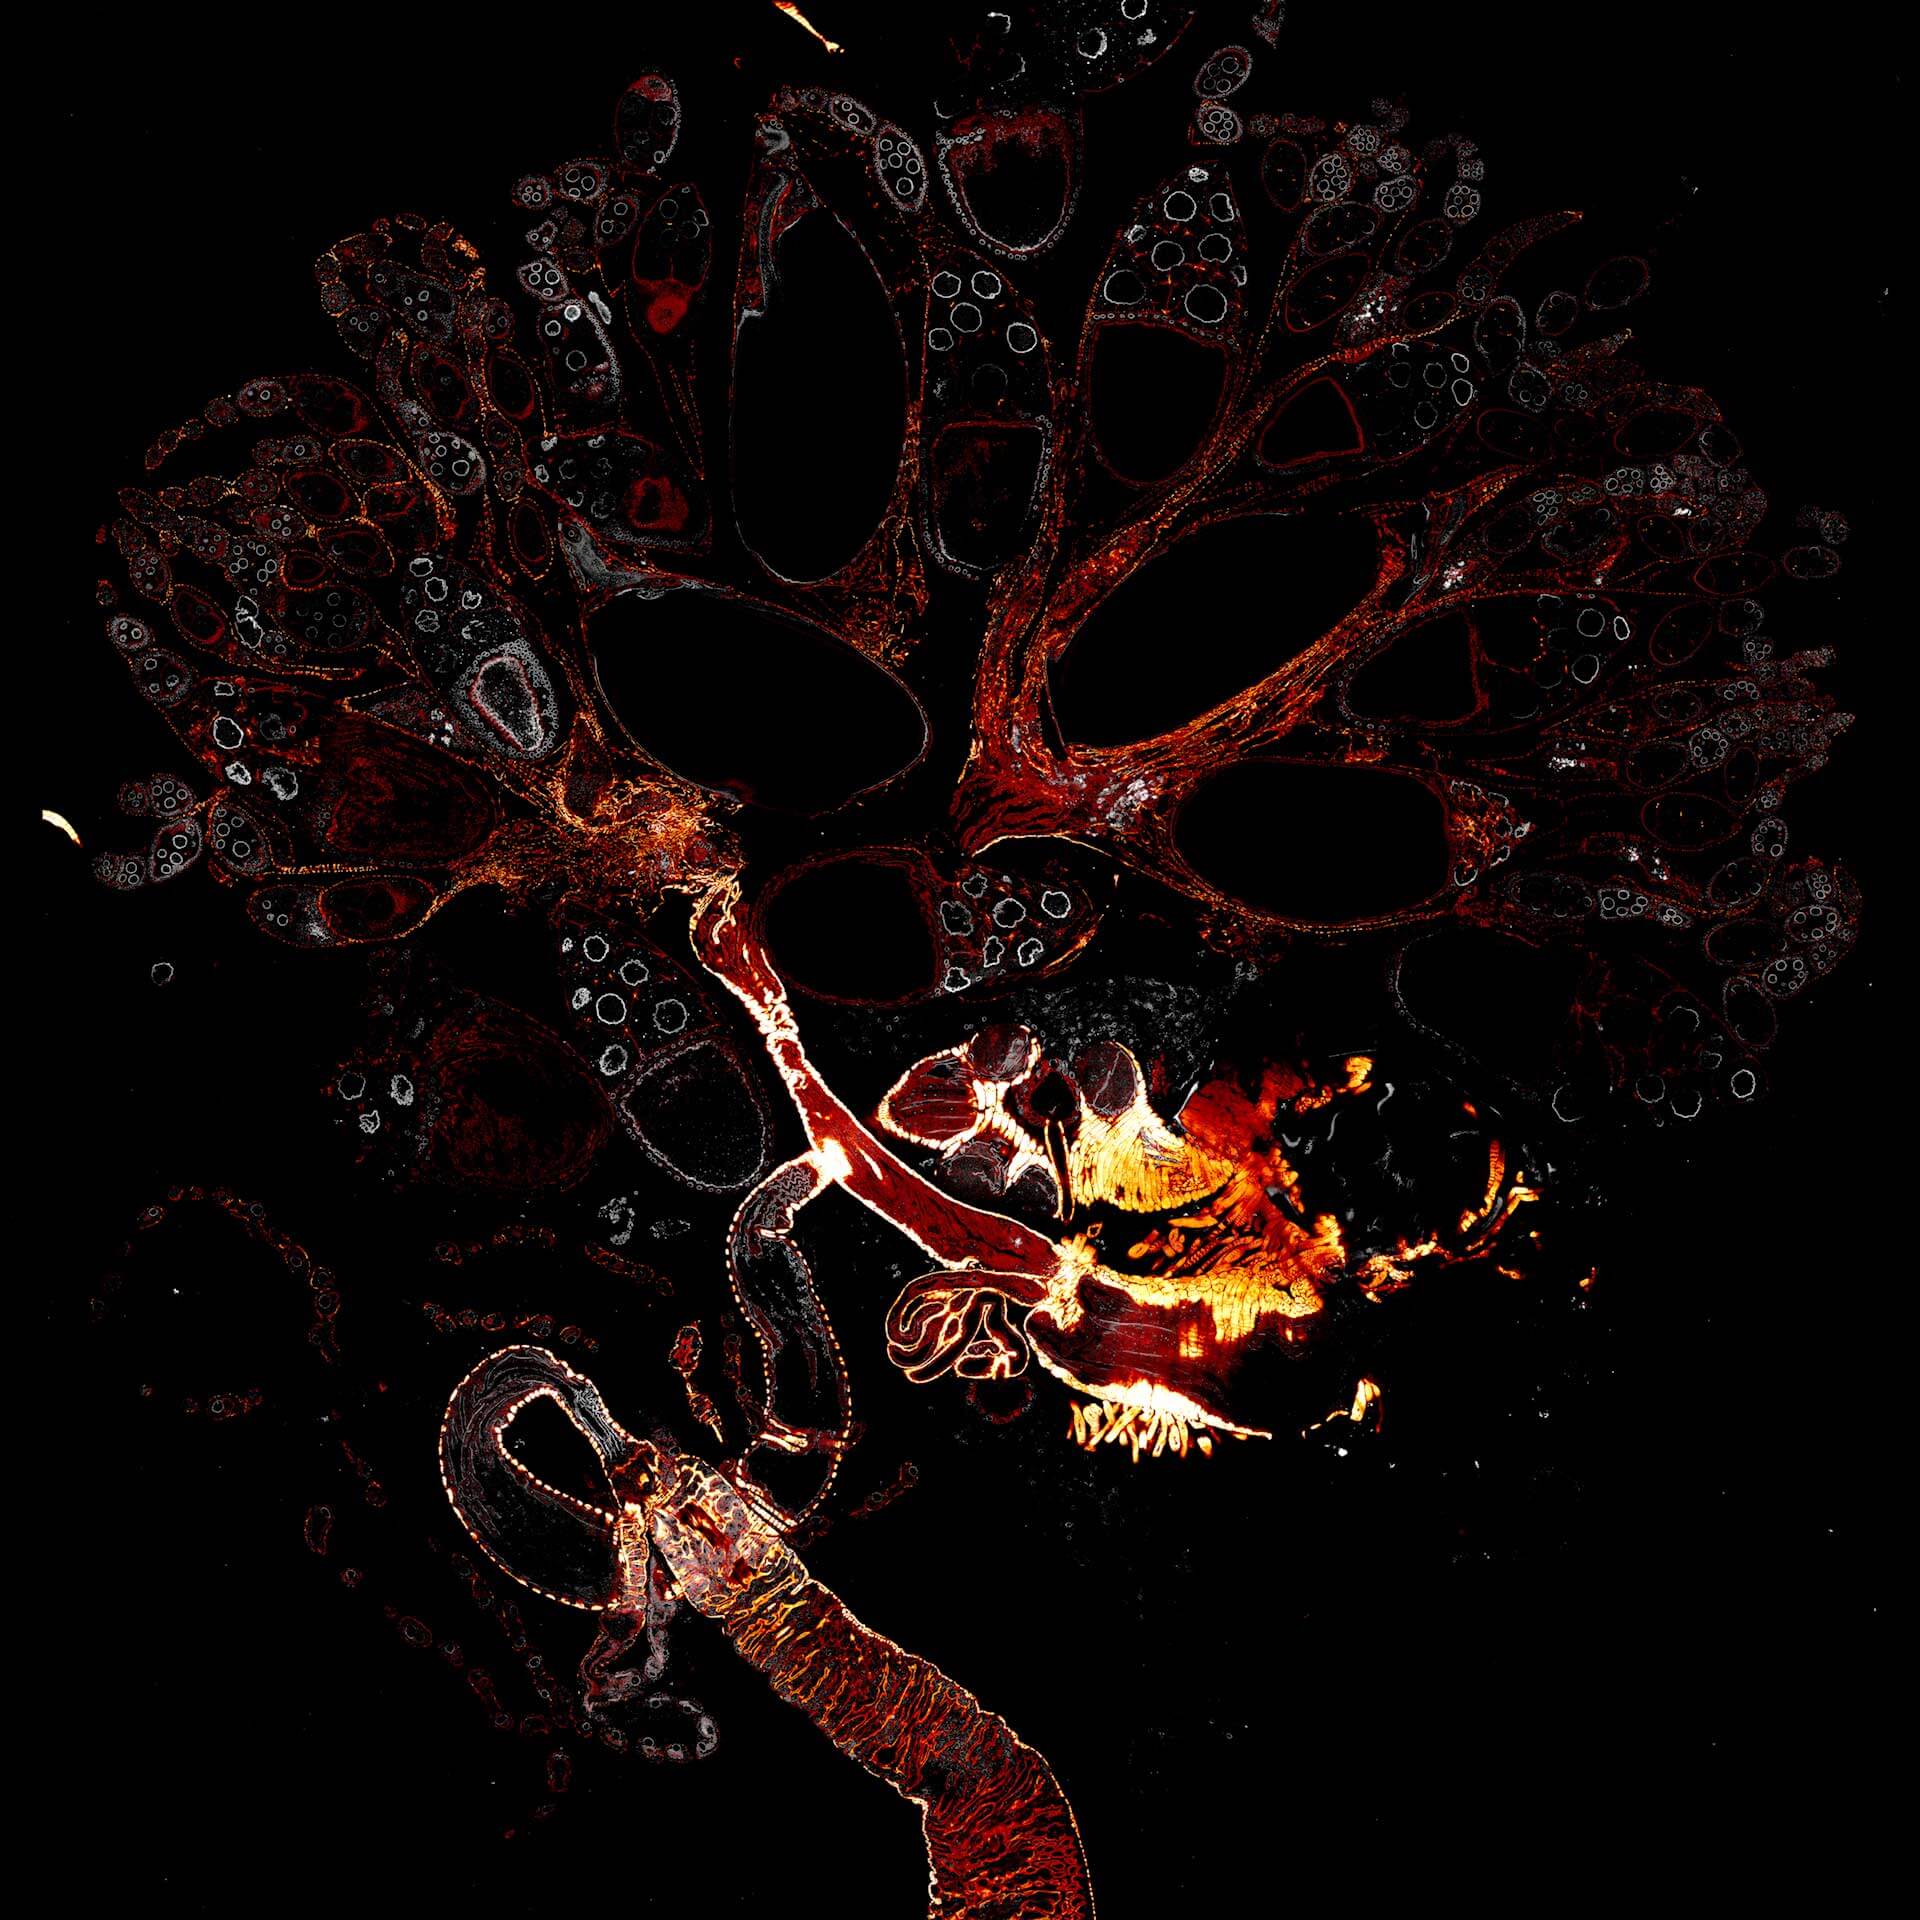
Drosophila ovariole stained with abberior LIVE 560 DNA showing nuclei in different cell types of the egg chamber. Ovaries were dissected from adult female fruit flies and were fixed prior to staining.
Image was acquired with the STEDYCON tiling feature and assembled with the SVI Huygens Stitcher.

Description
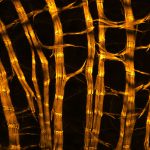
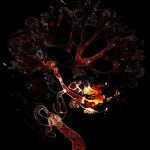
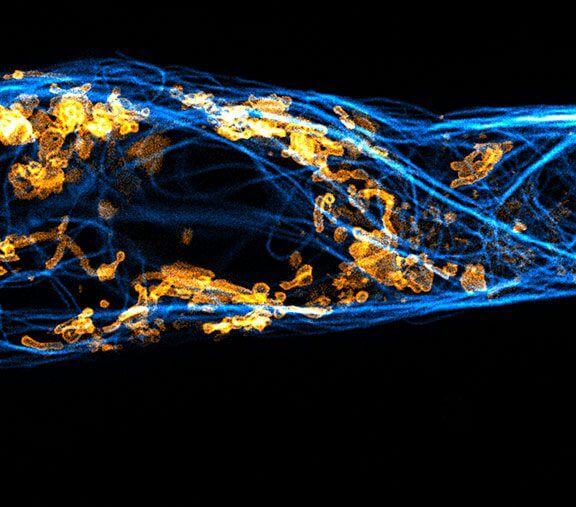
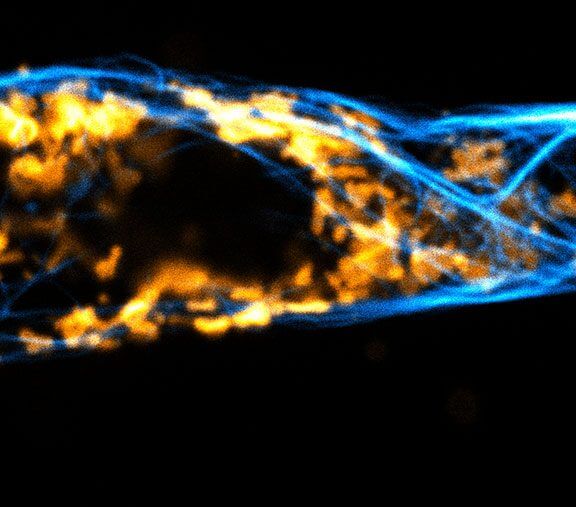
Drosophila spermatid tails were stained with abberior LIVE 610 tubulin. Testis were dissected from adult male fruit flies. Live cell imaging experiment was performed on a INFINITY microscope.
Description
Composite of three color live-cell image of an adherent mammalian cell. This living cell was directly labelled with abberior LIVE 510 actin (blue/green), LIVE 560 DNA (gray) and LIVE 610 tubulin. This image was acquired with a STEDYCON microscope.

Description
Three color live-cell STED at 775 nm: living cell labelled with abberior LIVE 460L (ER, green), LIVE 560 tubulin (magenta) and LIVE 610 actin (red).
Description
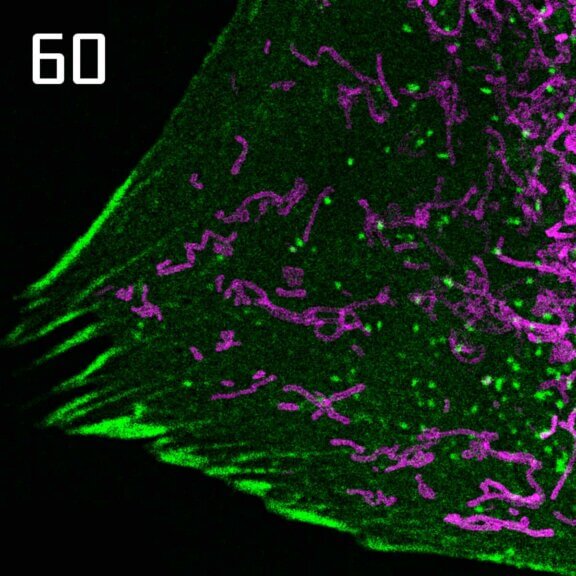
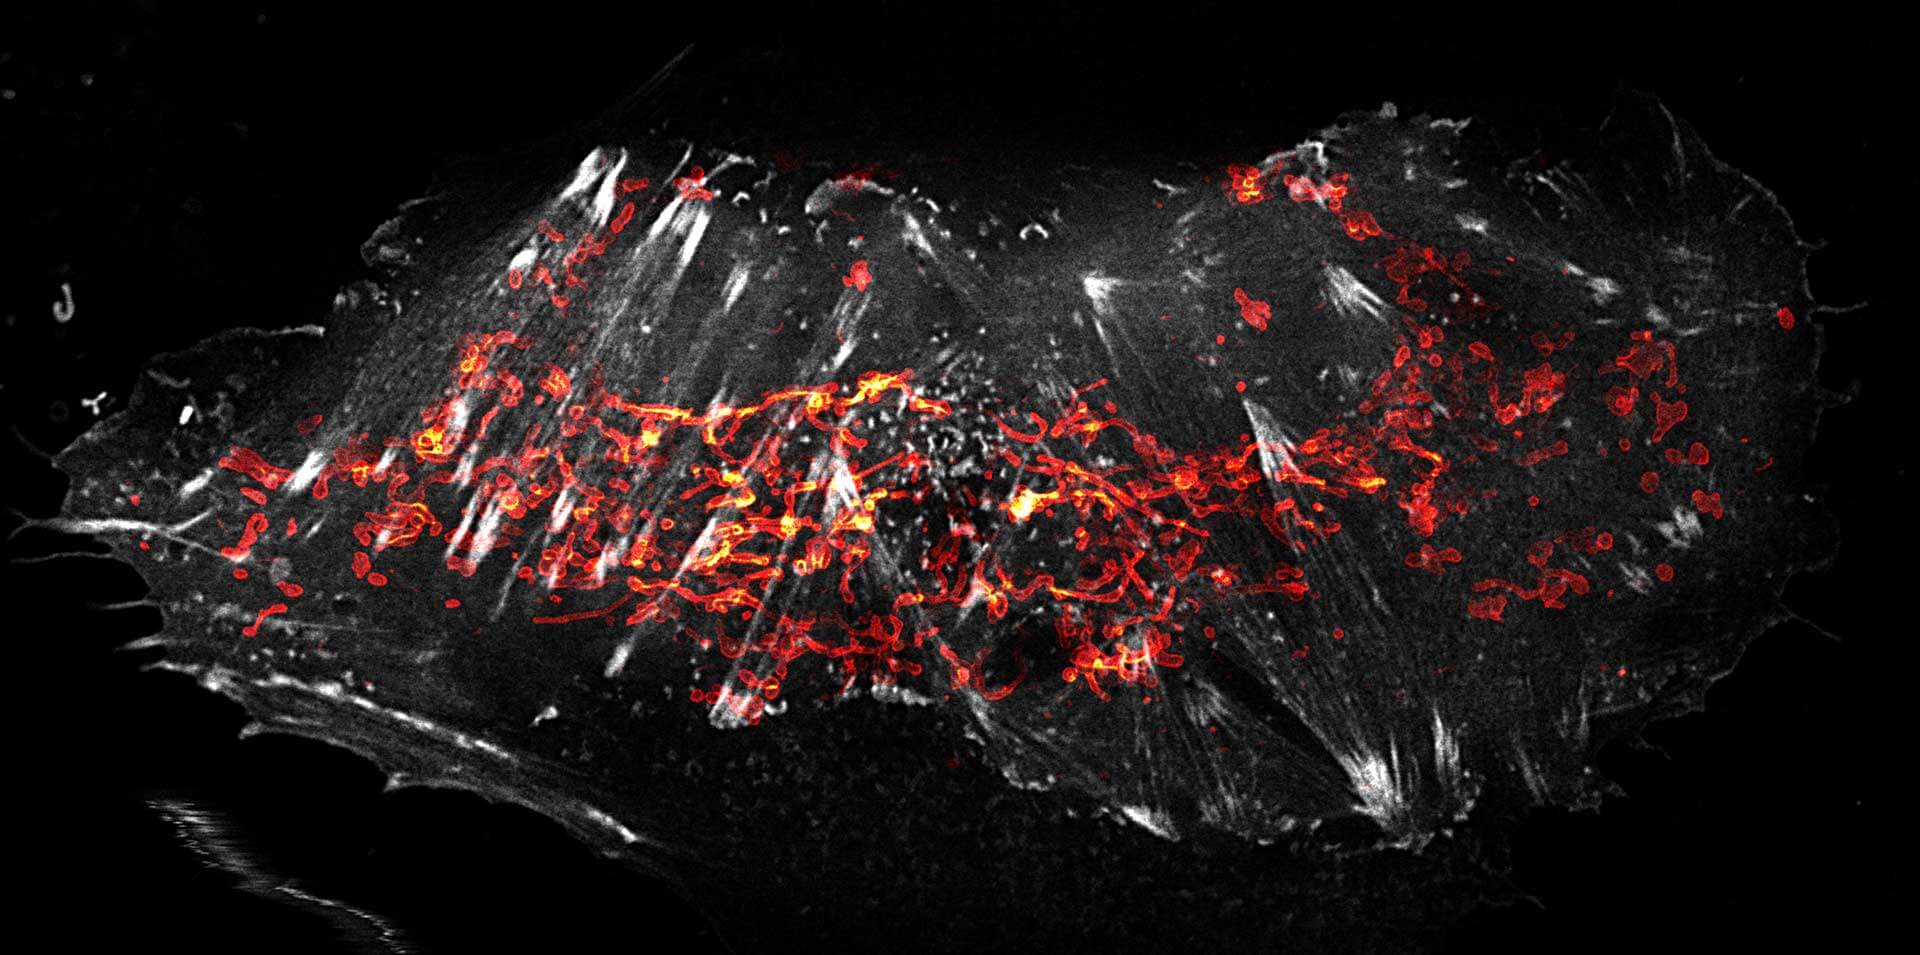
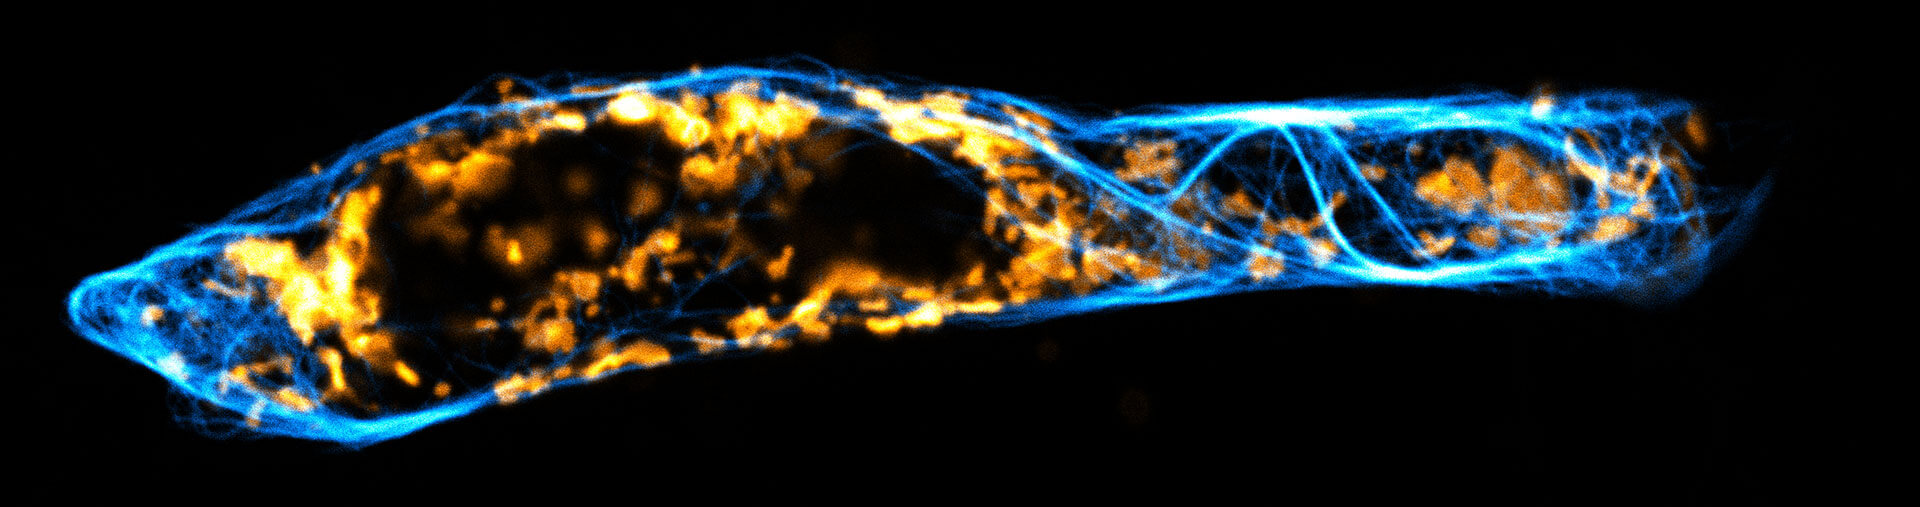
Two color live-cell confocal and STED image of a mammalian cell expressing a SNAP-tag® OMP25 fusion protein decoration the outer membrane of mitochondria. OMP25 is visualized by our new abberior LIVE 610 SNAP ligand (orange). Tubulin filaments are highlighted with abberior LIVE 550 tubulin (cyan).
The SNAP-OMP25 plasmid was a gift from Francesca Bottanelli, FU Berlin.
Description
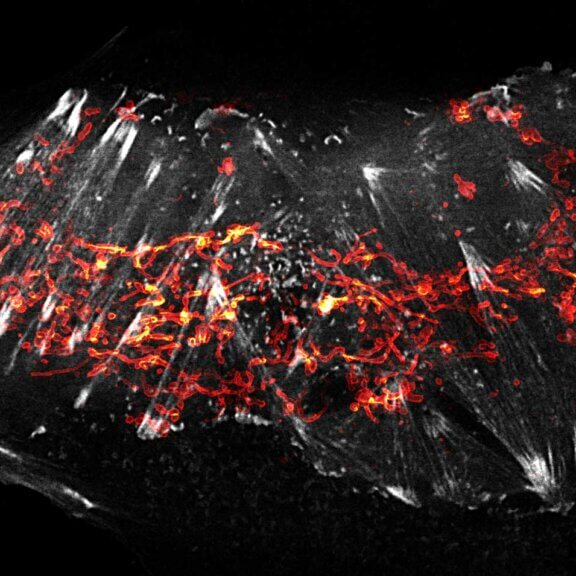
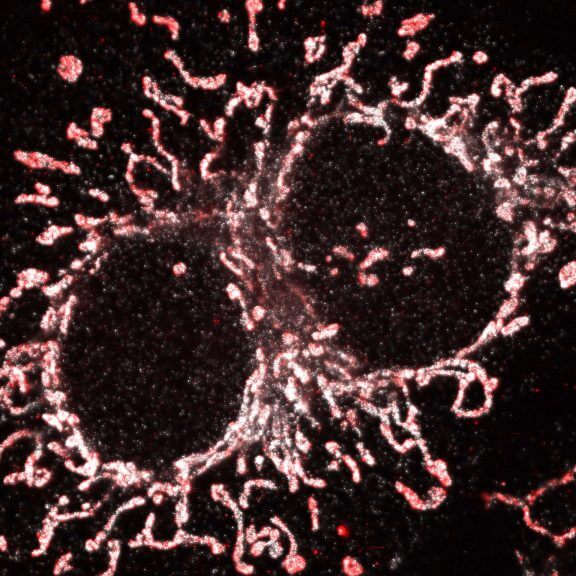
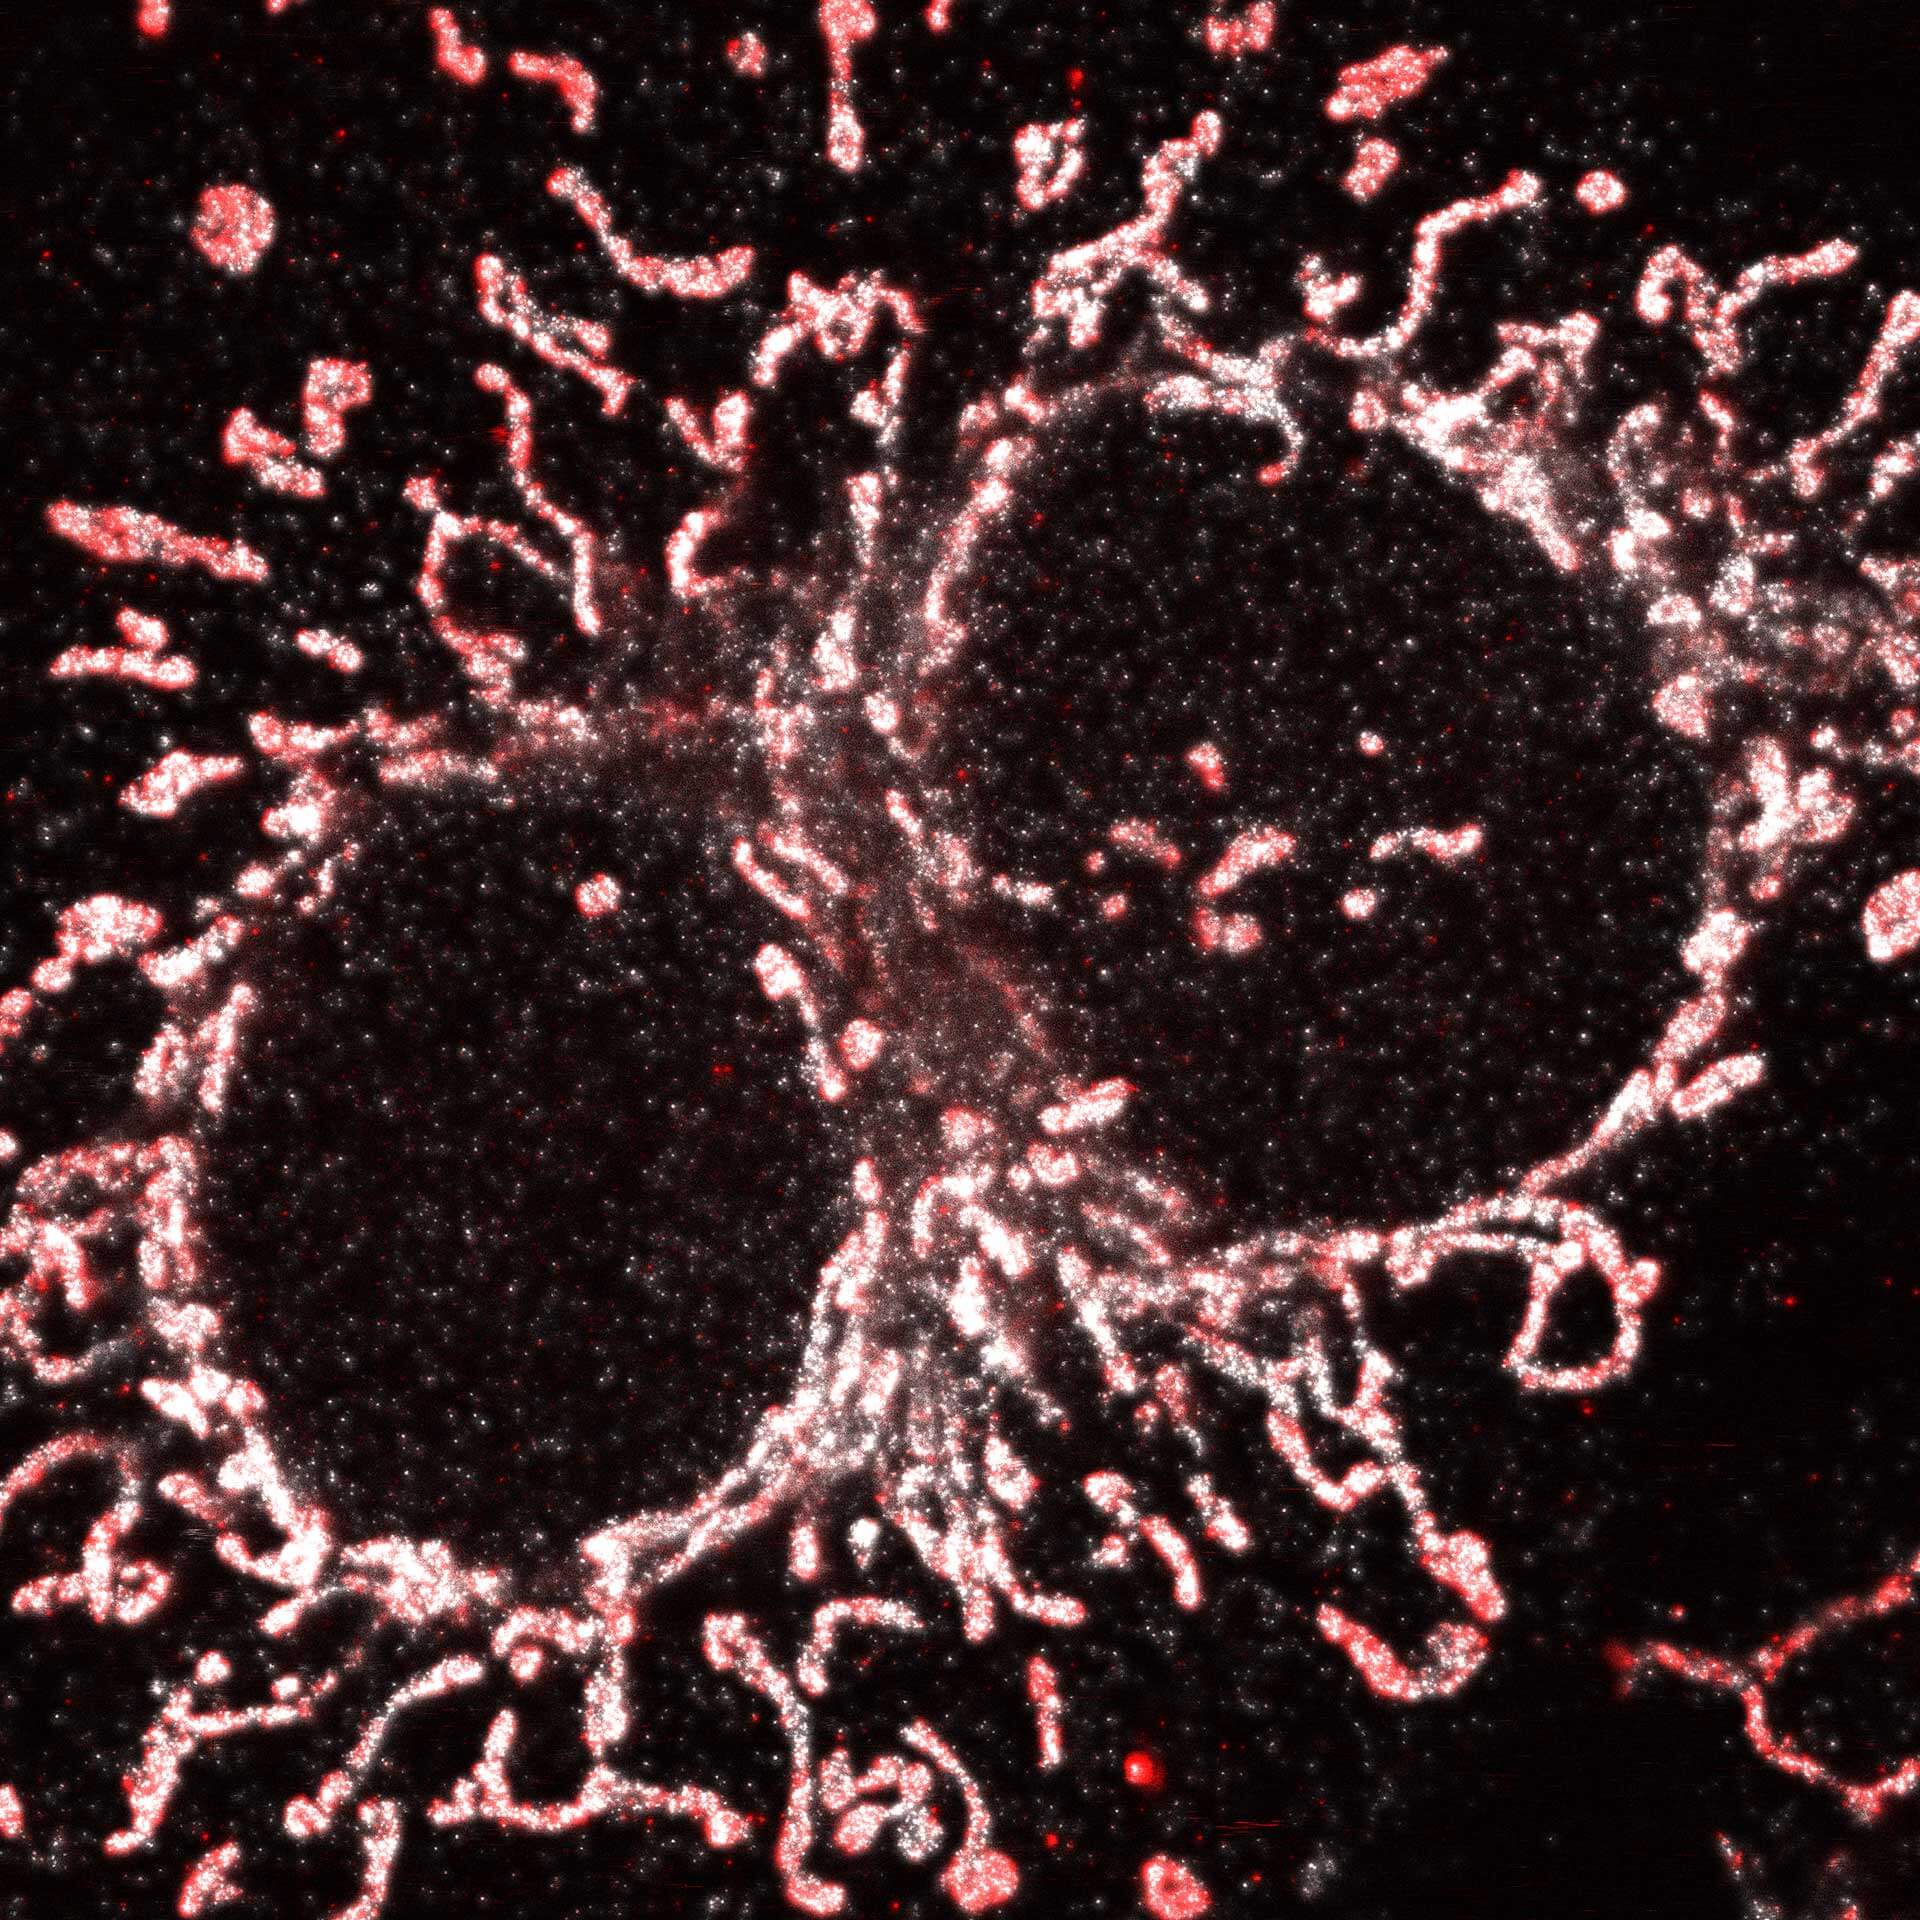
Cultured mammalian cell immunostained for an inner and outer mitochondrial membrane marker. Outer membrane is highlighted with abberior STAR RED (red) and the inner membrane with abberior STAR ORANGE (gray).
STED and confocal images were acquired with abberior's FACILITY microscope.

Description
Drosophila male accessory gland stained for F-actin using abberior STAR 580 phalloidin.
Sample was prepared in cooperation with Dr. H. R. Shcherbata at MPl for Biophysical Chemistry, Göttingen, Germany.

Description
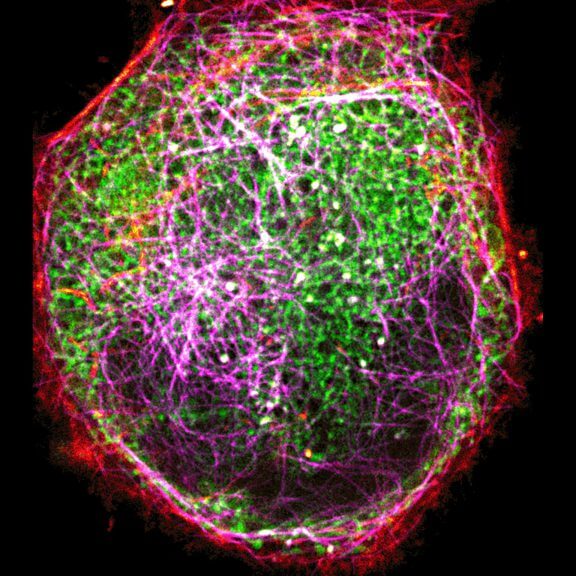
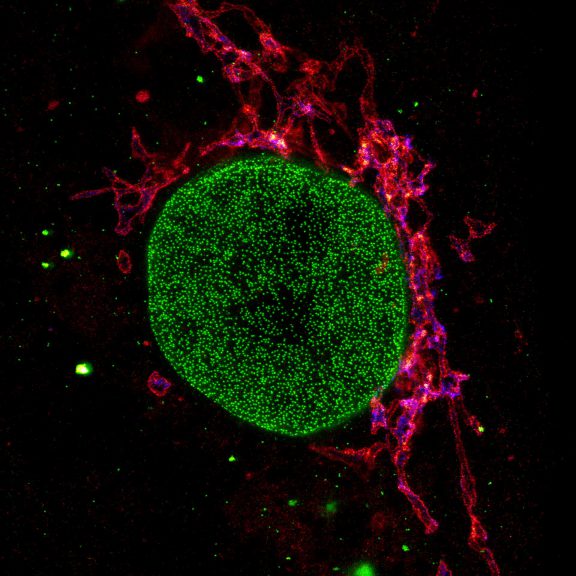
Three color STED and confocal image of a mammalian cultured cell immunostained for a nuclear pore protein in green and two golgi apparatus markers in red and blue.
abberior STAR RED highlights the golgi apparatus protein giantin (red) and abberior STAR ORANGE visualizes the cis-golgi protein GM130 (blue). NUP98 proteins were stained with abberior STAR GREEN (green).
Description
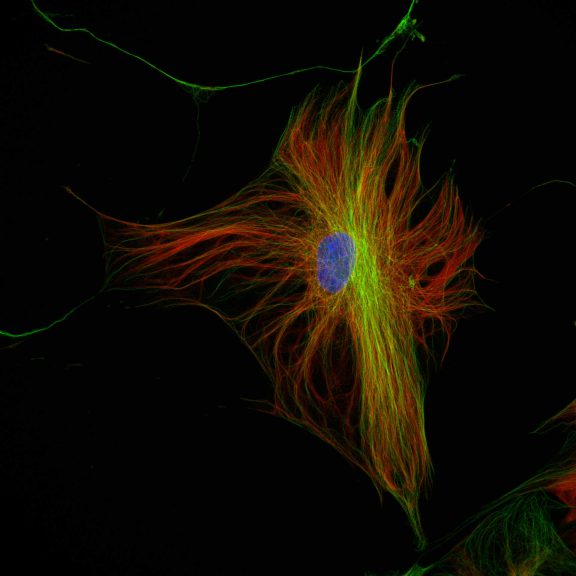
Three color confocal image of human fibroblast immunostained with abberior STAR 580 for vimentin (green) and with abberior STAR RED for tubulin (red).
DAPI was added to highlight the nucleus (blue).

Description
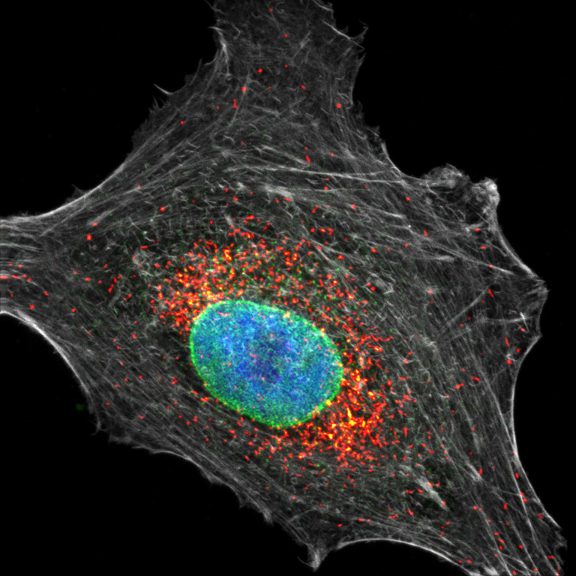
Four color confocal image of mammalian cultured cells. Peroxisomes were immunostained with abberior STAR RED (magenta) and nuclear pore proteins with abberior STAR 580 (green). F-actin fibers were highlighted with abberior STAR 488 phalloidin (gray).
The nucleus was visualized with DAPI (blue).
Description
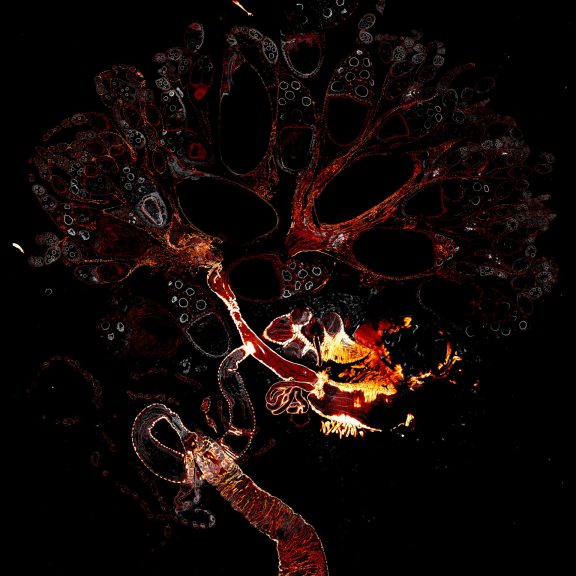
Drosophila female reproductive system stained for F-actin (red) with abberior STAR RED phalloidin. abberior STAR ORANGE is highlighting a nuclear pore protein (gray).
Image was acquired with the STEDYCON tiling feature and assembled with the SVI Huygens Stitcher.
Description
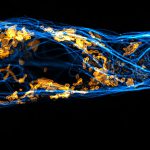
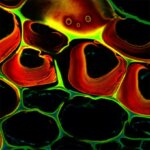
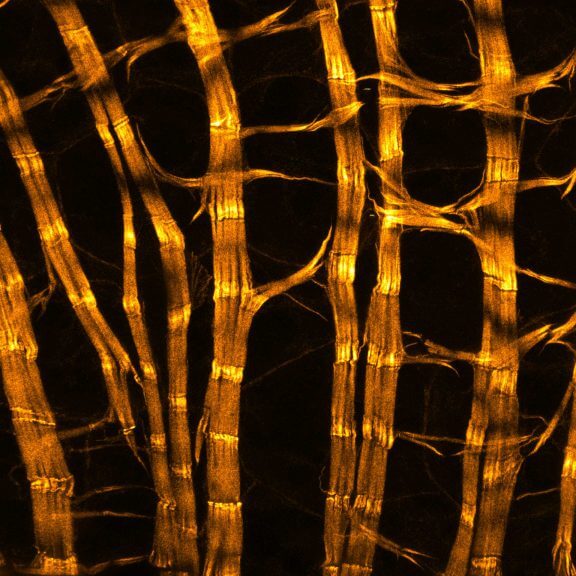
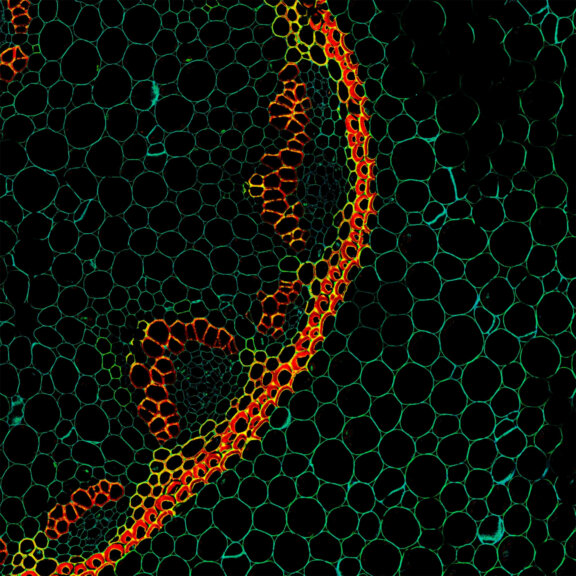
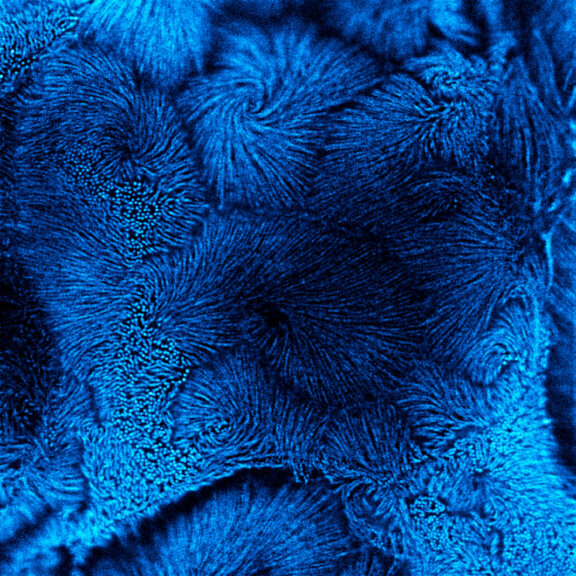
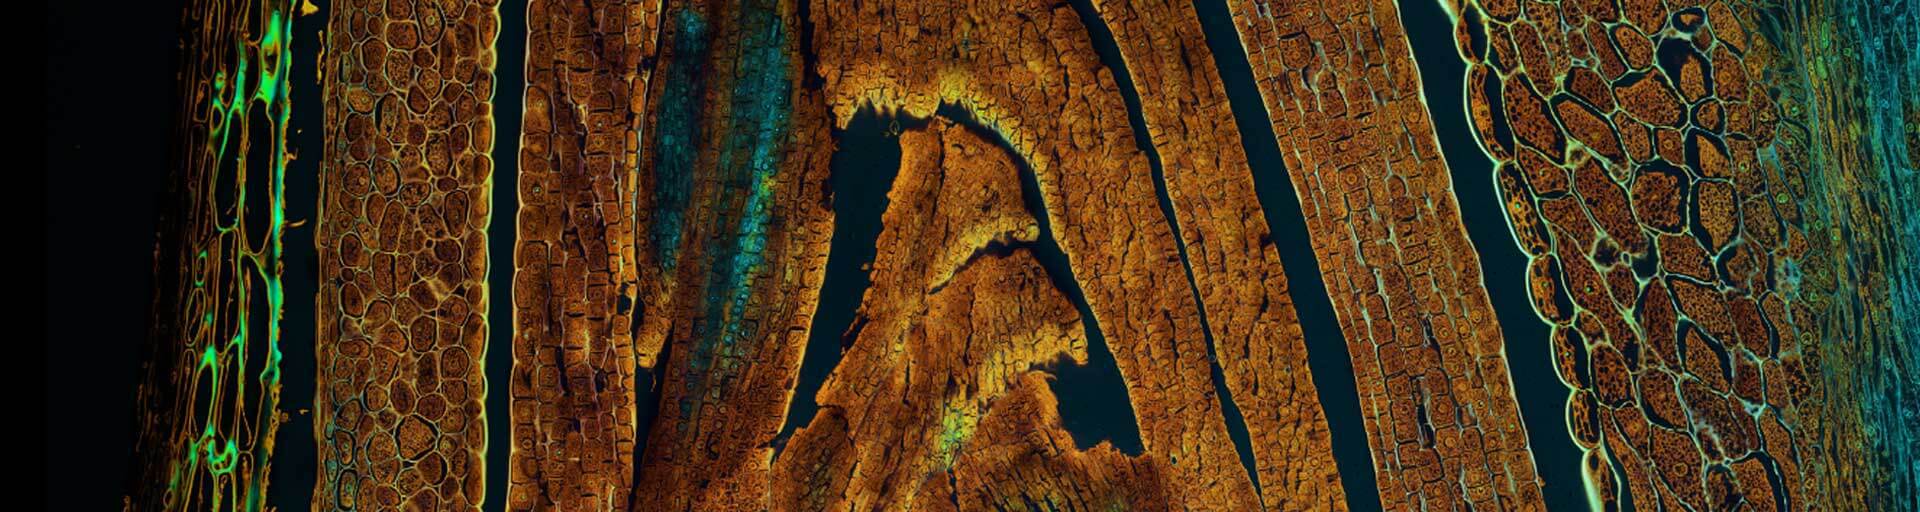
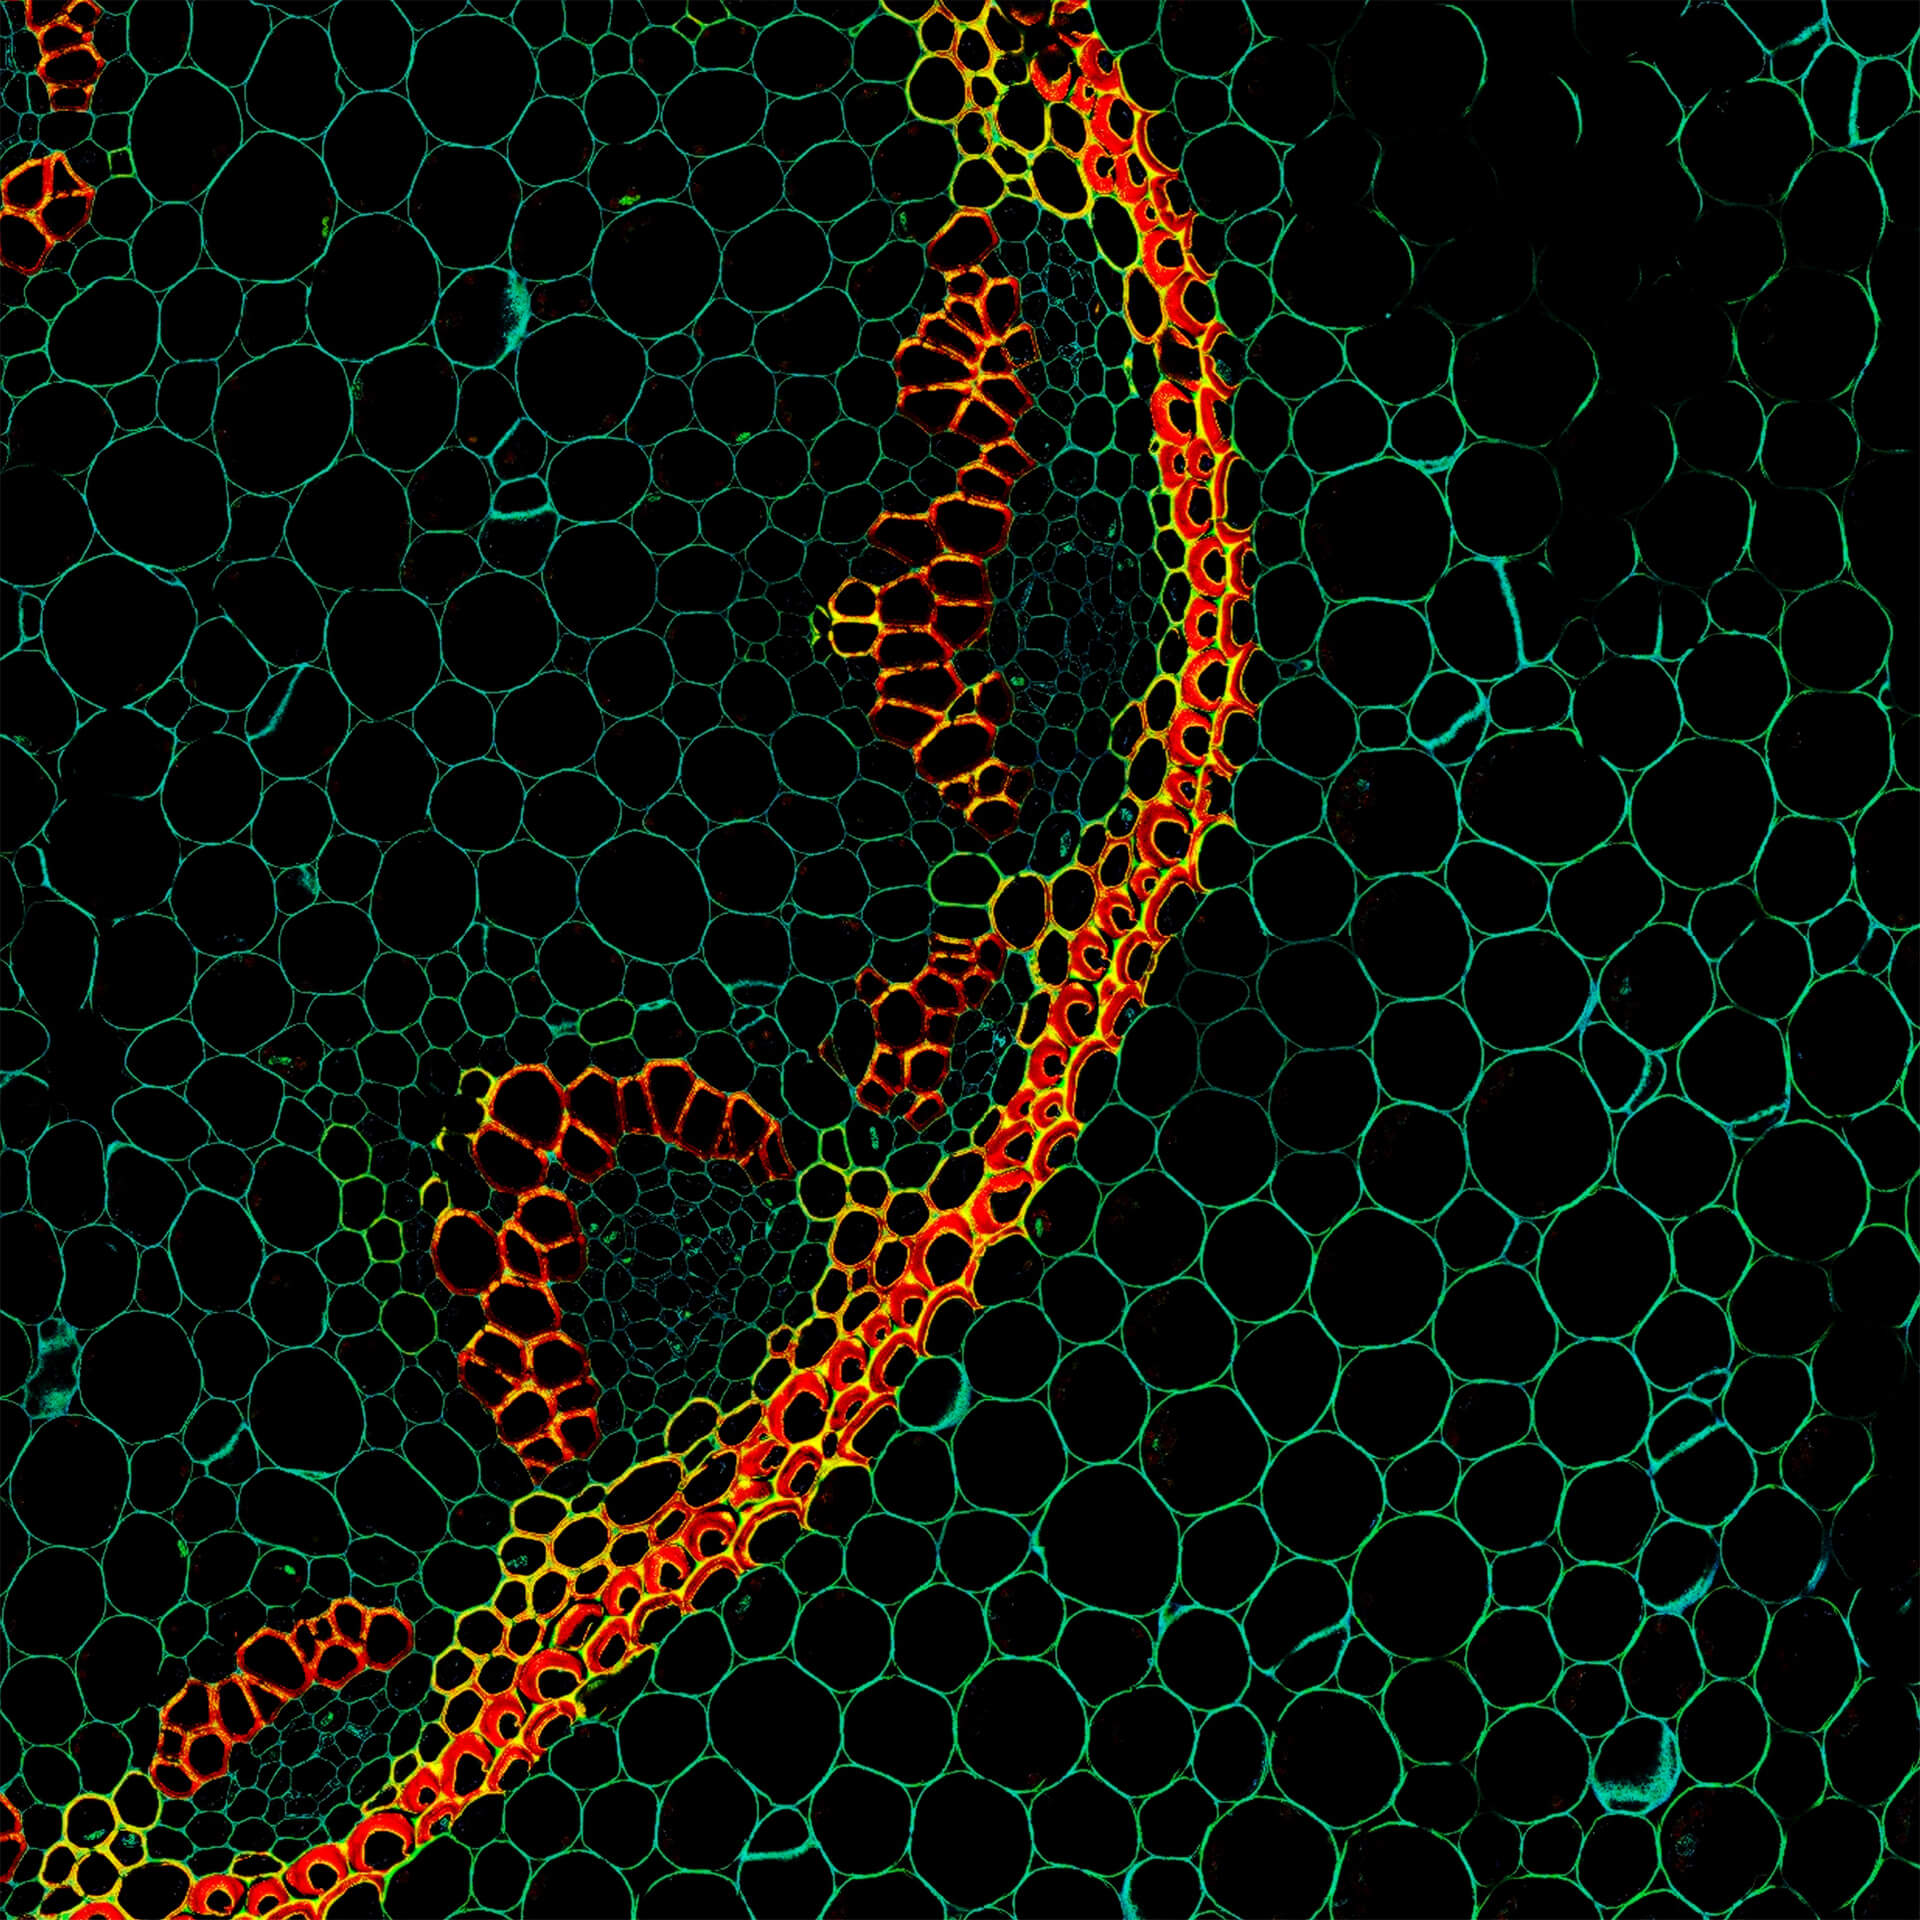
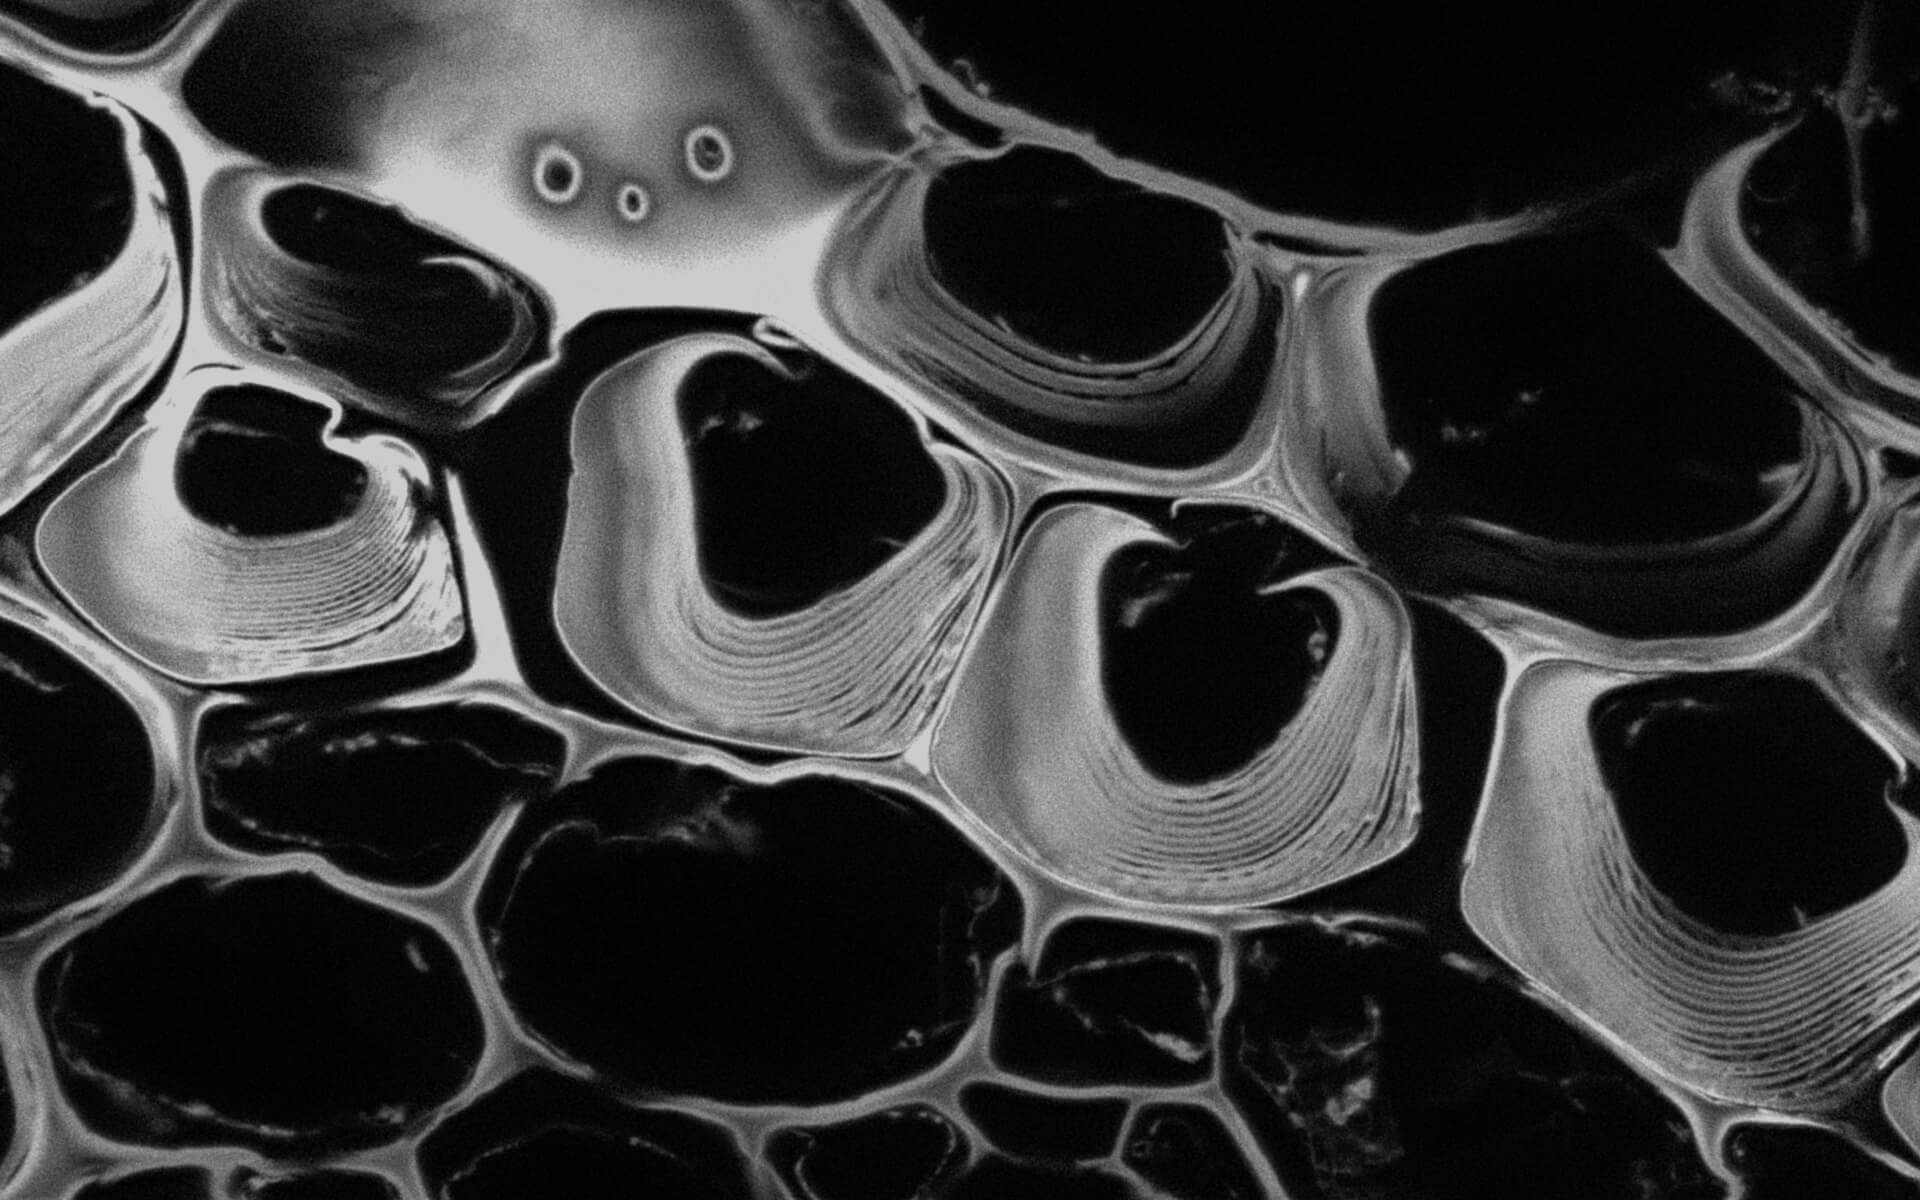
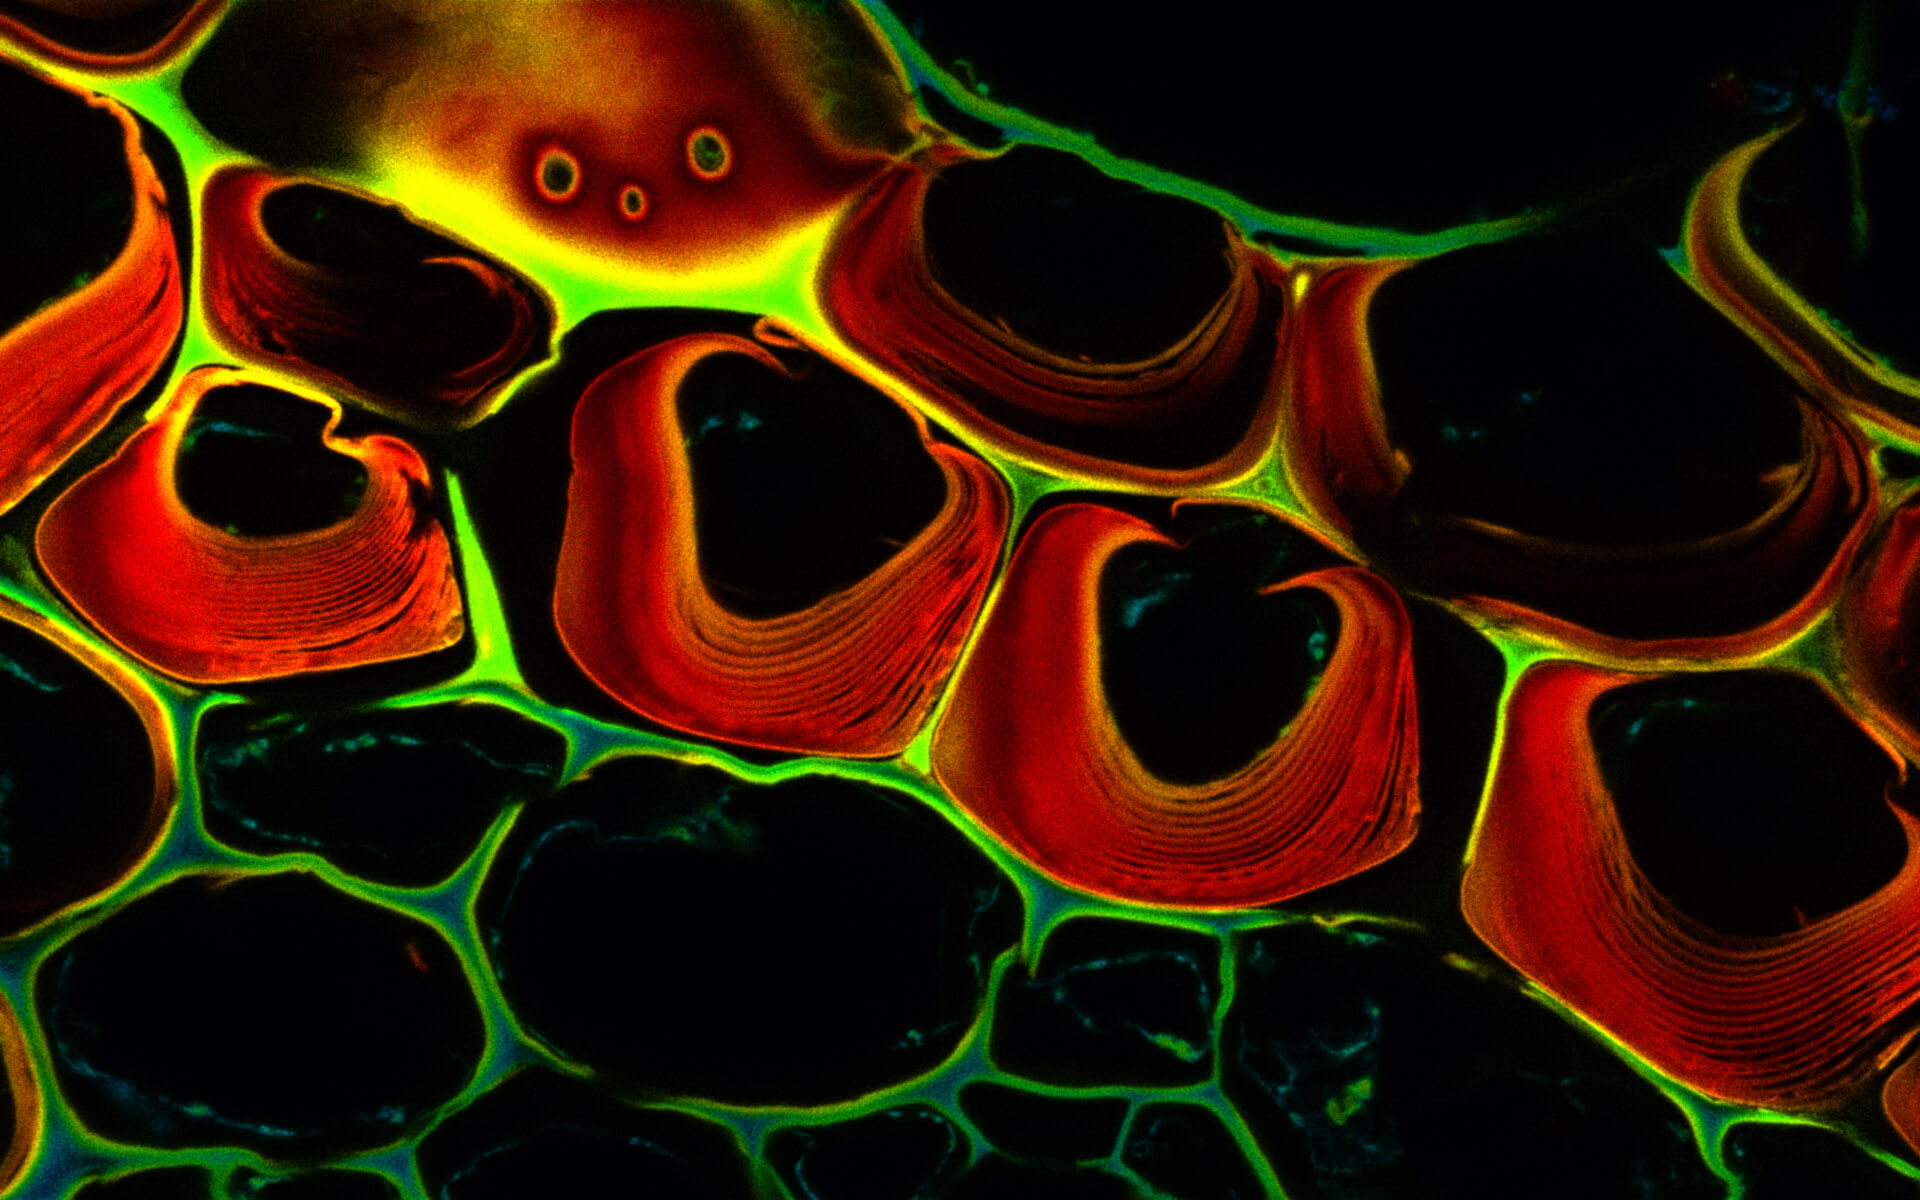
Autofluorescence in a plant stem cross section of Convallaria recorded with FACILITY. A large area, 10 by 10 tiles, each 125 µm by 125 µm, was imaged and stitched with image tiling in Fiji for ImageJ. This is combined with TIMEBOW lifetime imaging to show the differences in fluorescence lifetime due to the type of autofluorescent molecule and their nano-environment.
Modules:
Description
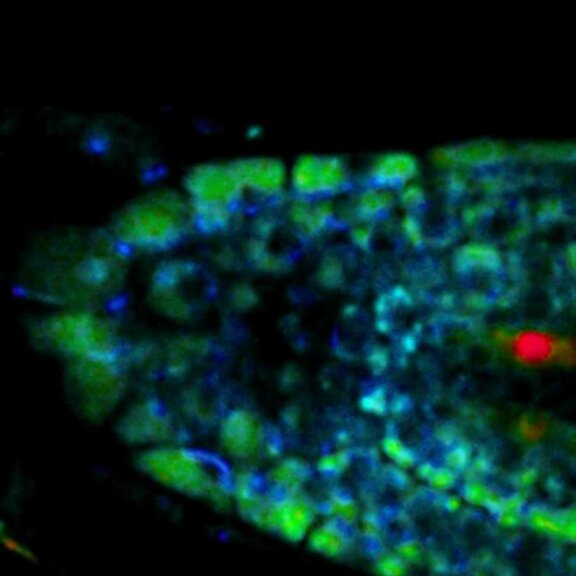
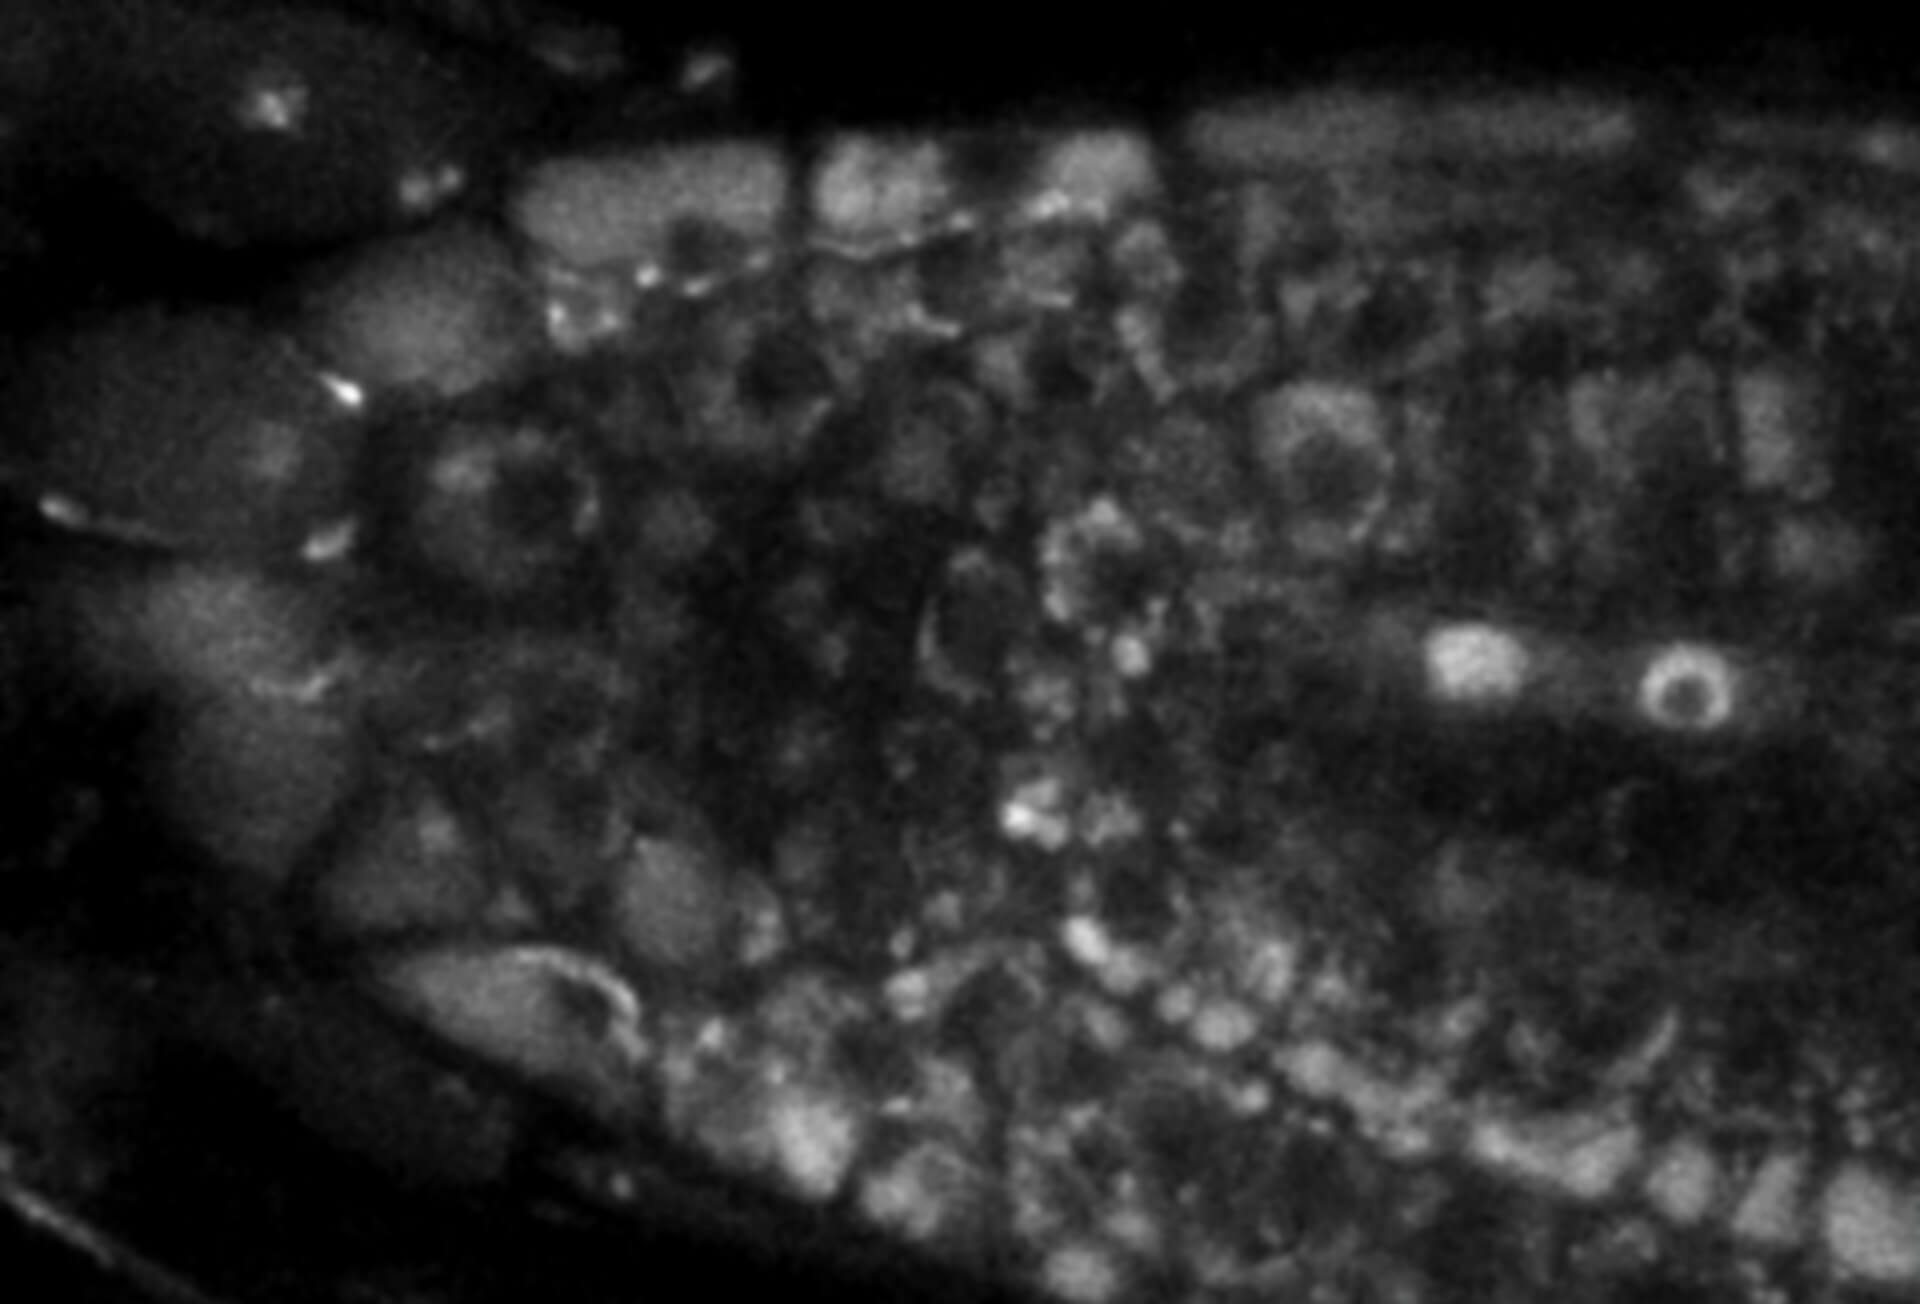
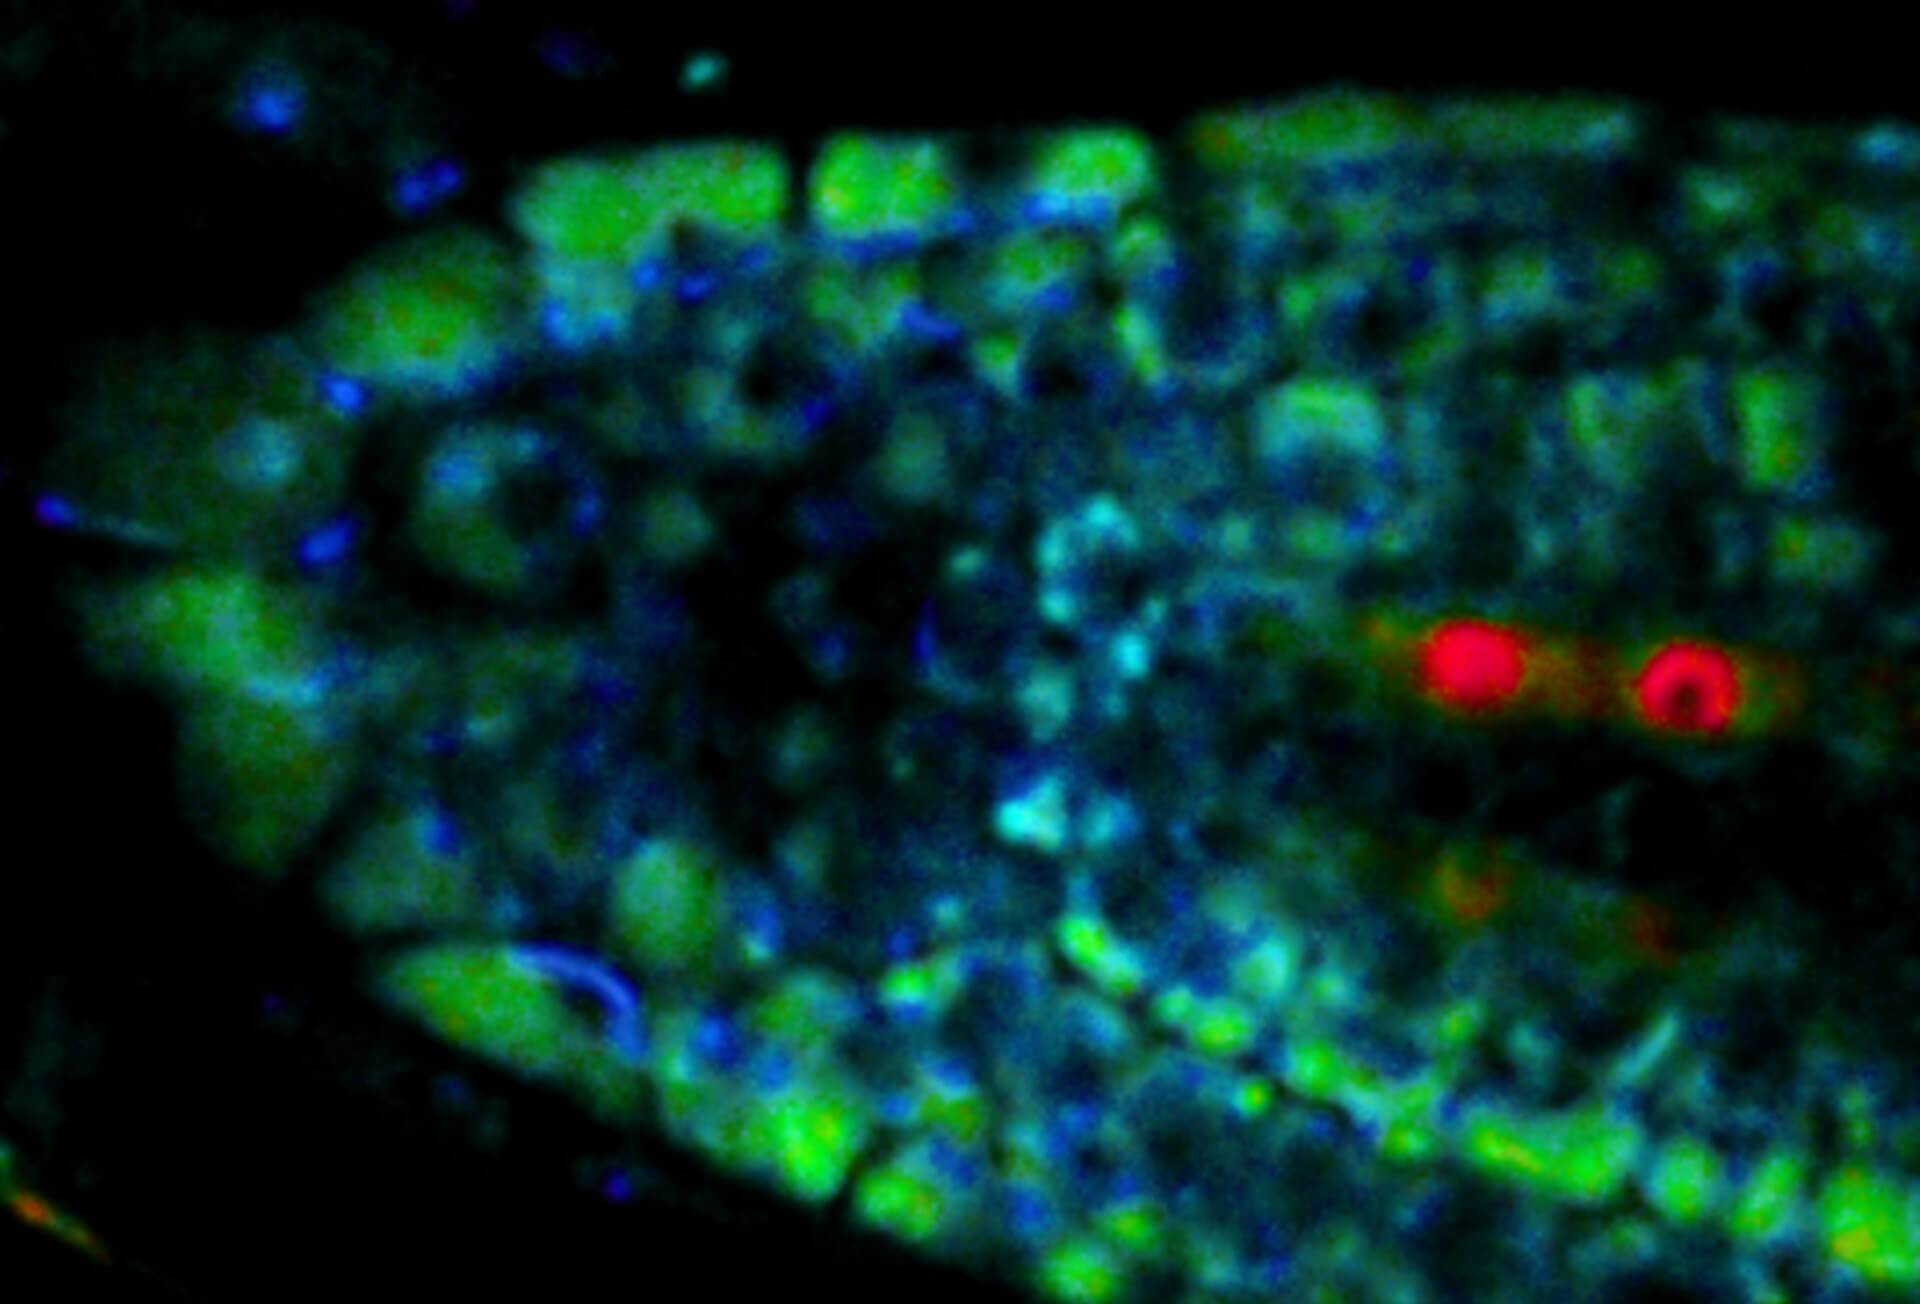
Live-cell sample of an Arabidopsis root tip suspended in water recorded with FACILITY. A subset of cells expresses a YFP construct. Lifetime imaging with TIMEBOW shows shifts in YFP fluorescence lifetime caused by the proteins nano-environment.
We thank Dr. Fábián Attila and Soós Vilmos (ATK, Brunszvik, HU) for providing this sample. Contact: soos.vilmos@atk.hu.
Modules:
Description
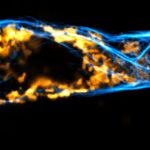
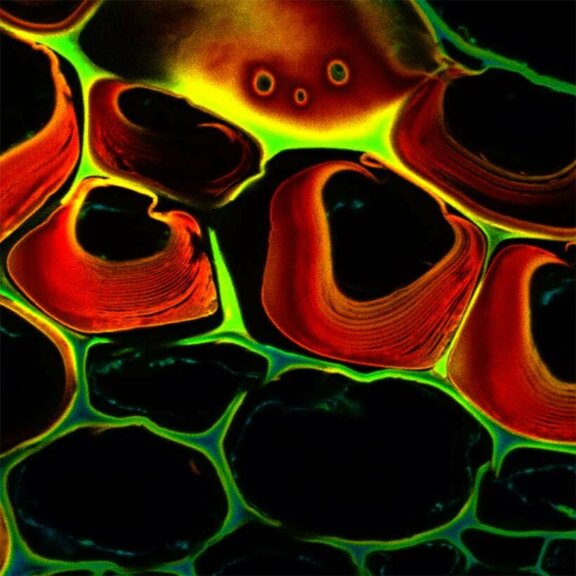
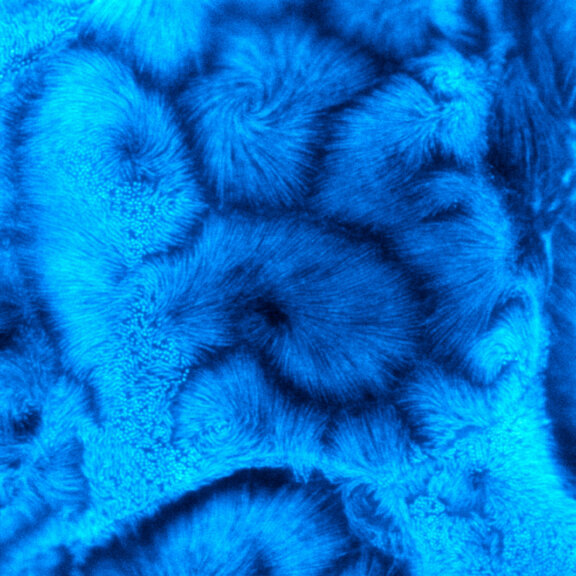
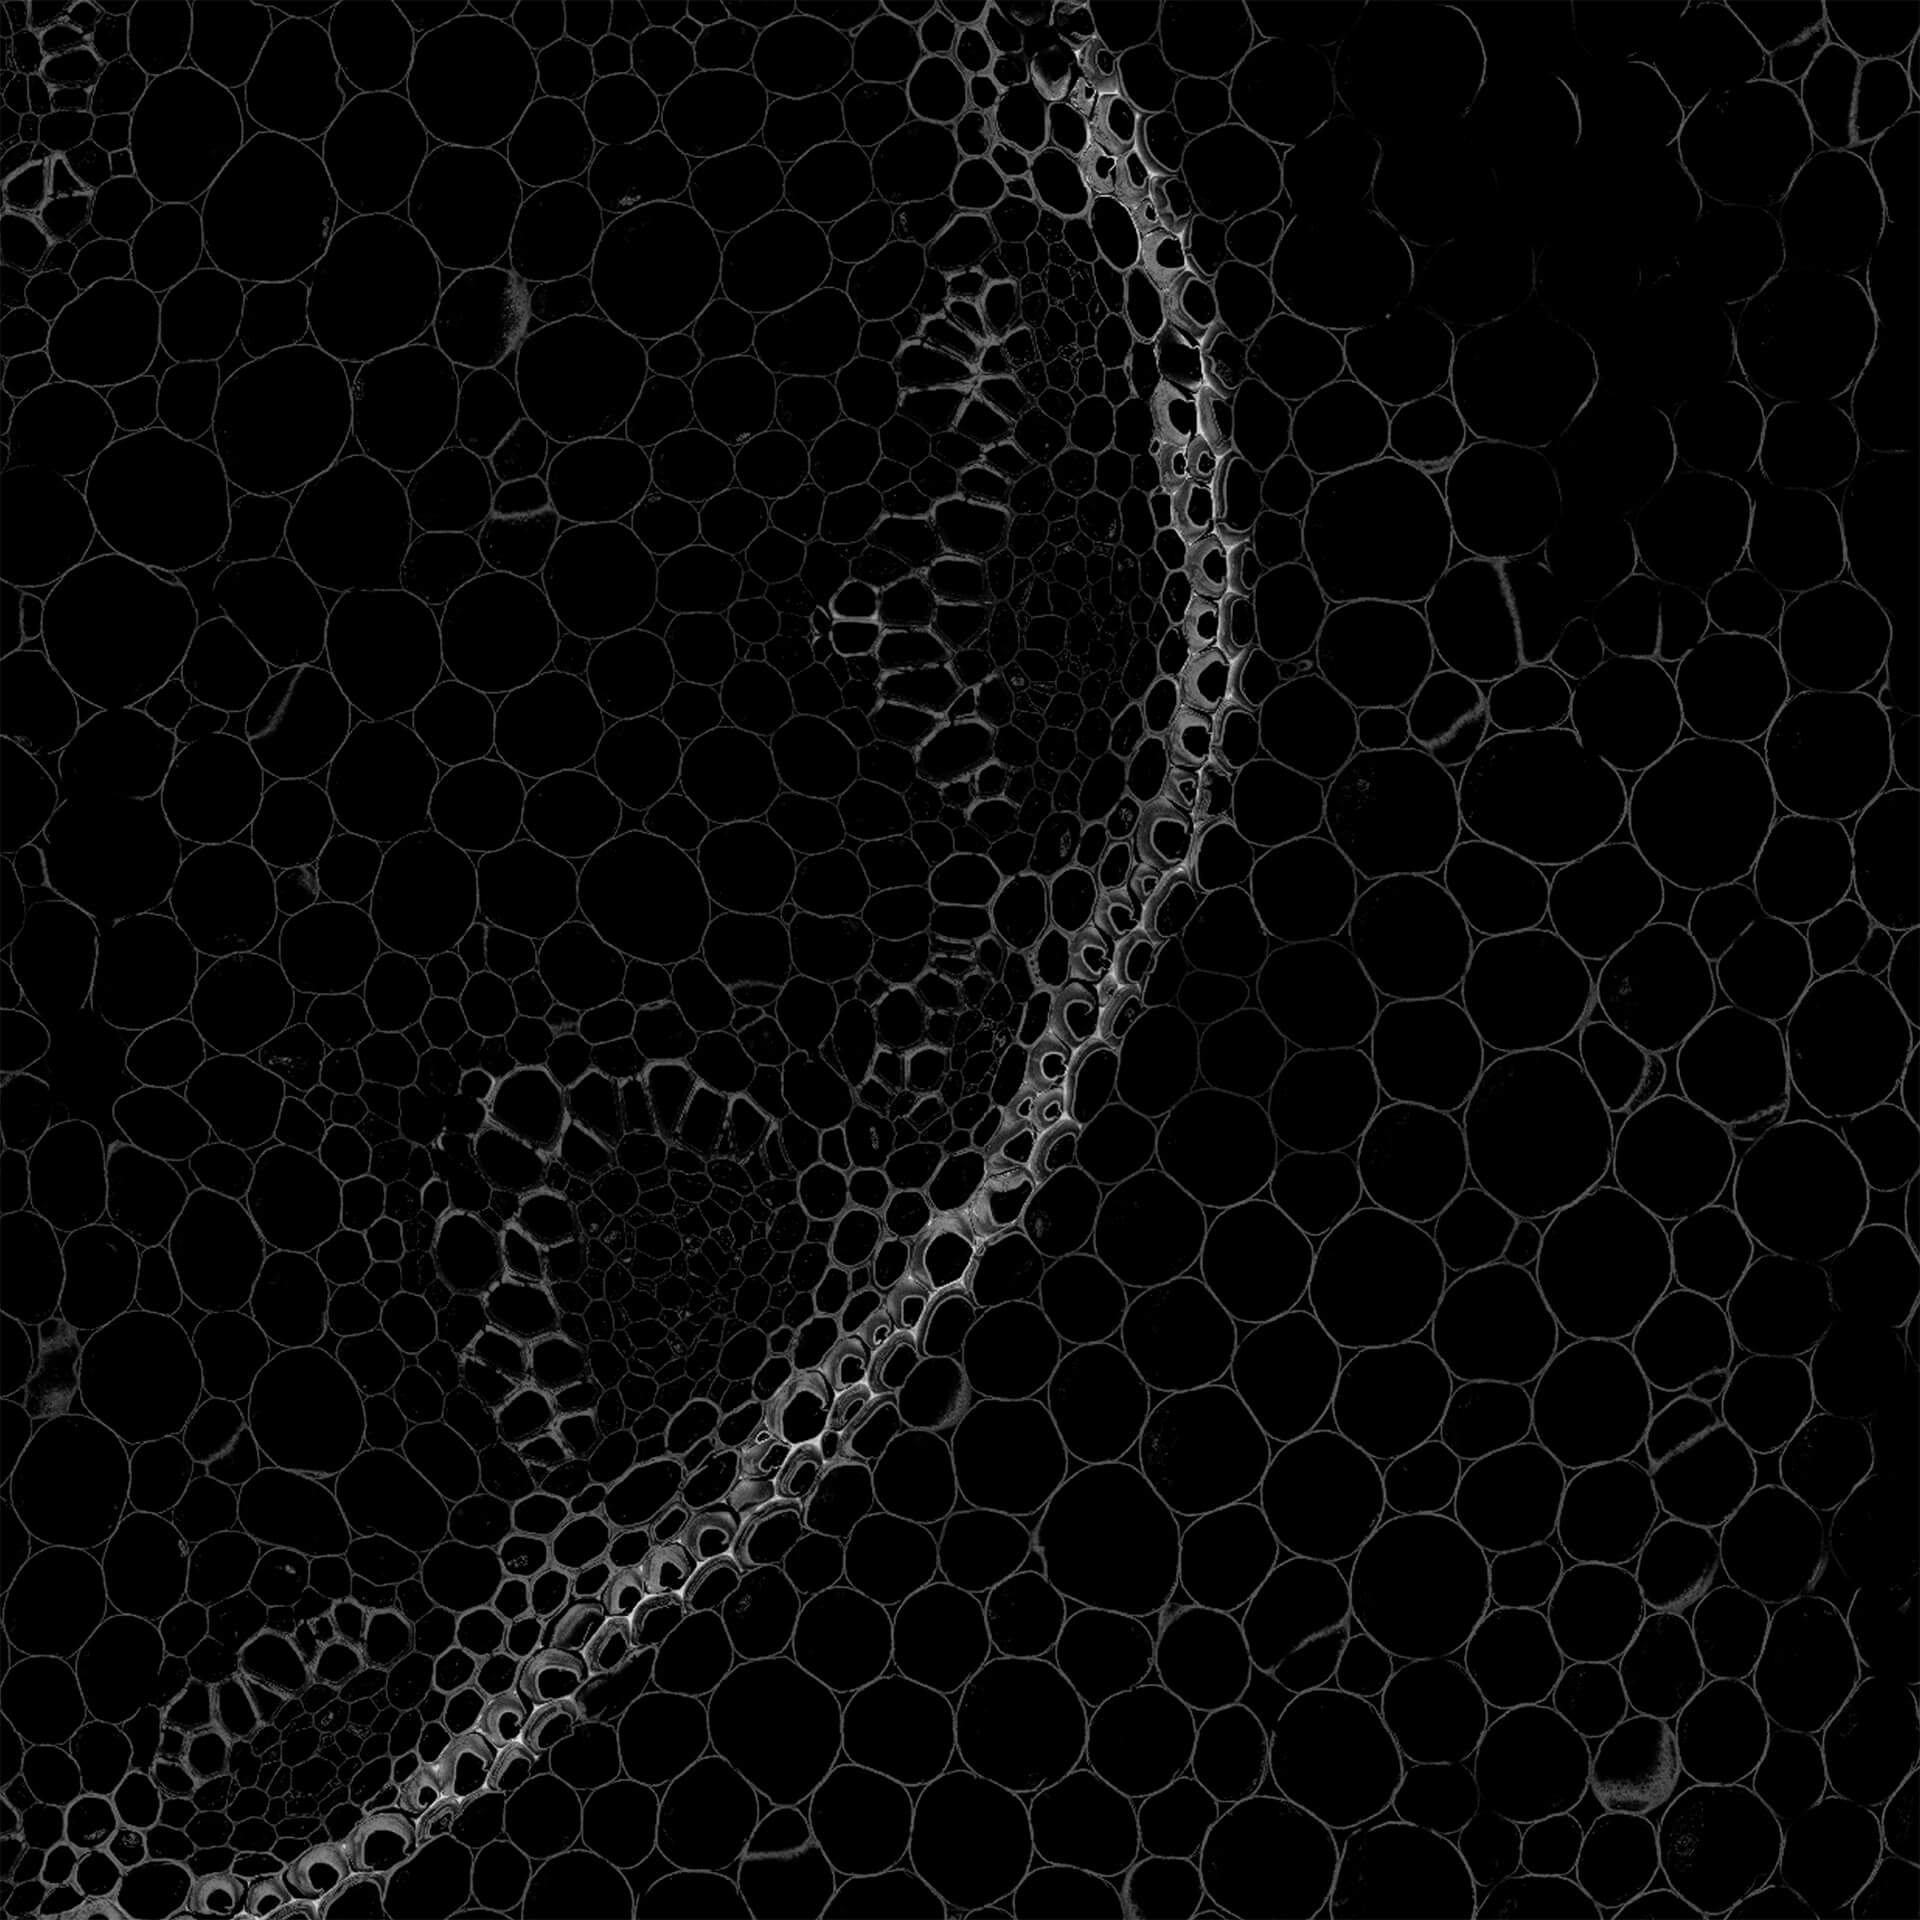
Autofluorescence in a plant stem cross section of Convallaria recorded with FACILITY. Image quality is improved by removing the background through MATRIX detection. This is combined with TIMEBOW lifetime imaging to show the differences in fluorescence lifetime due to the type of autofluorescent molecule and their nano-environment.
Modules:
Description
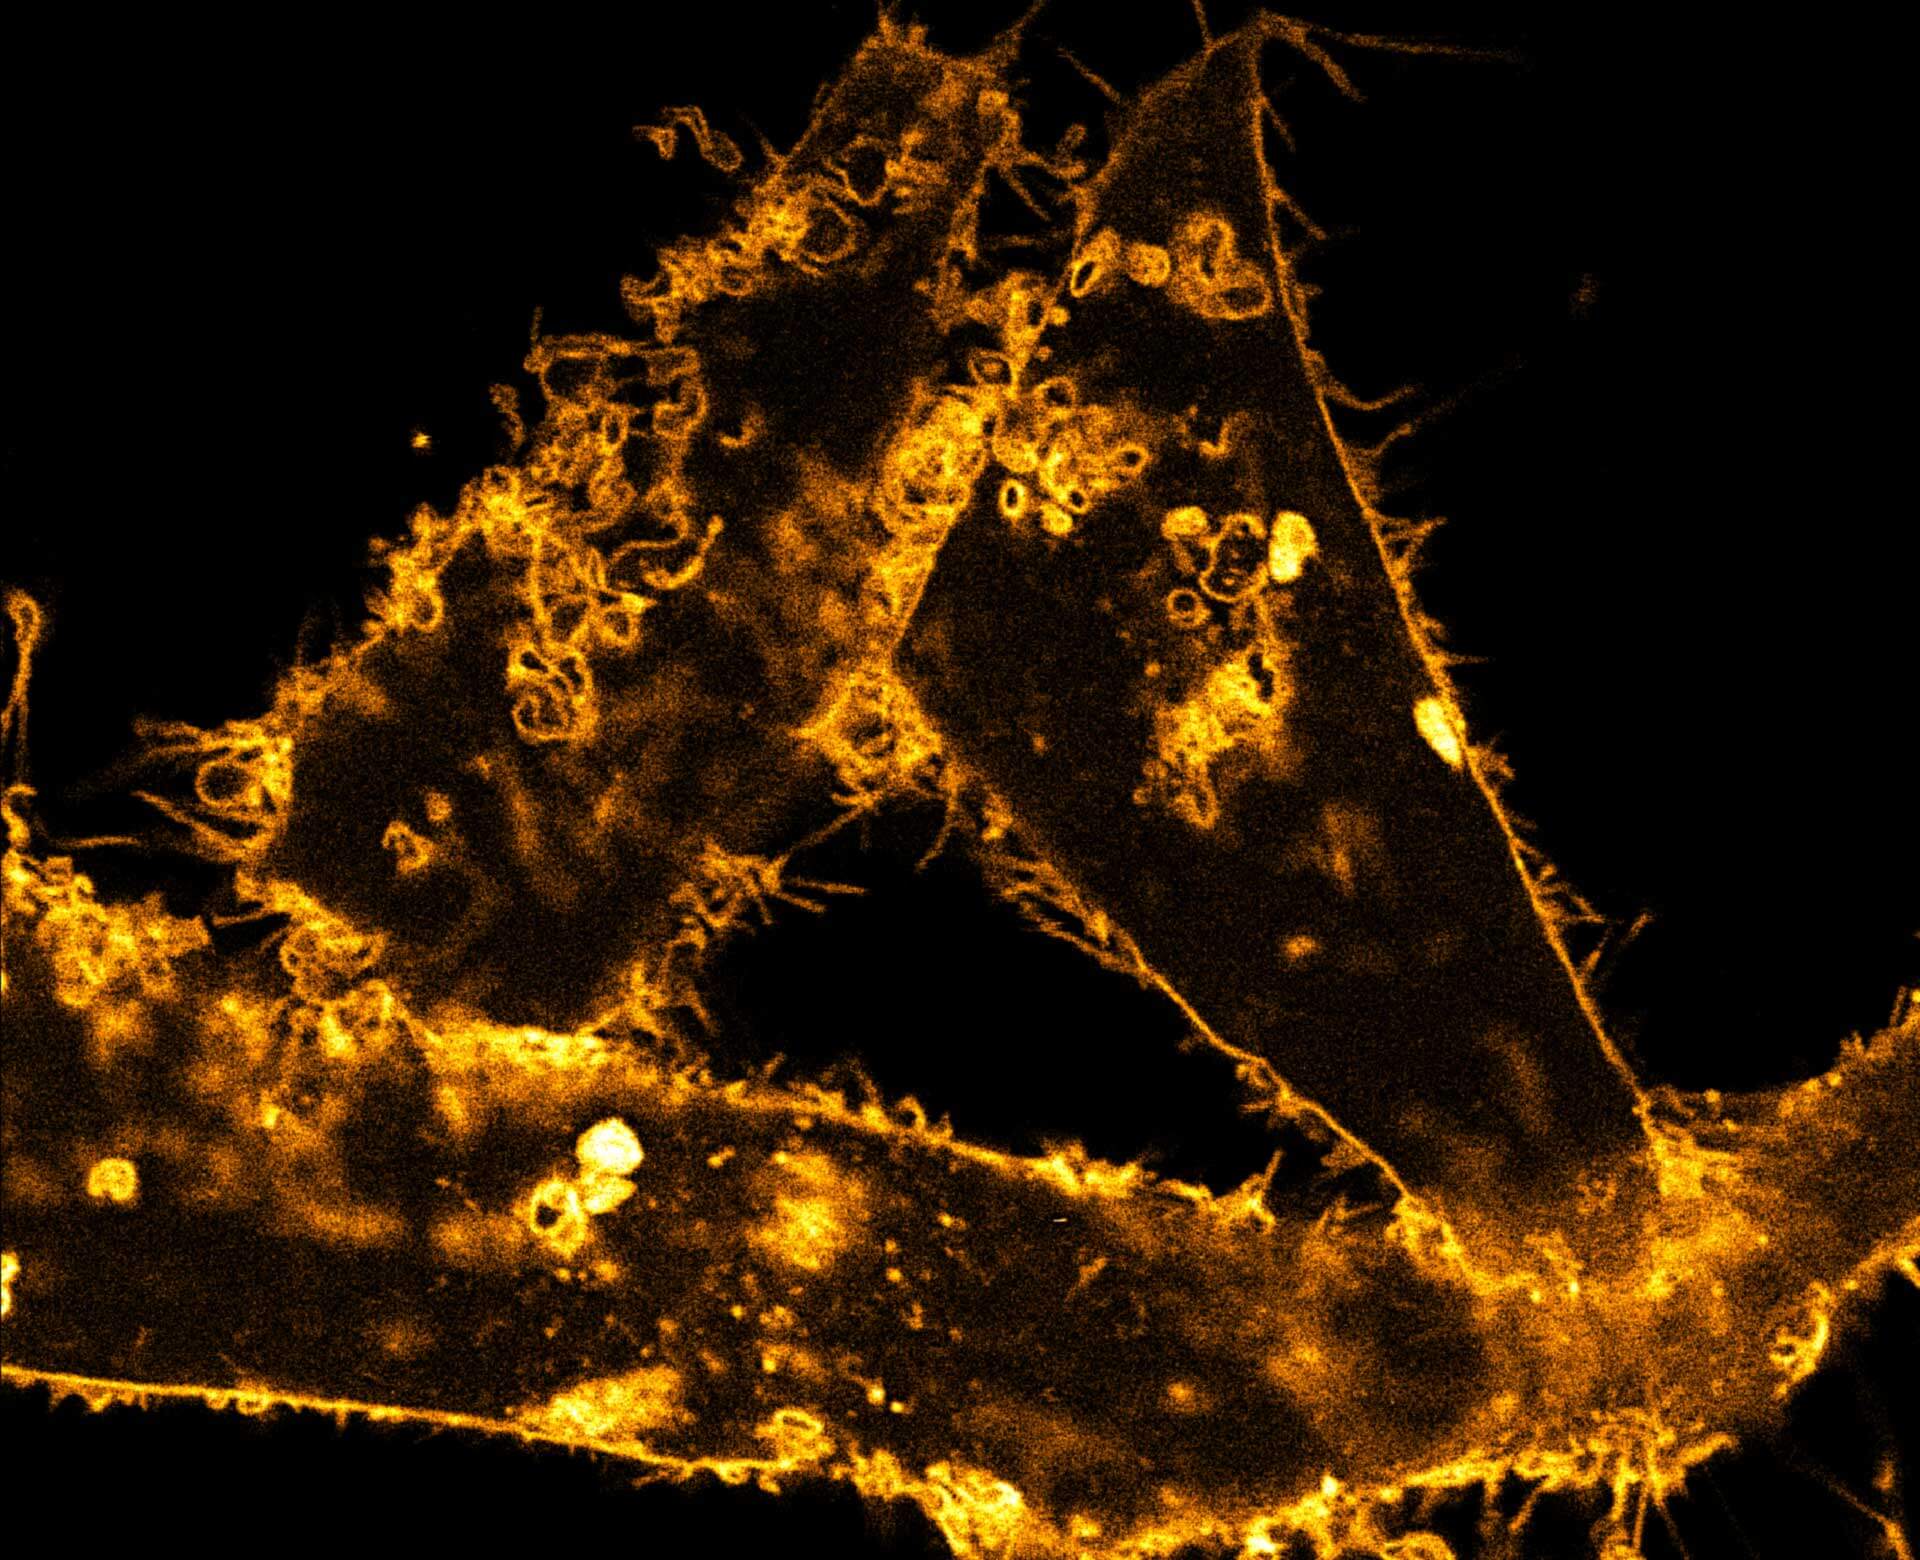
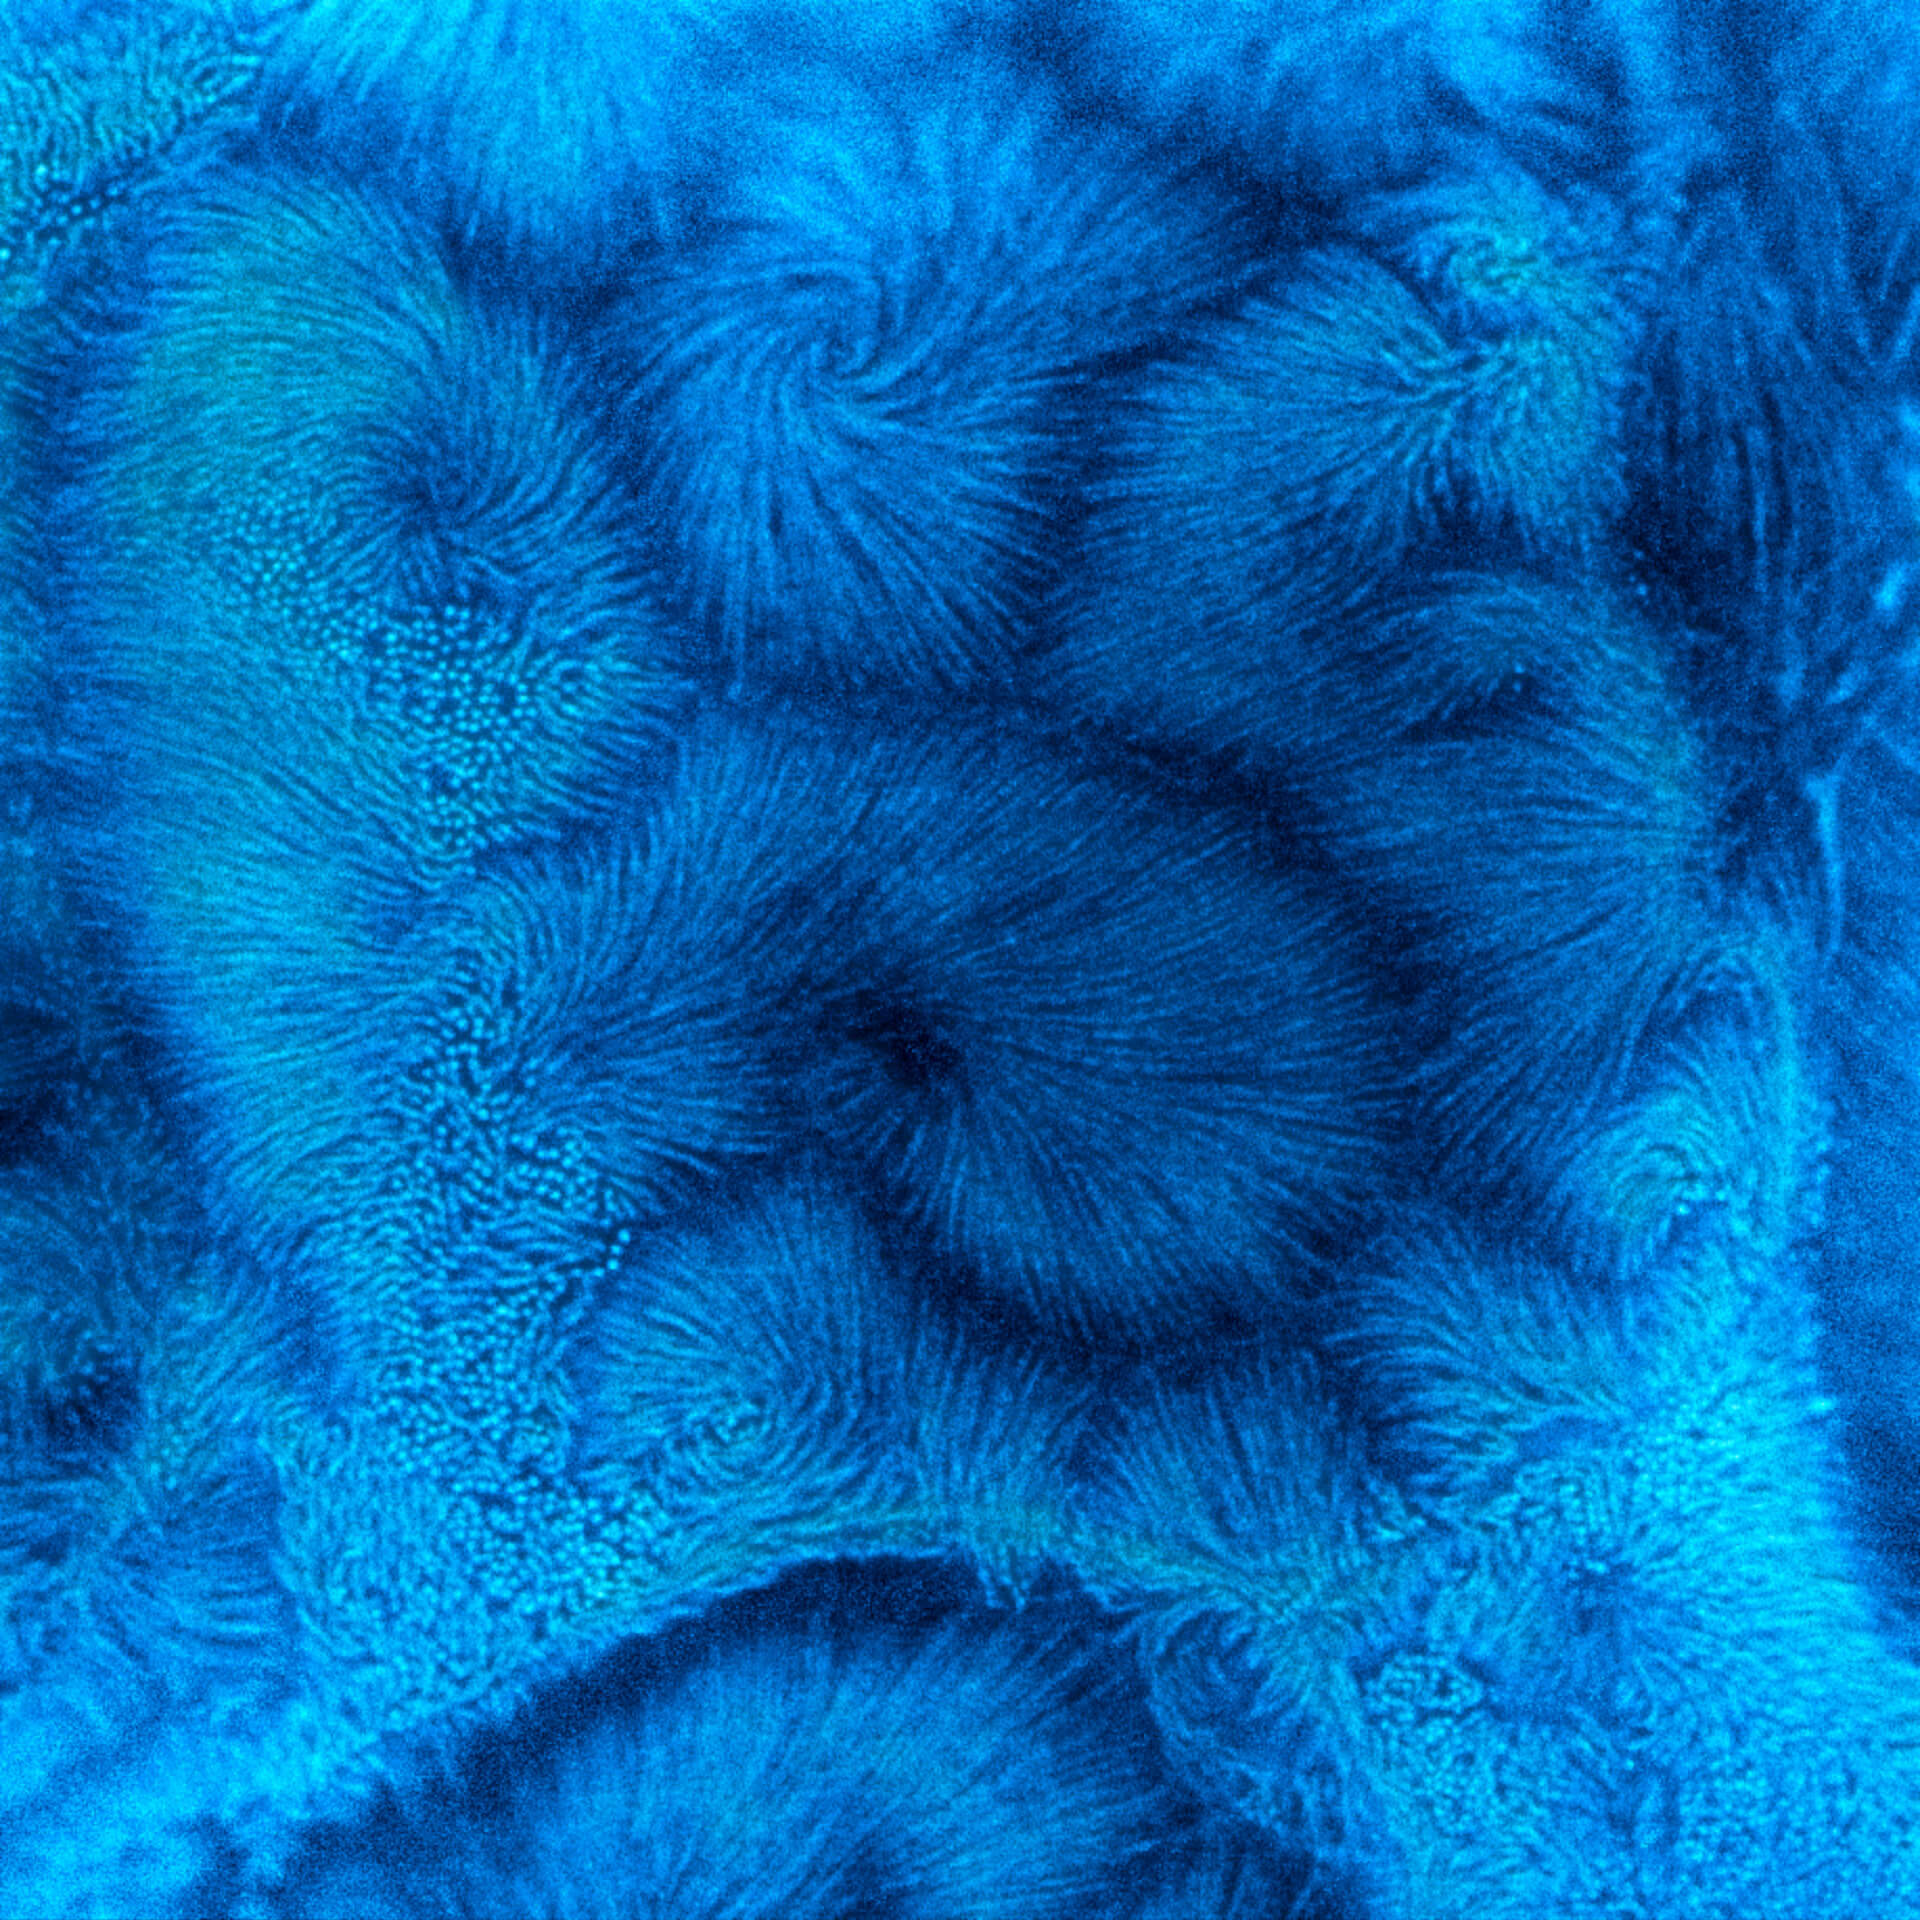
TIMEBOW STED vs MATRIX + TIMEBOW STED
Actin in microvilli of CaCo2 cells recorded with FACILITY. Fixed cells were stained with abberior STAR RED phalloidin. Imaging of the intense-background sample is optimized by MATRIX detection by directly subtracting unfocussed data. To boost resolution TIMEBOW is used, keeping STED laser power low. Lifetime information enables the selective exclusion of STED-affected emission at the rim of each measurement.
We thank Prof. Dorothee Günzel and Jörg Piontek (Charité, Berlin, DE) for providing this sample.
Modules:
Description
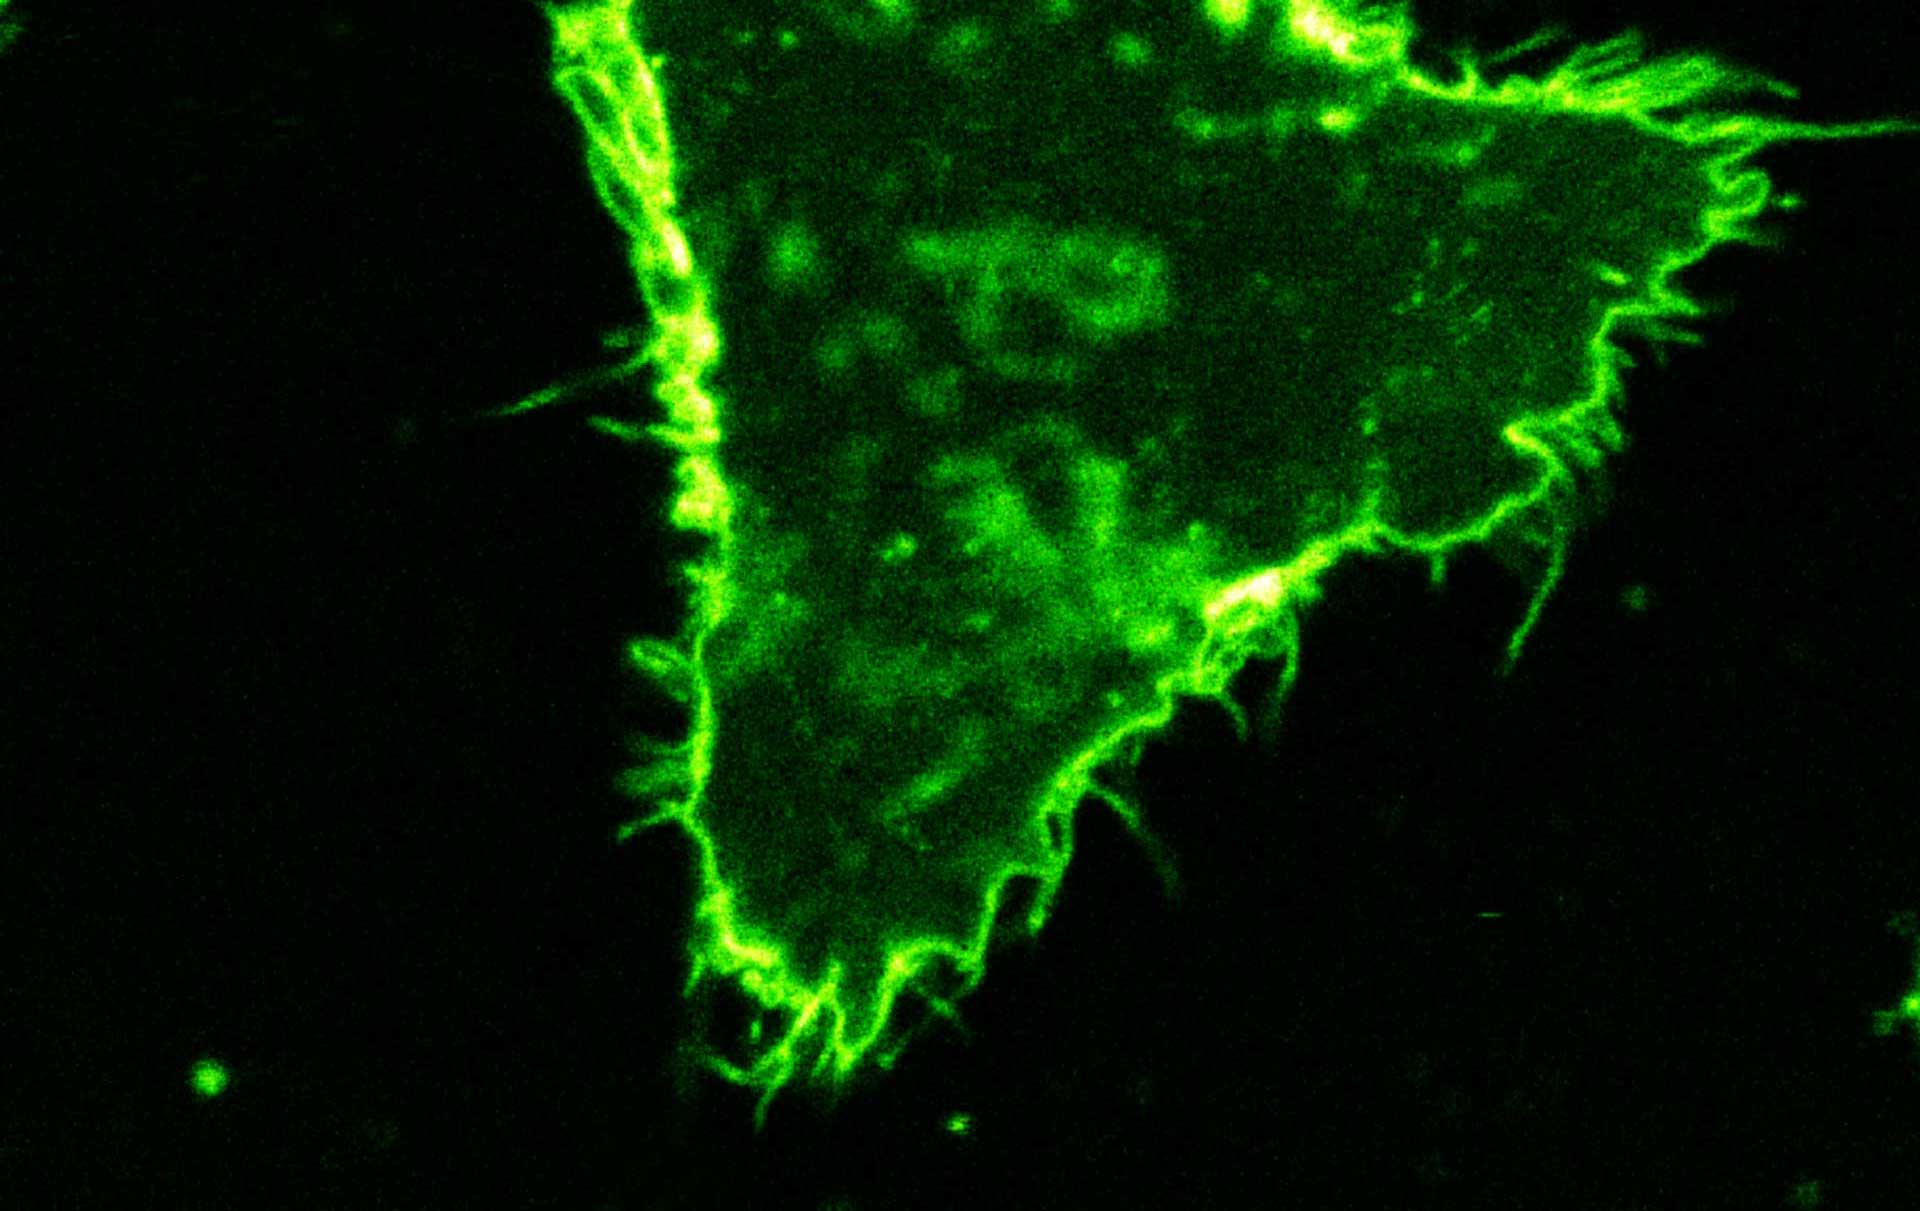
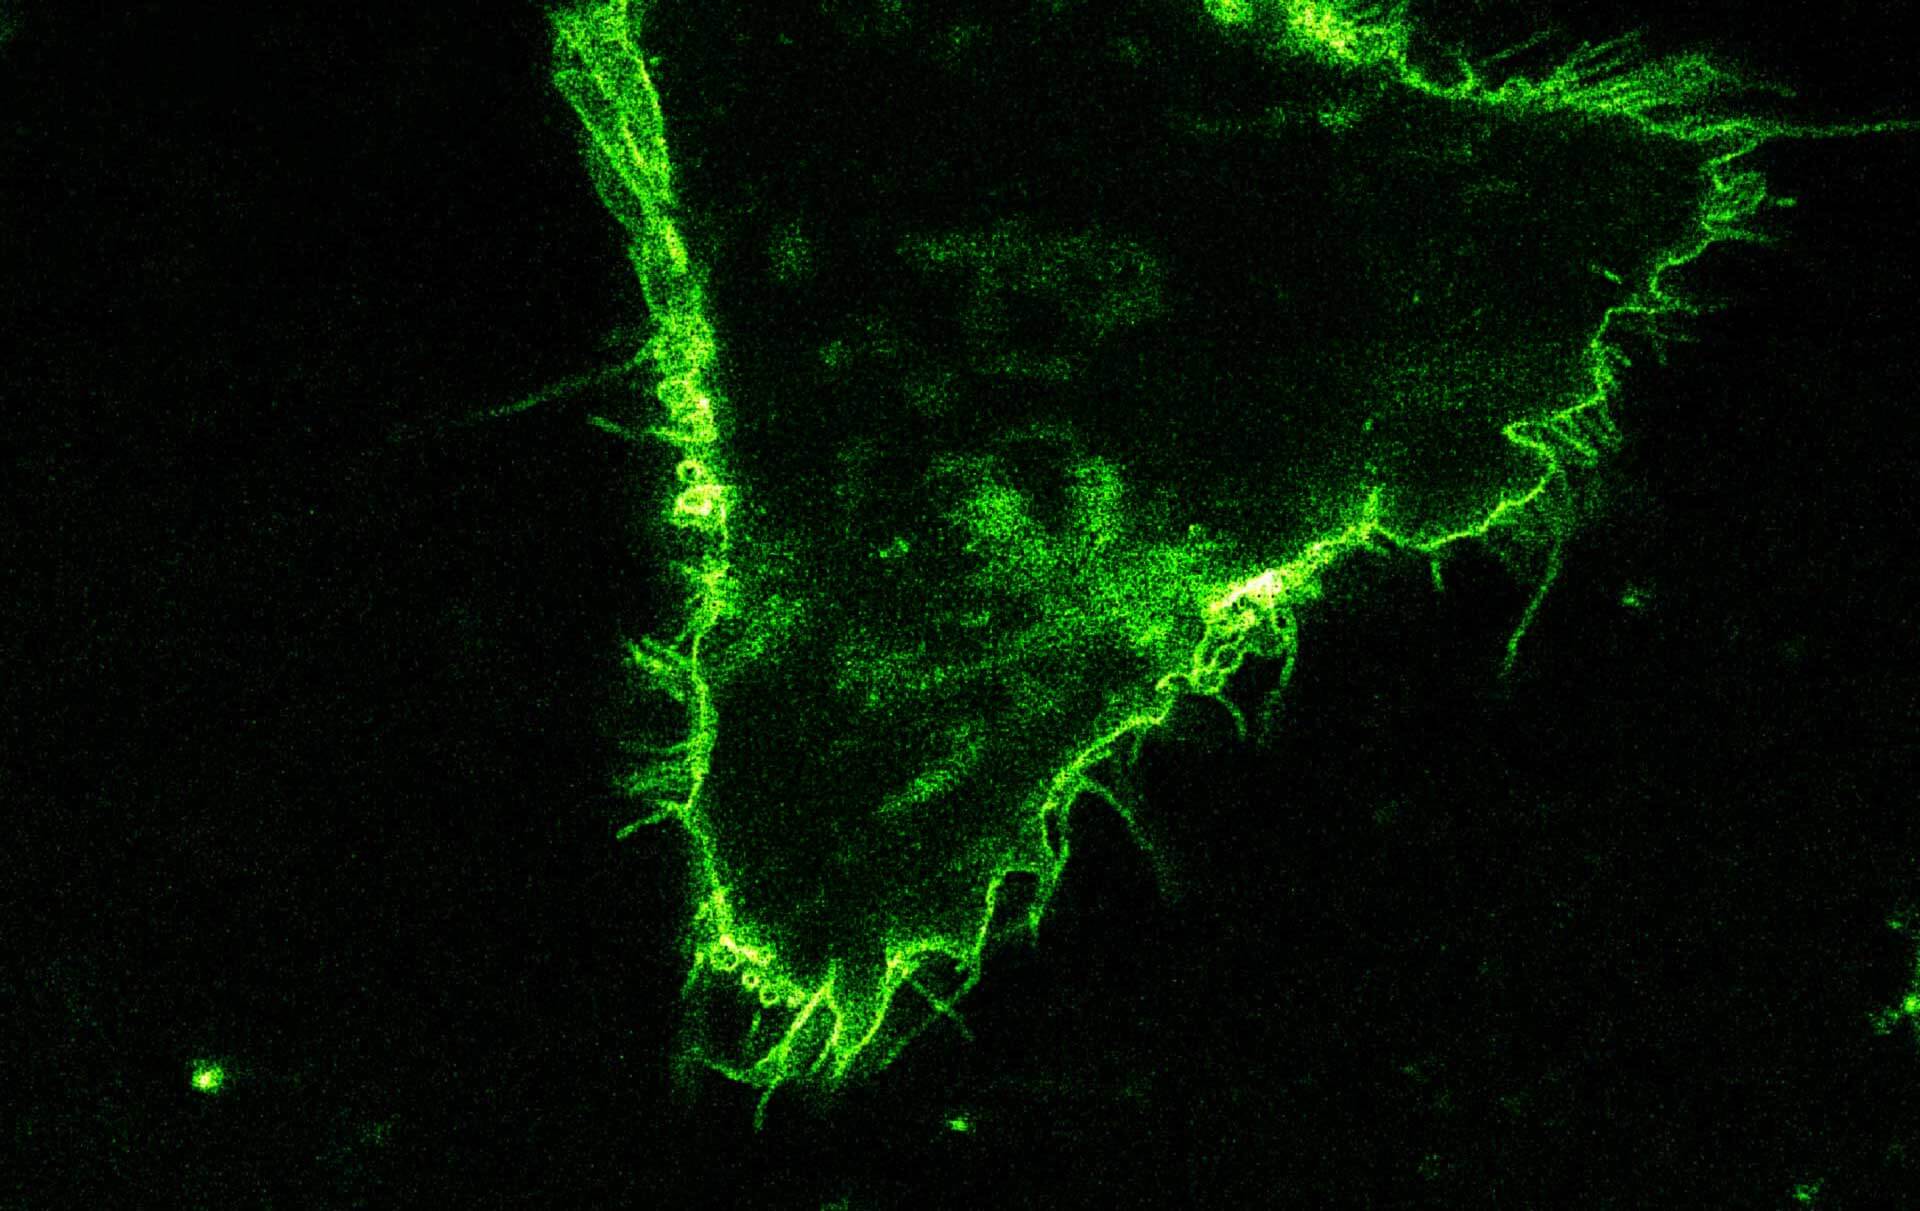
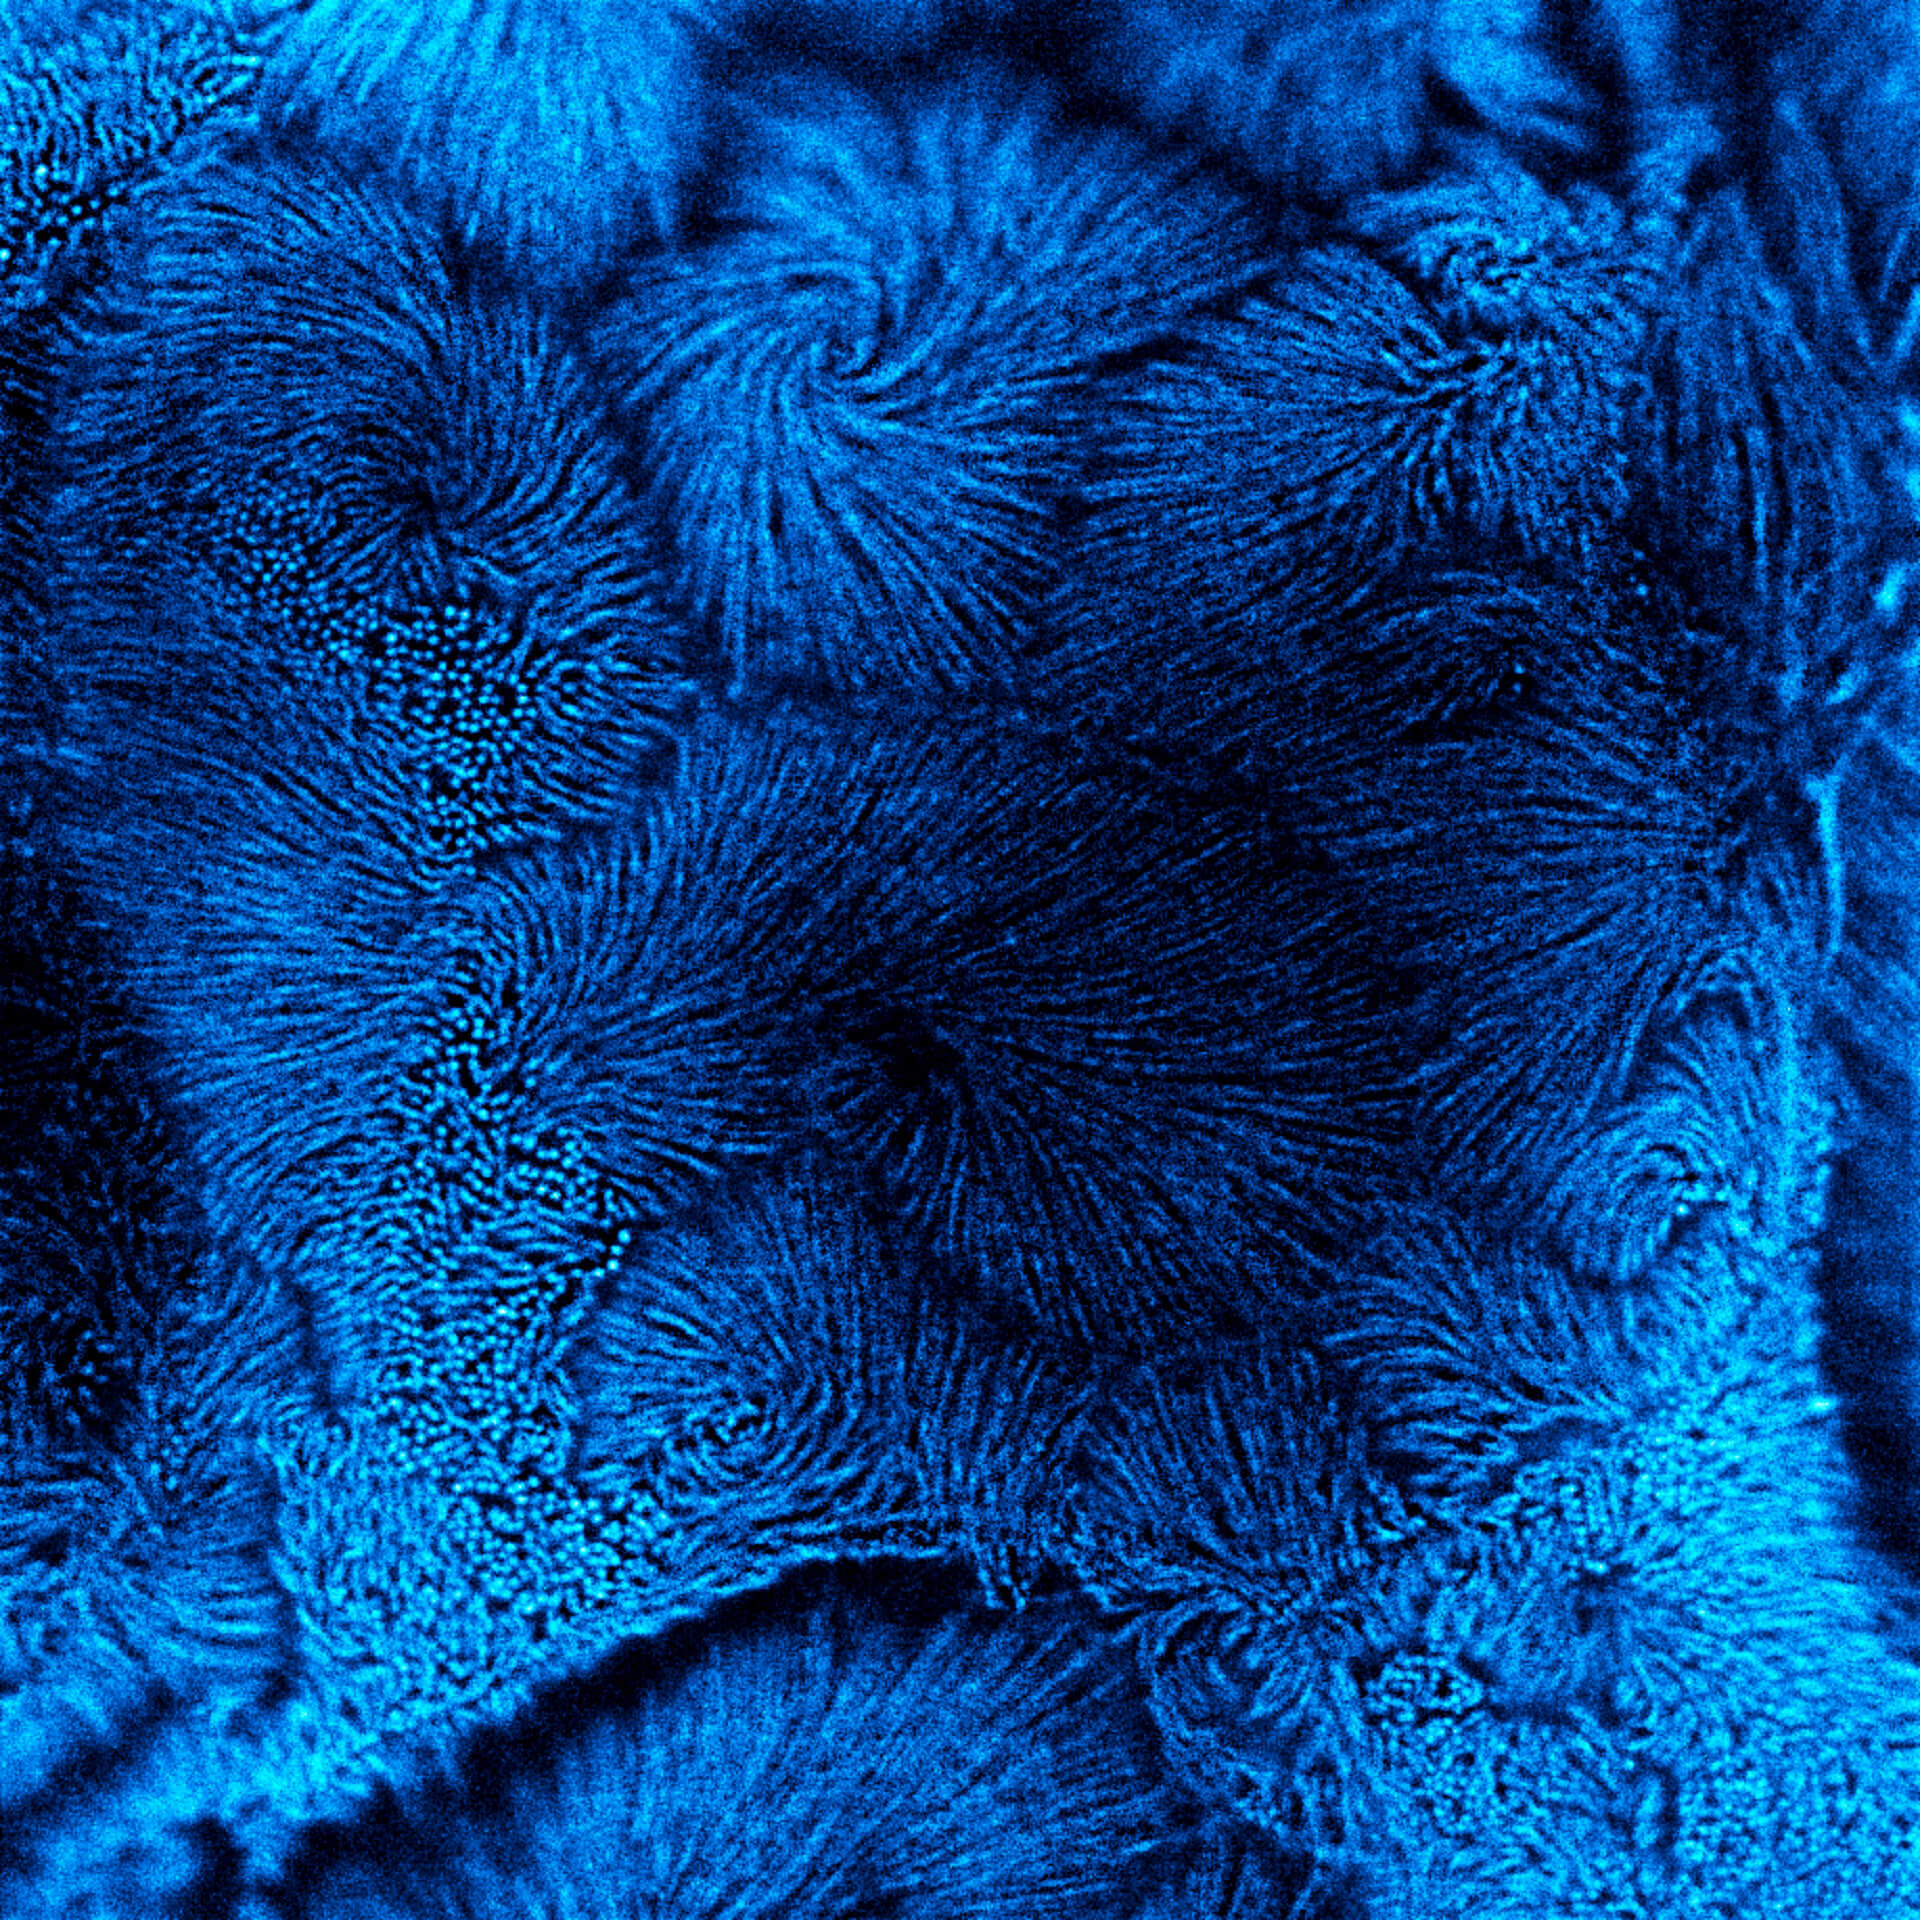
Confocal vs MATRIX + TIMEBOW STED
Actin in microvilli of CaCo2 cells recorded with FACILITY. Fixed cells were stained with abberior STAR RED phalloidin. Imaging of the intense-background sample is optimized by MATRIX detection by directly subtracting unfocussed data. To boost resolution TIMEBOW is used, keeping STED laser power low. Lifetime information enables the selective exclusion of STED-affected emission at the rim of each measurement.
We thank Prof. Dorothee Günzel and Jörg Piontek (Charité, Berlin, DE) for providing this sample.
Modules: