

Escaping the colocalization illusion
Highlights
- Confocal assessment of nuclear pore protein colocalization is resolution-limited and may produce misleading results
- STED reveals true nanoscale organization of the nuclear pore
- STED allows quantitative spatial analysis of protein colocalization
- STED is a natural extension of confocal workflows
Turning apparent overlap into true nanoscale proximity

Introduction
Colocalization analysis is a cornerstone of fluorescence microscopy, widely used to infer spatial relationships between proteins and cellular structures. Confocal microscopy is the standard for such studies, offering optical sectioning and multicolor imaging. However, its spatial resolution is fundamentally limited by diffraction to ∼200 nm laterally. Many biological structures are smaller or more densely packed than this. Consequently, their signals overlap in confocal images, often leading to inflated or ambiguous colocalization values (1,2). If your research requires quantitative nanoscale insight, this poses a fundamental challenge.
Stimulated emission depletion (STED) microscopy extends confocal workflows into the nanometer scale, enabling researchers to turn colocalization from an approximation into a meaningful quantitative measurement.
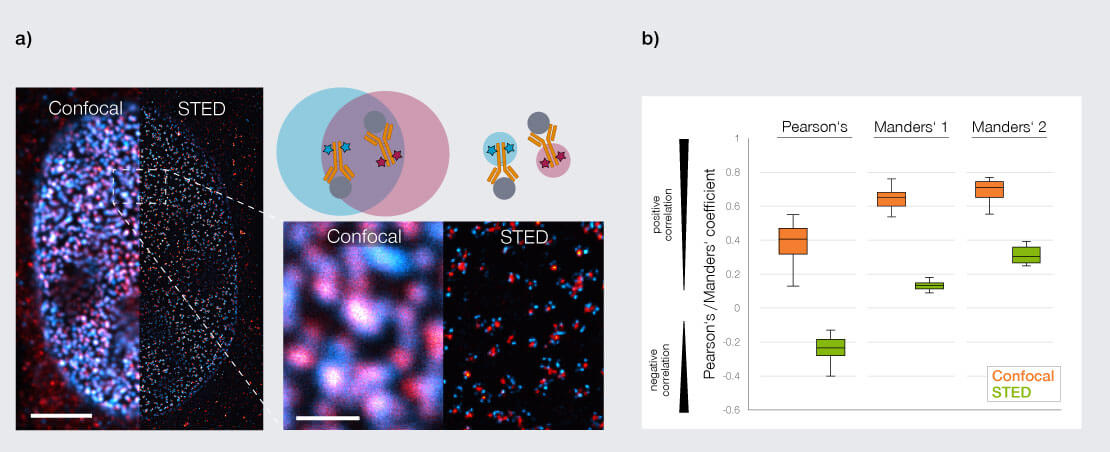
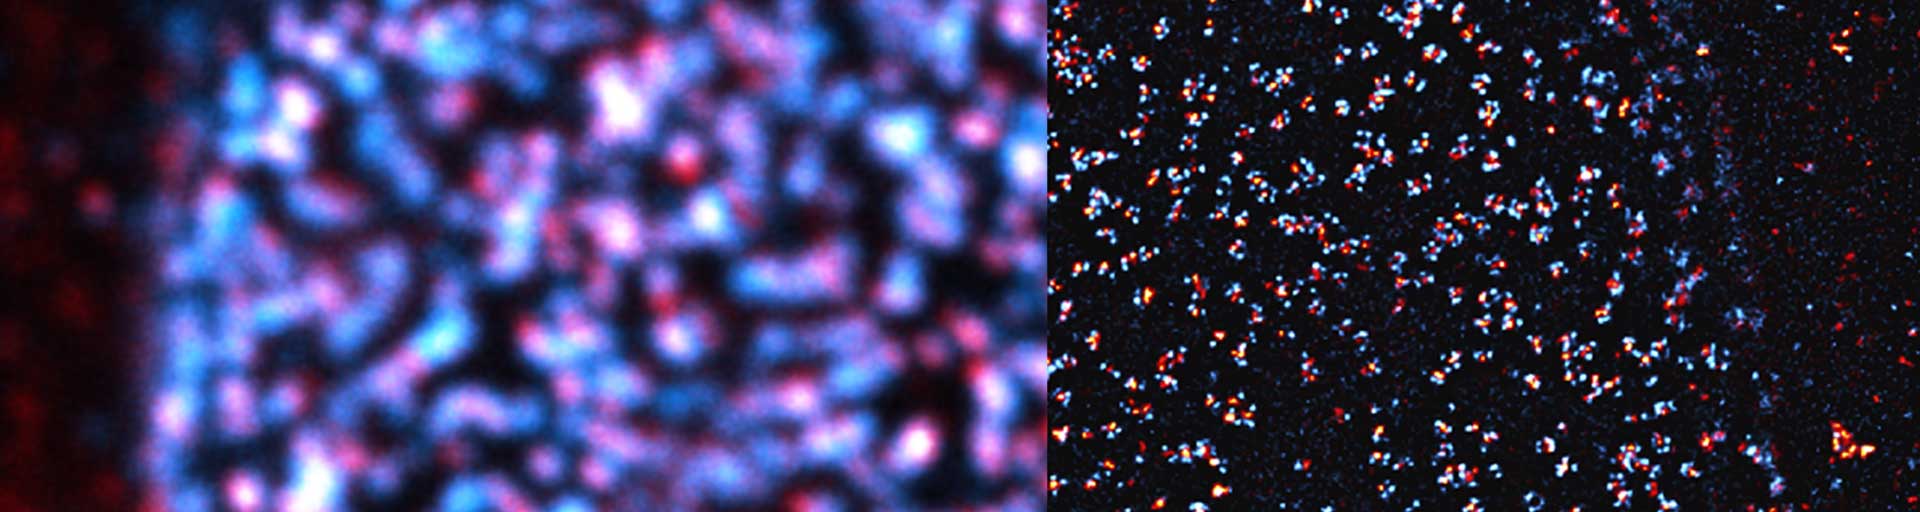
Figure 1: Colocalization analysis of two nuclear pore proteins. a) Representative two channel images of nuclear pore proteins; proteins labeled are ELYS (NUP ring in cyan, abberior STAR RED) and Mab414 (NUP center in red, abberior STAR ORANGE). Scale bars are 5 µm in the overview and 1 µm in the inset, respectively. b) Calculating Pearson’s and Manders’ coefficients from n=10 nuclei in the images in a) highlights the difference in colocalization metrics between confocal and STED microscopy: both metrics are highly inflated in confocal imaging compared to STED.
Why can confocal colocalization be misleading?
In a confocal microscope, fluorescent signals originating from distinct but closely spaced structures are blurred into a single diffraction-limited spot. As a result, apparent overlap does not necessarily reflect true molecular proximity but rather the size of the point spread function. In densely packed environments – such as protein assemblies or membrane-associated complexes – this effect can lead to systematic overestimation of colocalization and, consequently, false conclusions (1,2).
How does STED overcome the diffraction limit?
STED microscopy overcomes the diffraction limit by selectively switching off fluorescence around the focal center using a donut-shaped depletion beam (3). abberior STED systems such as MIRAVA POLYSCOPE and STEDYCON routinely achieve lateral resolutions of 30-50 nm while retaining the optical sectioning, multicolor capability, sample preparation, and imaging workflow of confocal microscopy.
How do colocalization metrics change with higher resolution?
Common metrics such as Pearson’s correlation coefficient quantify intensity correlation, while Manders’ coefficients describe fractional signal overlap. In confocal data, both can be inflated by diffraction-driven signal mixing. By resolving closely spaced structures, STED reduces false-positive overlap and separates adjacent signals into distinct features (1,2). Pearson’s coefficients become more sensitive to true spatial correlation, and Manders’ values more accurately reflect genuine molecular co-occurrence rather than optical blur.
STED brings yet another significant advantage when addressing colocalization: using a single STED beam to deplete the signal from two or more different types of fluorophores guarantees that the two signals are perfectly coaligned and eliminates chromatic aberrations that would otherwise reduce the precision of colocalization analysis (3).
Why does nanoscale information matter?
The nuclear pore complex is a ∼100 nm structure composed of multiple protein subunits arranged in defined rings. In confocal images, different nucleoporins often appear colocalized because their separation lies below the diffraction limit. STED resolves these substructures, revealing distinct spatial patterns and enabling colocalization analysis that reflects the underlying molecular architecture rather than an averaged signal that obscures true biological detail (4,5) (Fig. 1a). Pearson’s and Manders’ coefficients calculated from such images demonstrate how the higher resolution of STED vs confocal strongly improves colocalization metrics (Fig. 1b).
Conclusion
By extending confocal microscopy beyond the diffraction limit, abberior STED systems enable strongly improved structural separation. This enhances the interpretability and biological relevance of standard colocalization metrics and transforms colocalization analysis from a qualitative indication with inherent uncertainty into a quantitative nanoscale measurement. For life science researchers, STED represents a natural extension of confocal microscopy – delivering reliable quantitative imaging and greater confidence in biological conclusions.
References
- Dunn KW, Kamocka MM, McDonald JH. A practical guide to evaluating colocalization in biological microscopy. Am J Physiol Cell Physiol. 300, C723–C742 (2011). doi: 10.1152/ajpcell.00462.2010
- MacDonald L, Baldini G, Storrie B. Does super-resolution fluorescence microscopy obsolete previous microscopic approaches to protein co-localization. Methods Mol Biol. 1270, 255–275 (2014). doi: 10.1007/978-1-4939-2309-0_19
- Göttfert F, Wurm CA, Mueller V, Berning S, Cordes VC, Honigmann A, Hell SW.Coaligned Dual-Channel STED Nanoscopy and Molecular Diffusion Analysis at 20 nm Resolution. Biophys J. 105, L01-L03 (2013). doi: 10.1016/j.bpj.2013.05.029.
- Müller T, Schumann C, Kraegeloh A. STED microscopy and its applications: new insights into cellular processes on the nanoscale. ChemPhysChem. 13, 1986–2000 (2012). doi: 10.1002/cphc.201100986
- Sarkar A, Khatun R, Sengupta S, Bhattacharya M. Microscopy-based data processing in cell biology. Cell. 13, 1–22 (2025). doi: 10.11648/j.cb.20251301.11
Authors
Bastian Klußmann-Fricke, Frederik Köpper