Sample gallery
Fluorescence imaging, whether at confocal, STED or MINFLUX resolution, guarantees unique insights into the function and structure of life at the molecular level. Besides the scientific information content, some sample portraits provide simply beautiful images. Enjoy browsing our sample gallery.
the fine art of science
Description
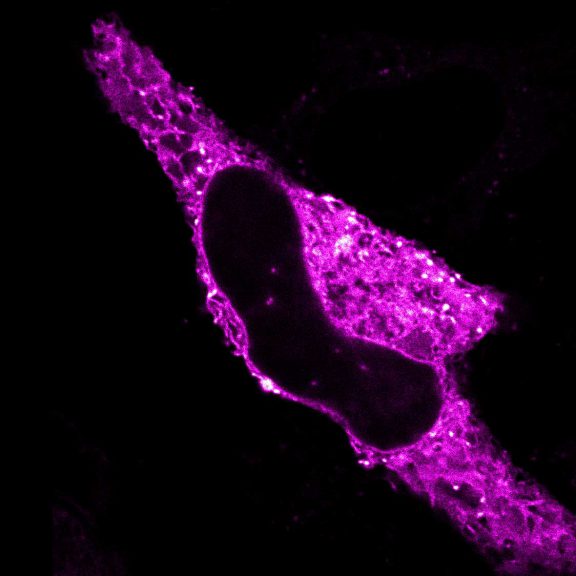
Confocal and STED time lapse of a living cell expressing SNAP-tag® fusion protein fusion protein in the endoplasmic reticulum lumen with SNAP and C-terminal tetrapeptide KDEL. SNAP-KDEL was labelled with abberior LIVE 610 SNAP ligand (benzylguanine).
The SNAP-KDEL plasmid was a gift from Francesca Bottanelli, FU Berlin.
Description
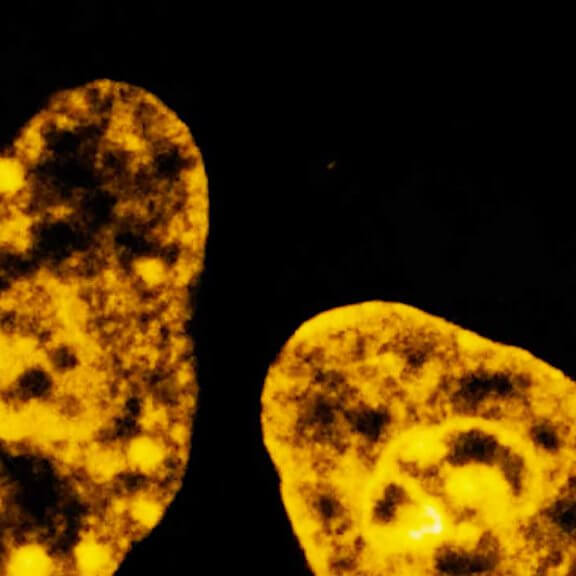
Live cell time lapse of abberior LIVE 590 DNA probe in cultured mammalian cells.
The use of very low concentrations of our abberior LIVE dyes reduces toxicity and allows long-term imaging of dynamic processes.
Image was acquired with the FACILITY microscope.

Description
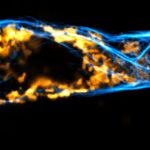
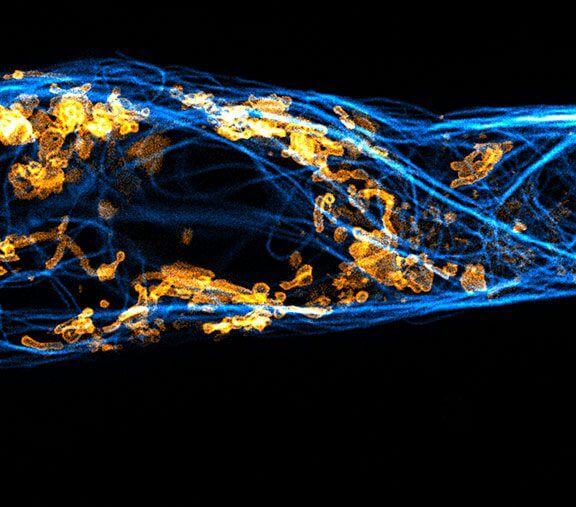
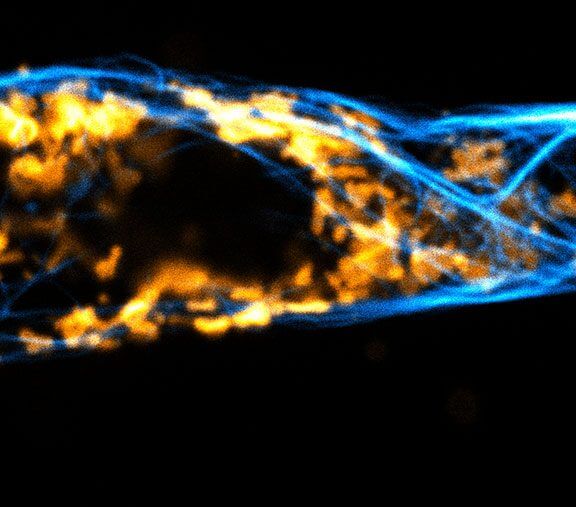
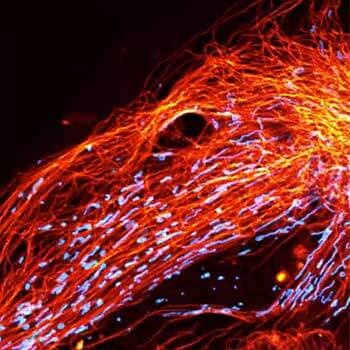
Two color live-cell confocal and STED image of a mammalian cell expressing a SNAP-tag® OMP25 fusion protein decoration the outer membrane of mitochondria. OMP25 is visualized by our new abberior LIVE 610 SNAP ligand (orange). Tubulin filaments are highlighted with abberior LIVE 550 tubulin (cyan).
The SNAP-OMP25 plasmid was a gift from Francesca Bottanelli, FU Berlin.
Description
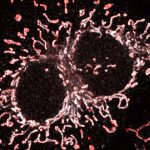
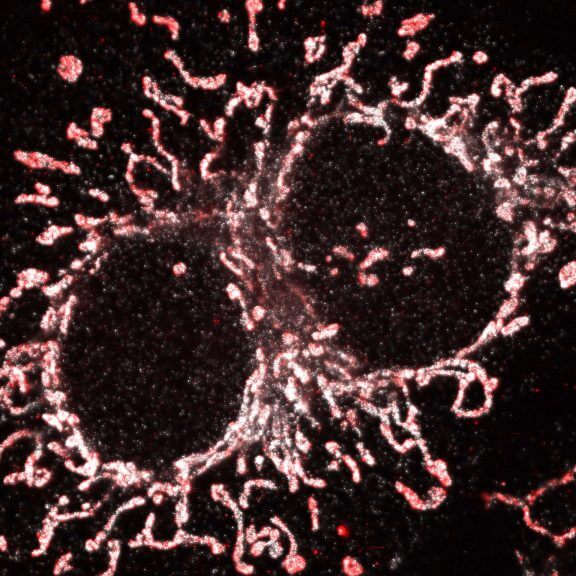
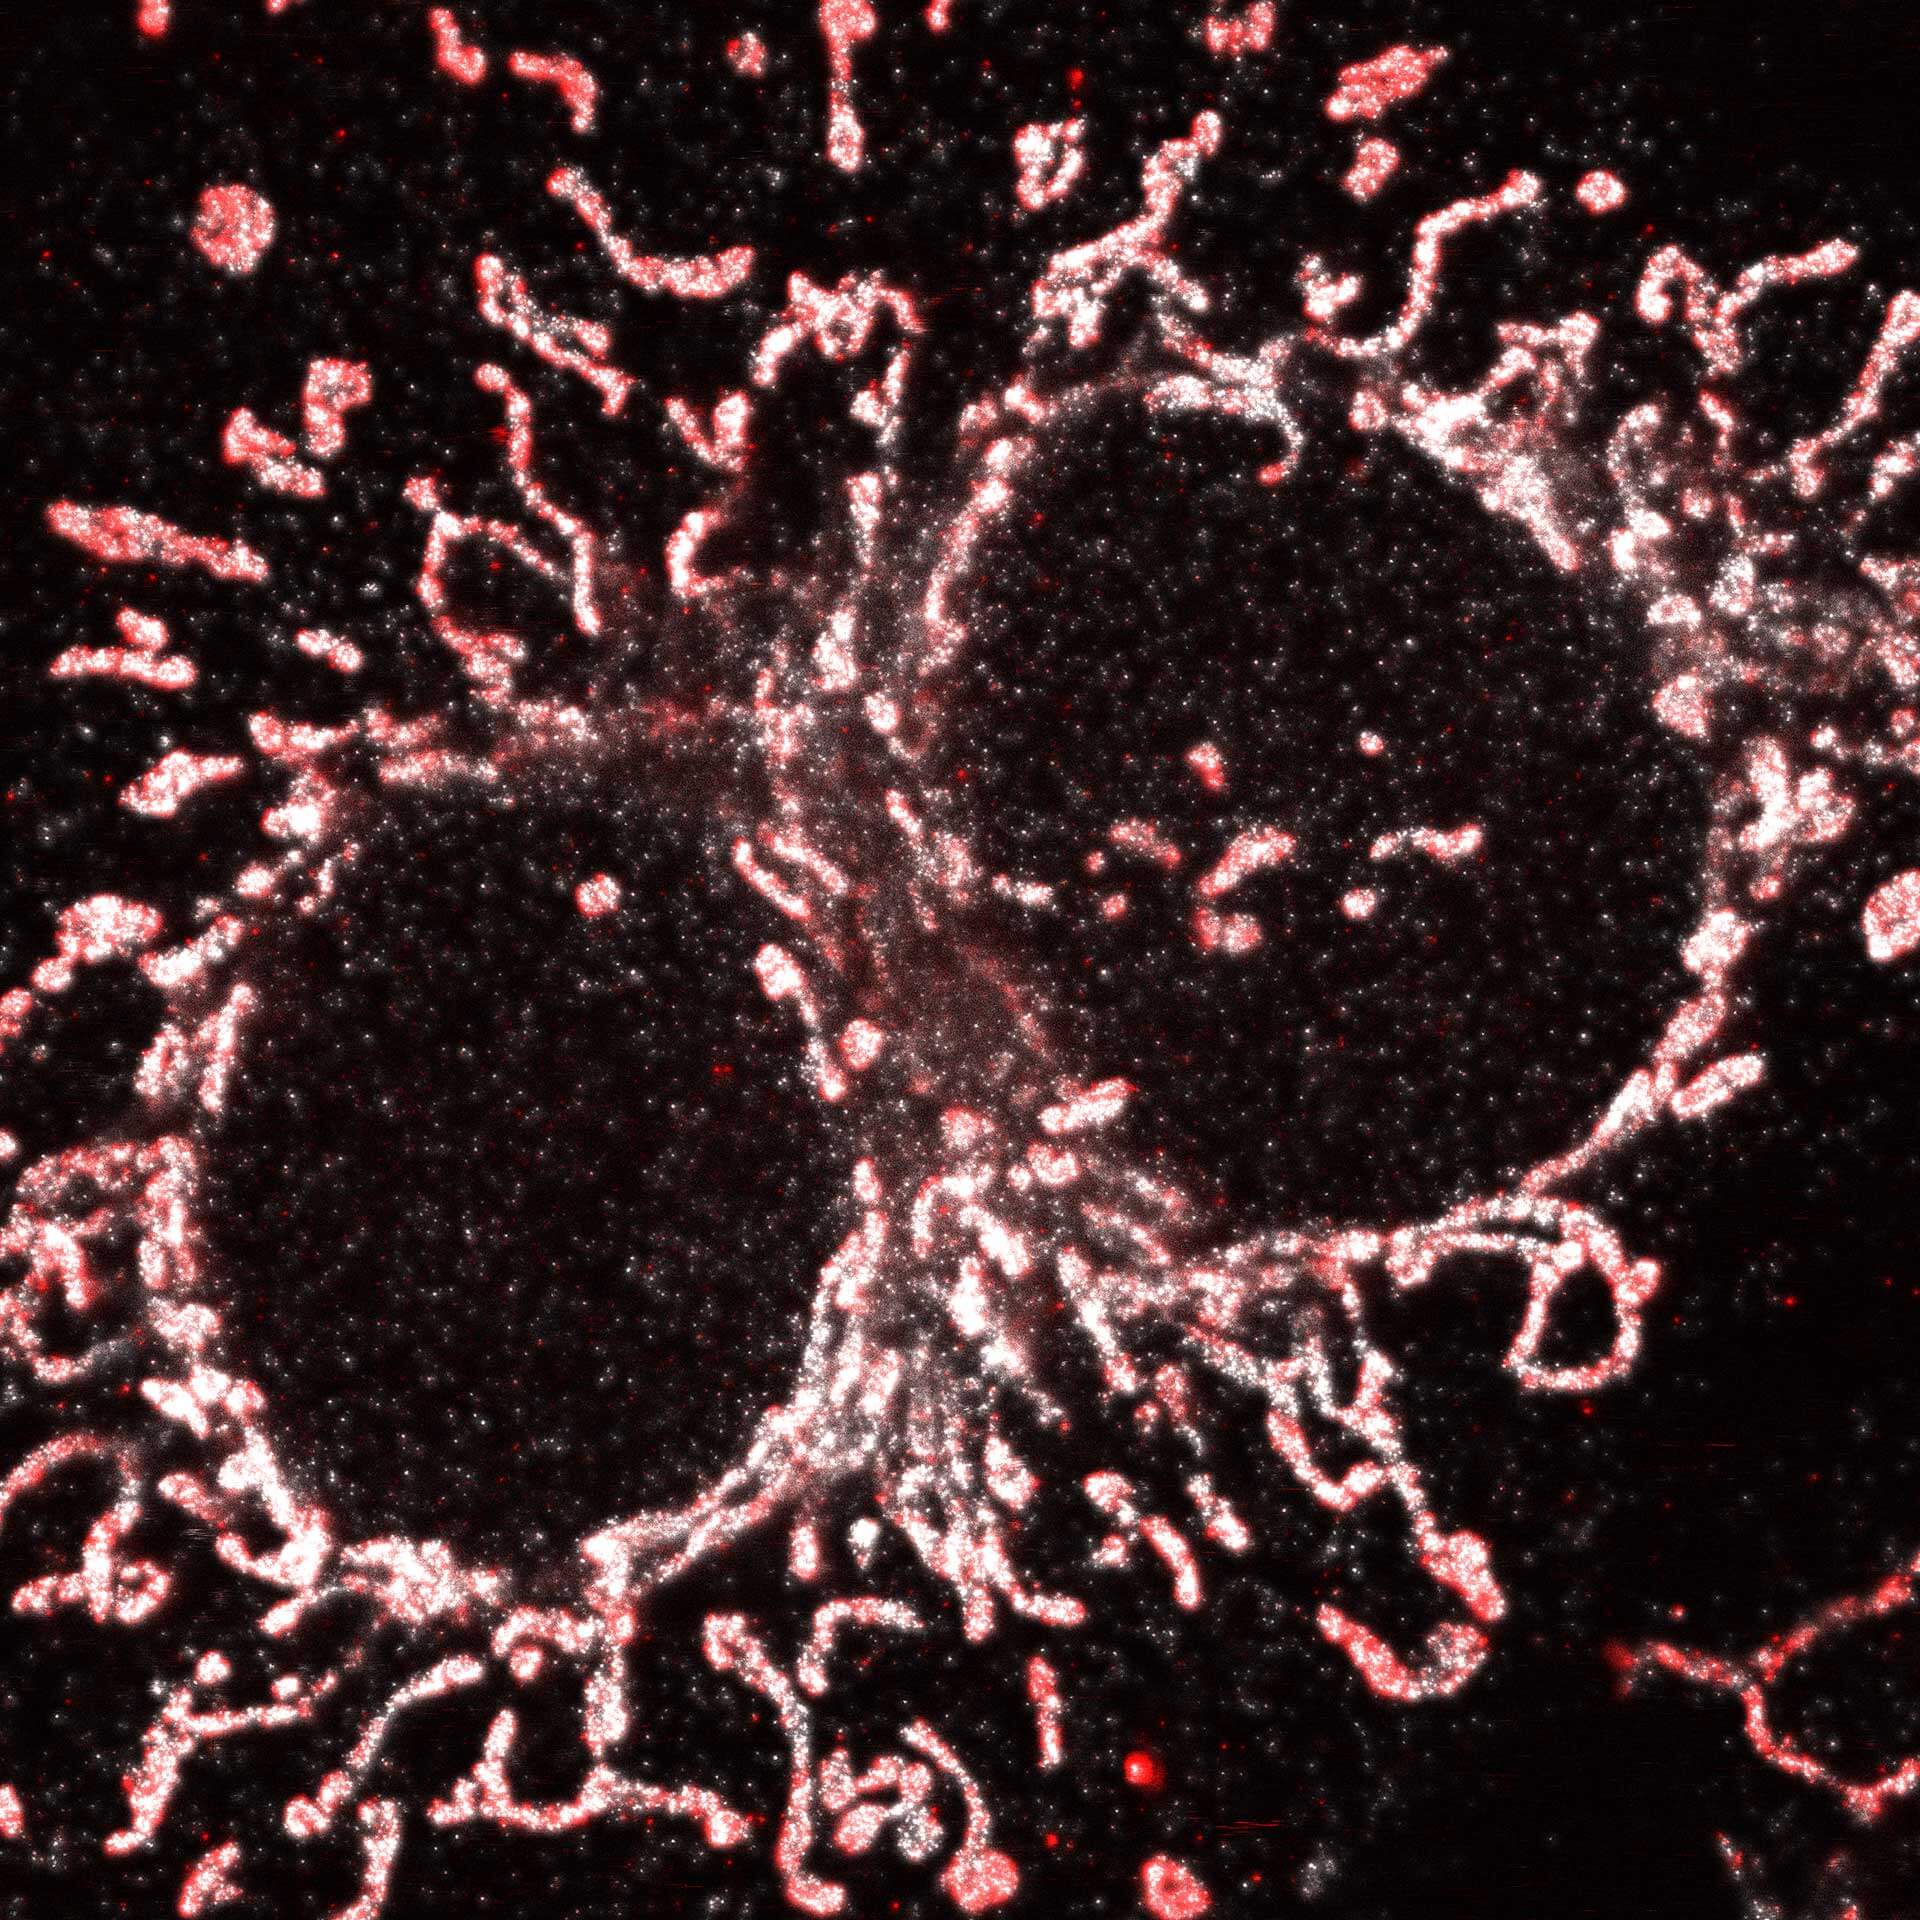
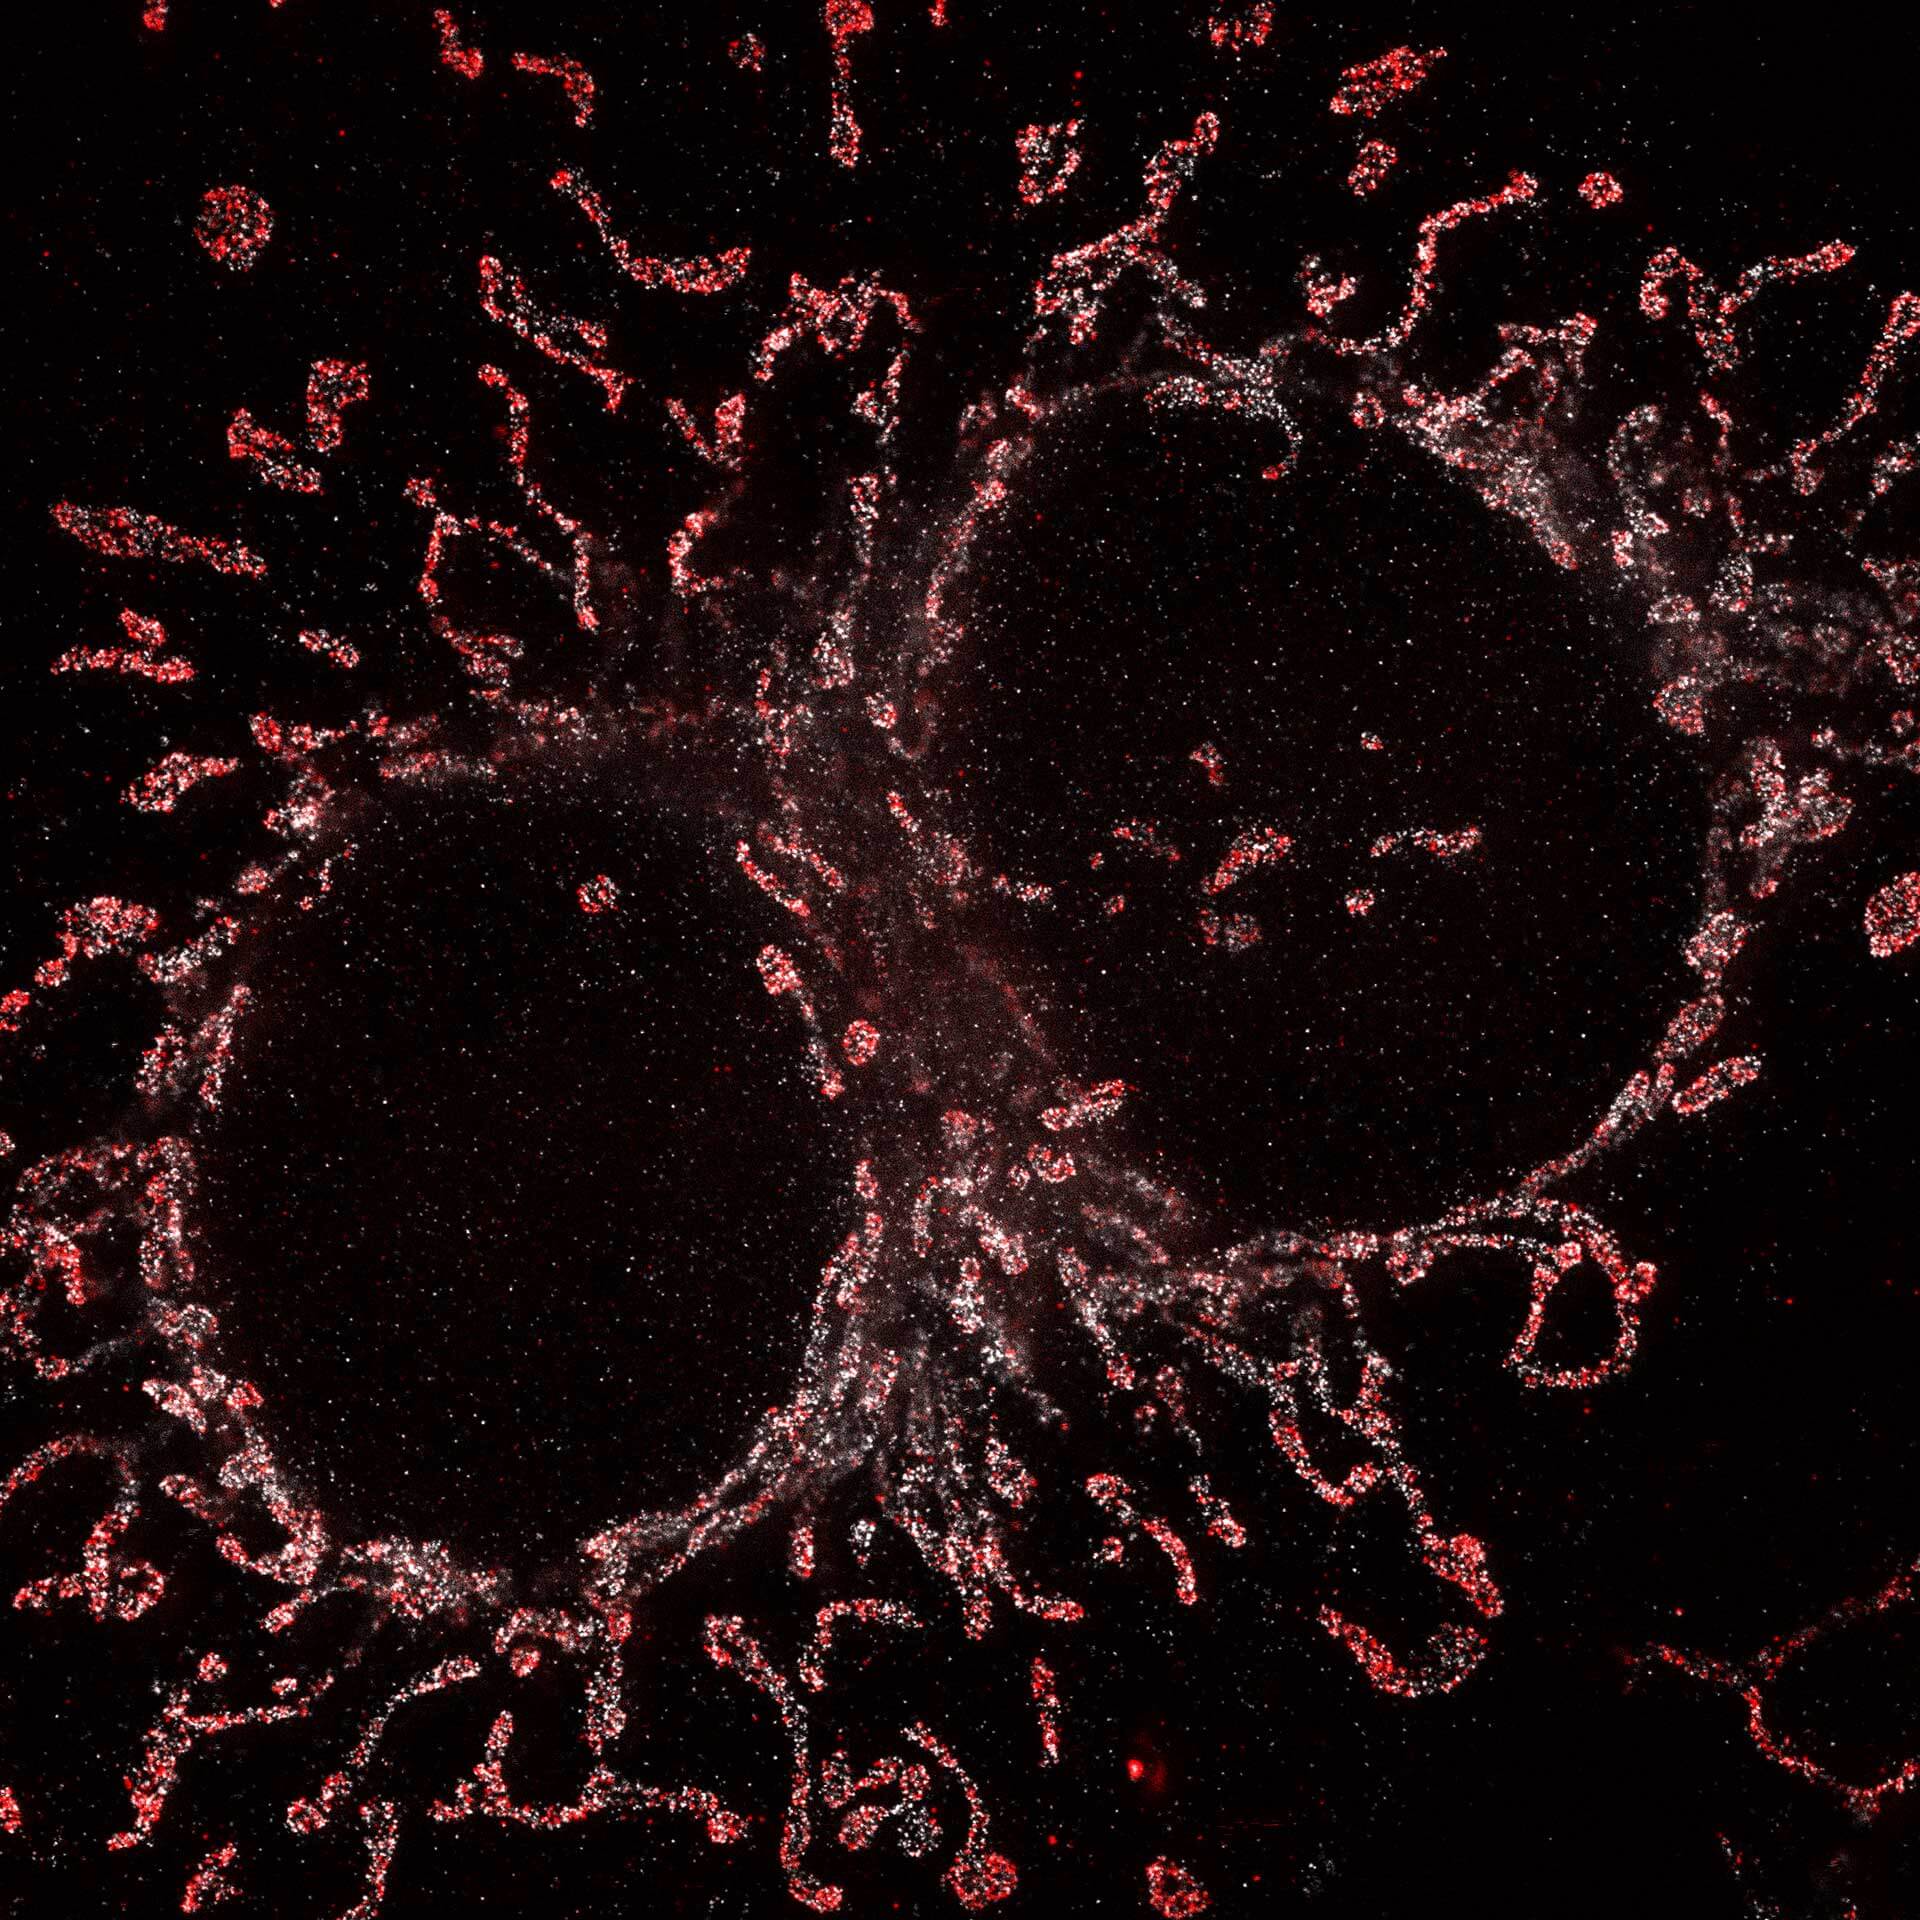
Cultured mammalian cell immunostained for an inner and outer mitochondrial membrane marker. Outer membrane is highlighted with abberior STAR RED (red) and the inner membrane with abberior STAR ORANGE (gray).
STED and confocal images were acquired with abberior's FACILITY microscope.
Description
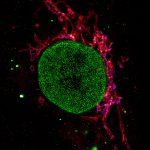
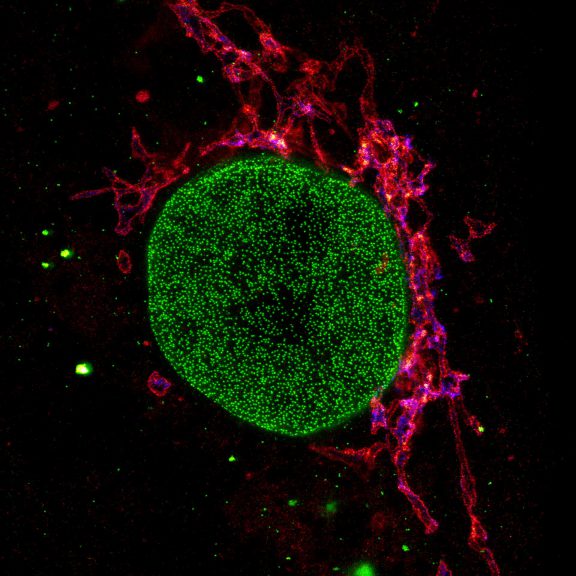
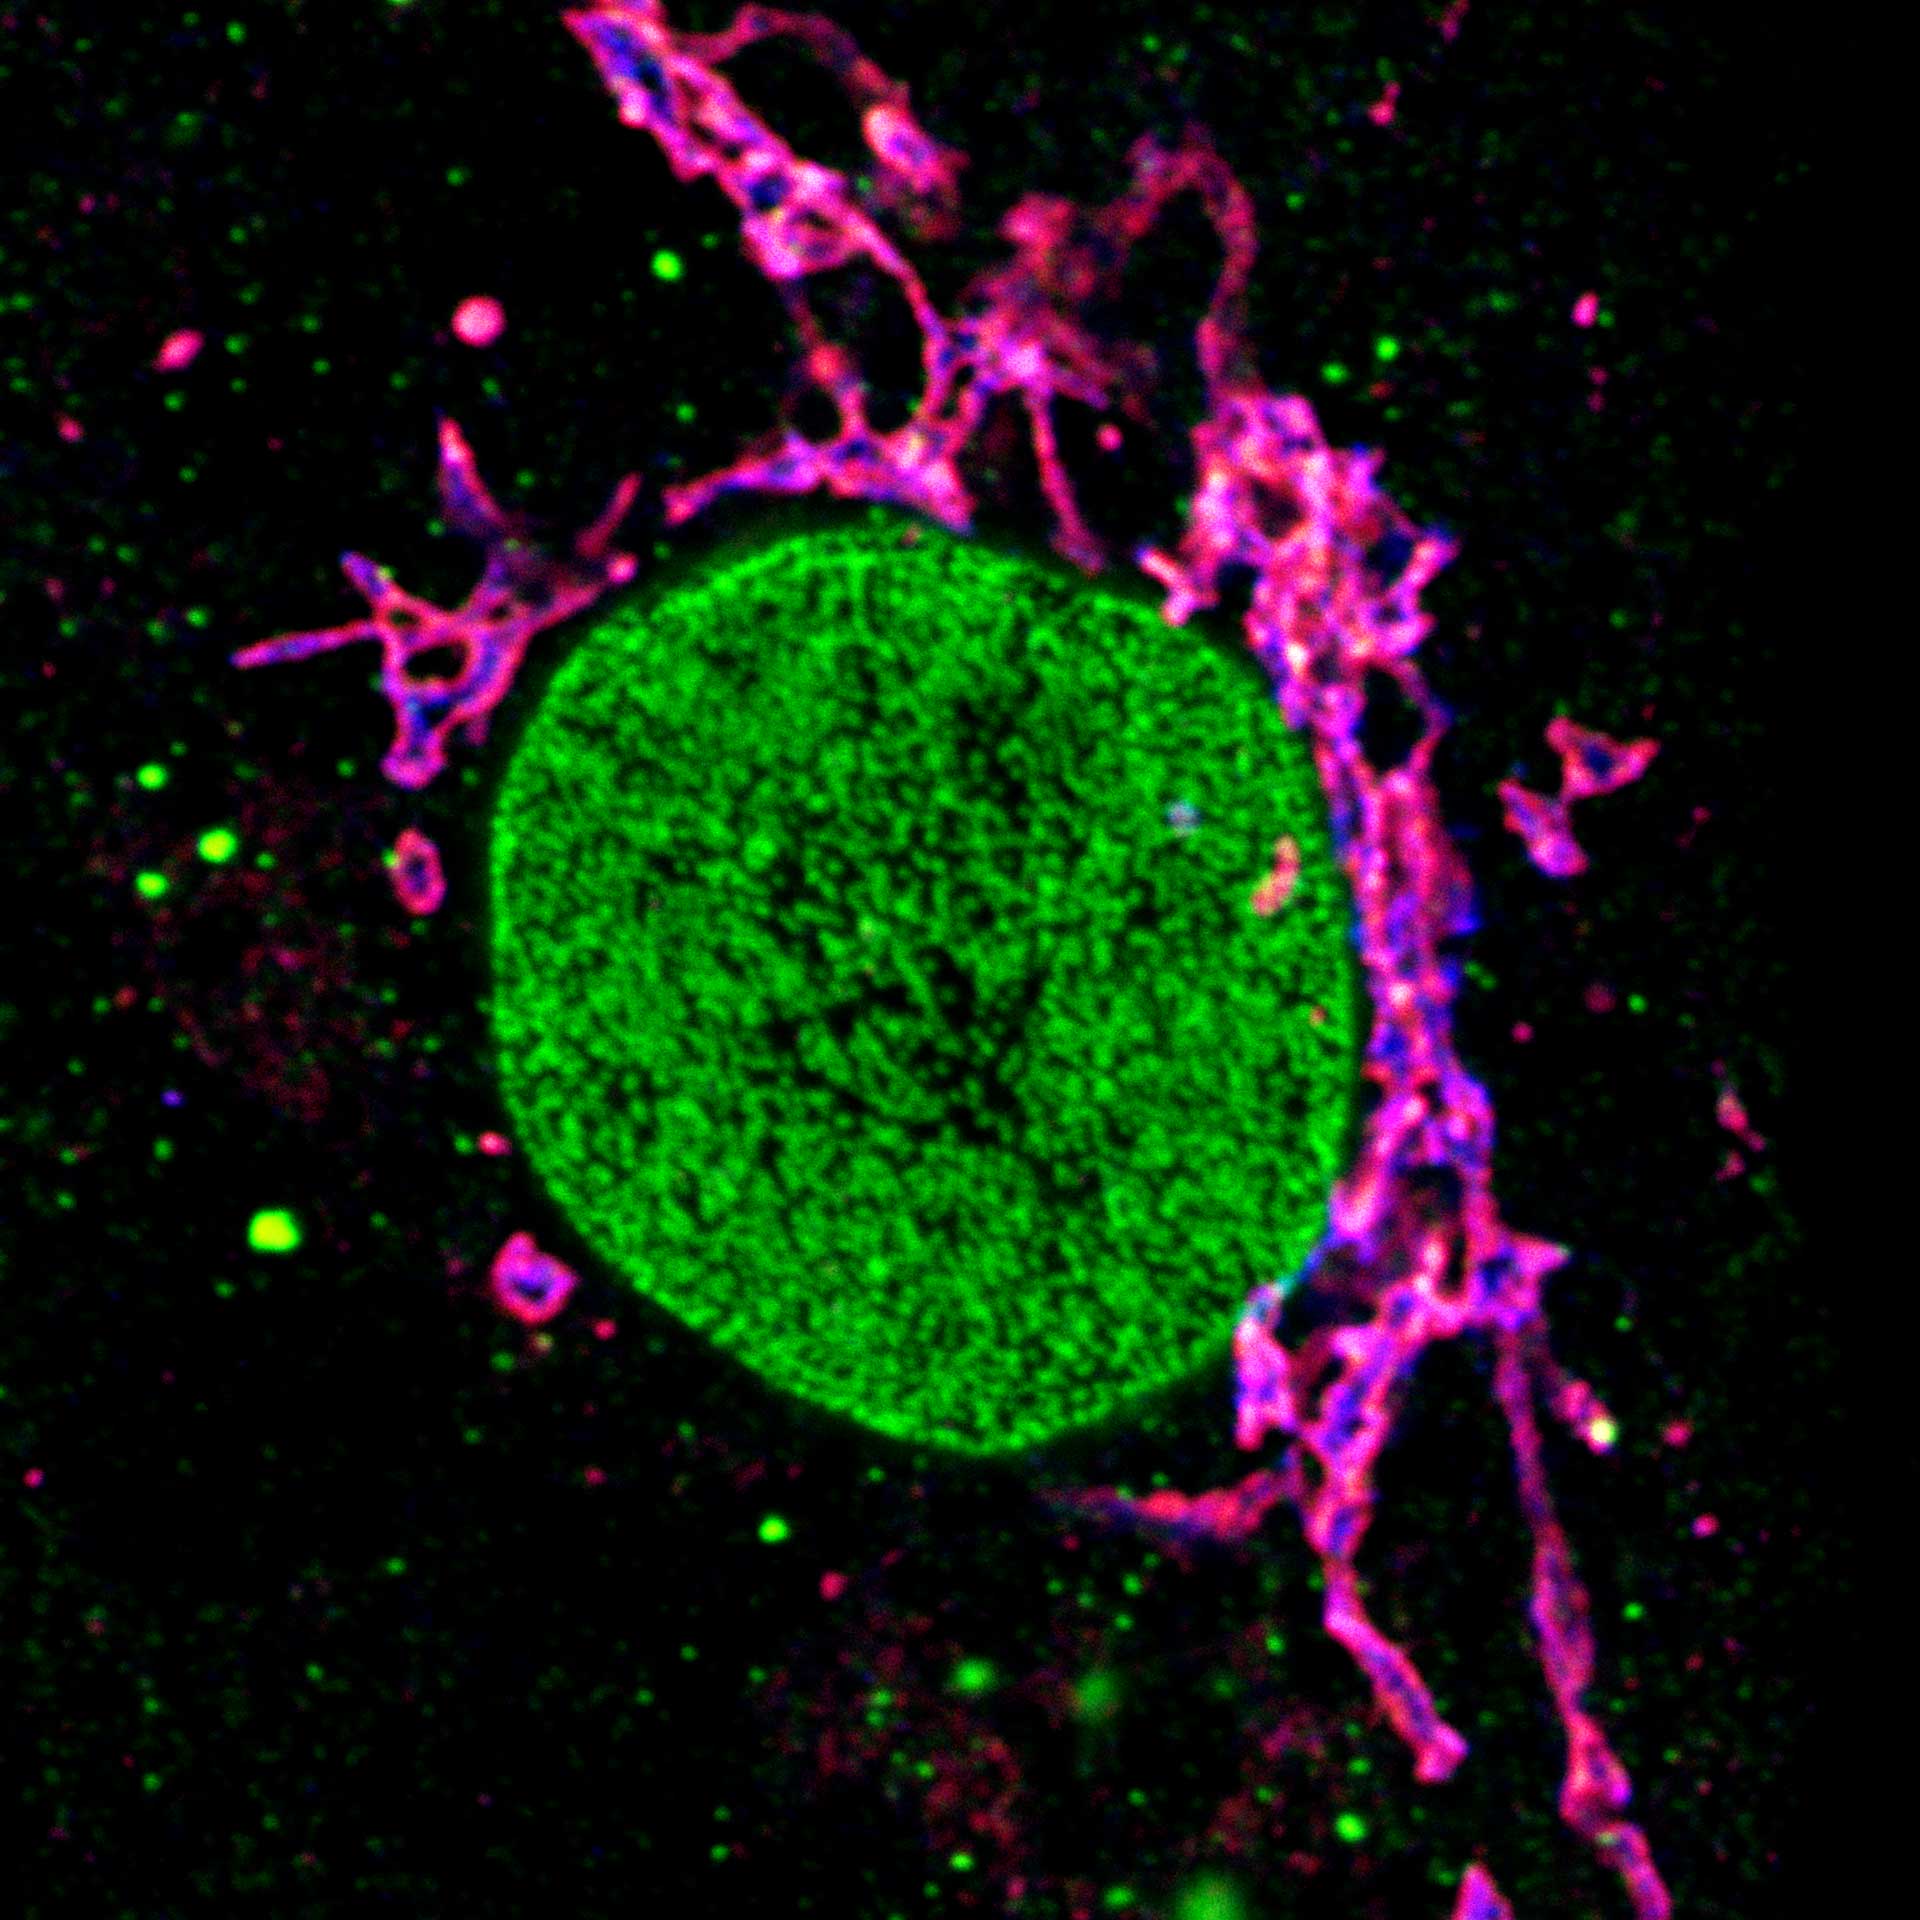
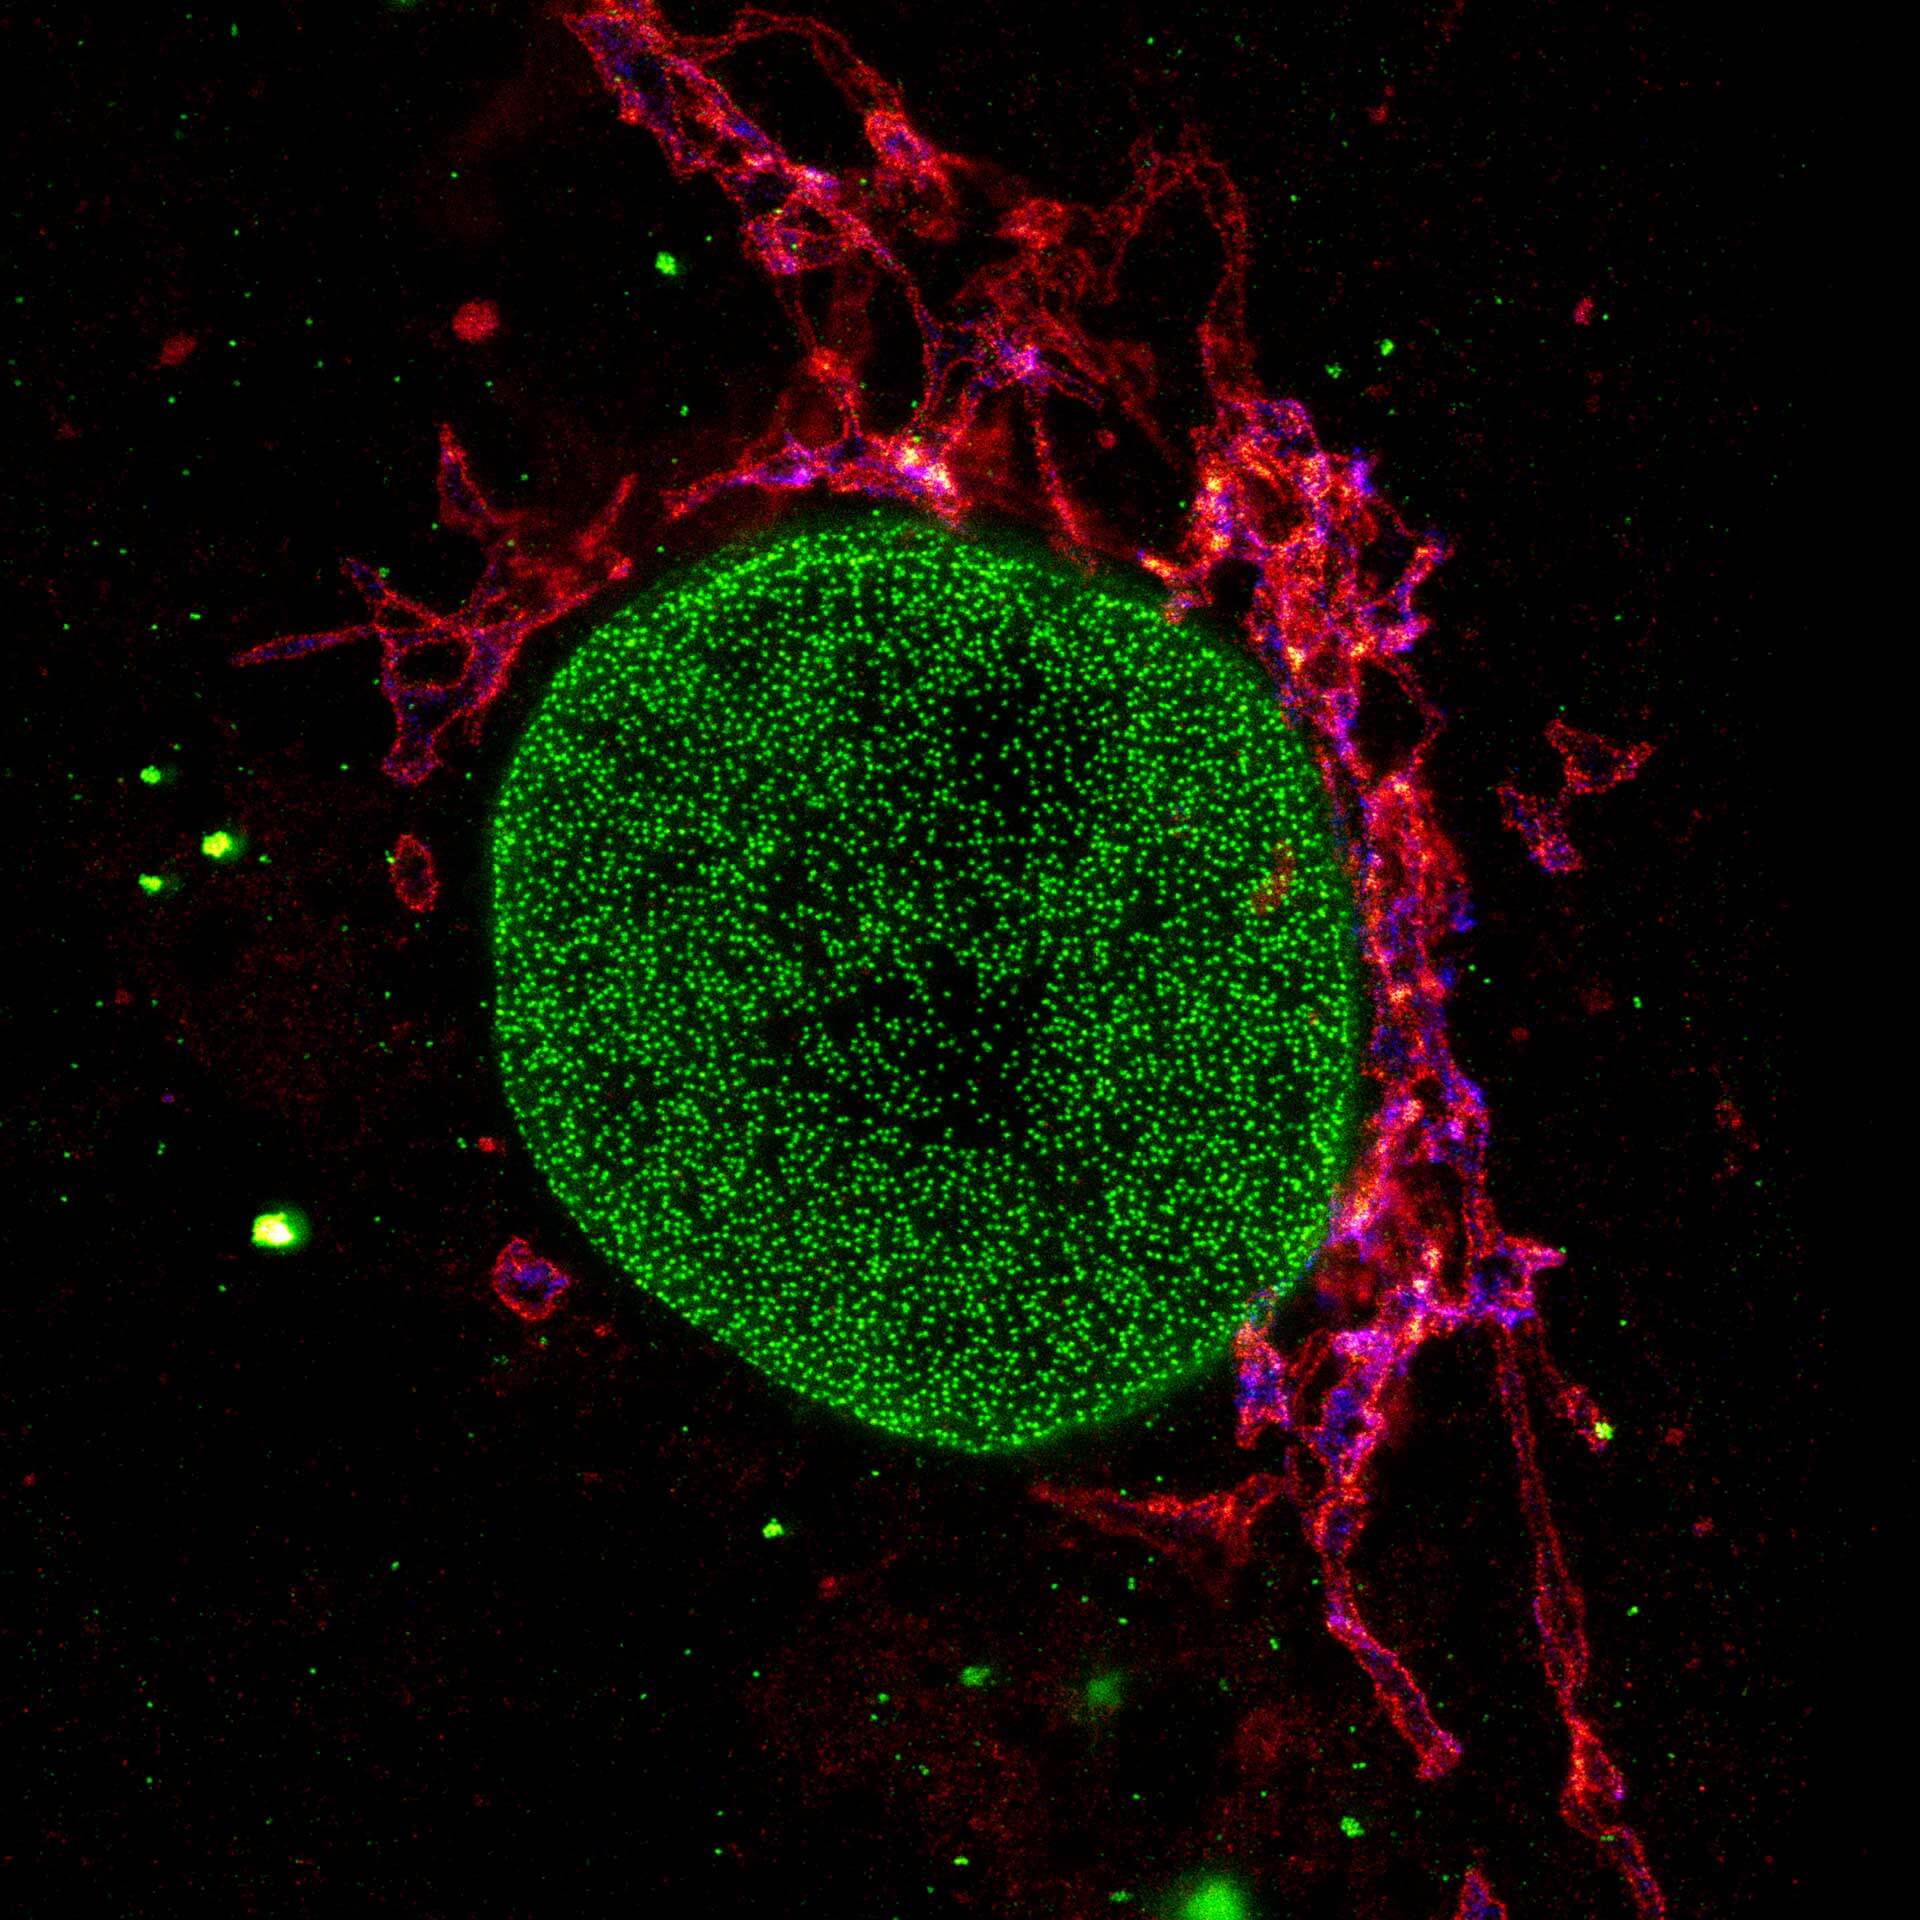
Three color STED and confocal image of a mammalian cultured cell immunostained for a nuclear pore protein in green and two golgi apparatus markers in red and blue.
abberior STAR RED highlights the golgi apparatus protein giantin (red) and abberior STAR ORANGE visualizes the cis-golgi protein GM130 (blue). NUP98 proteins were stained with abberior STAR GREEN (green).
Description
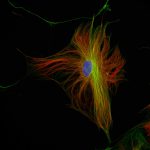
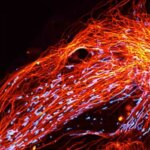
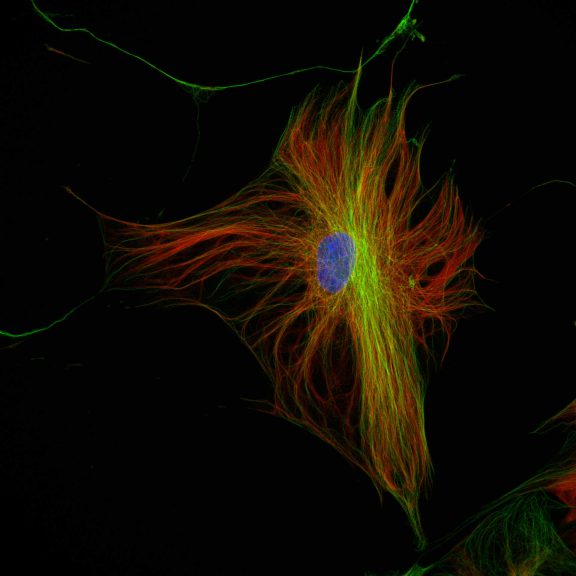
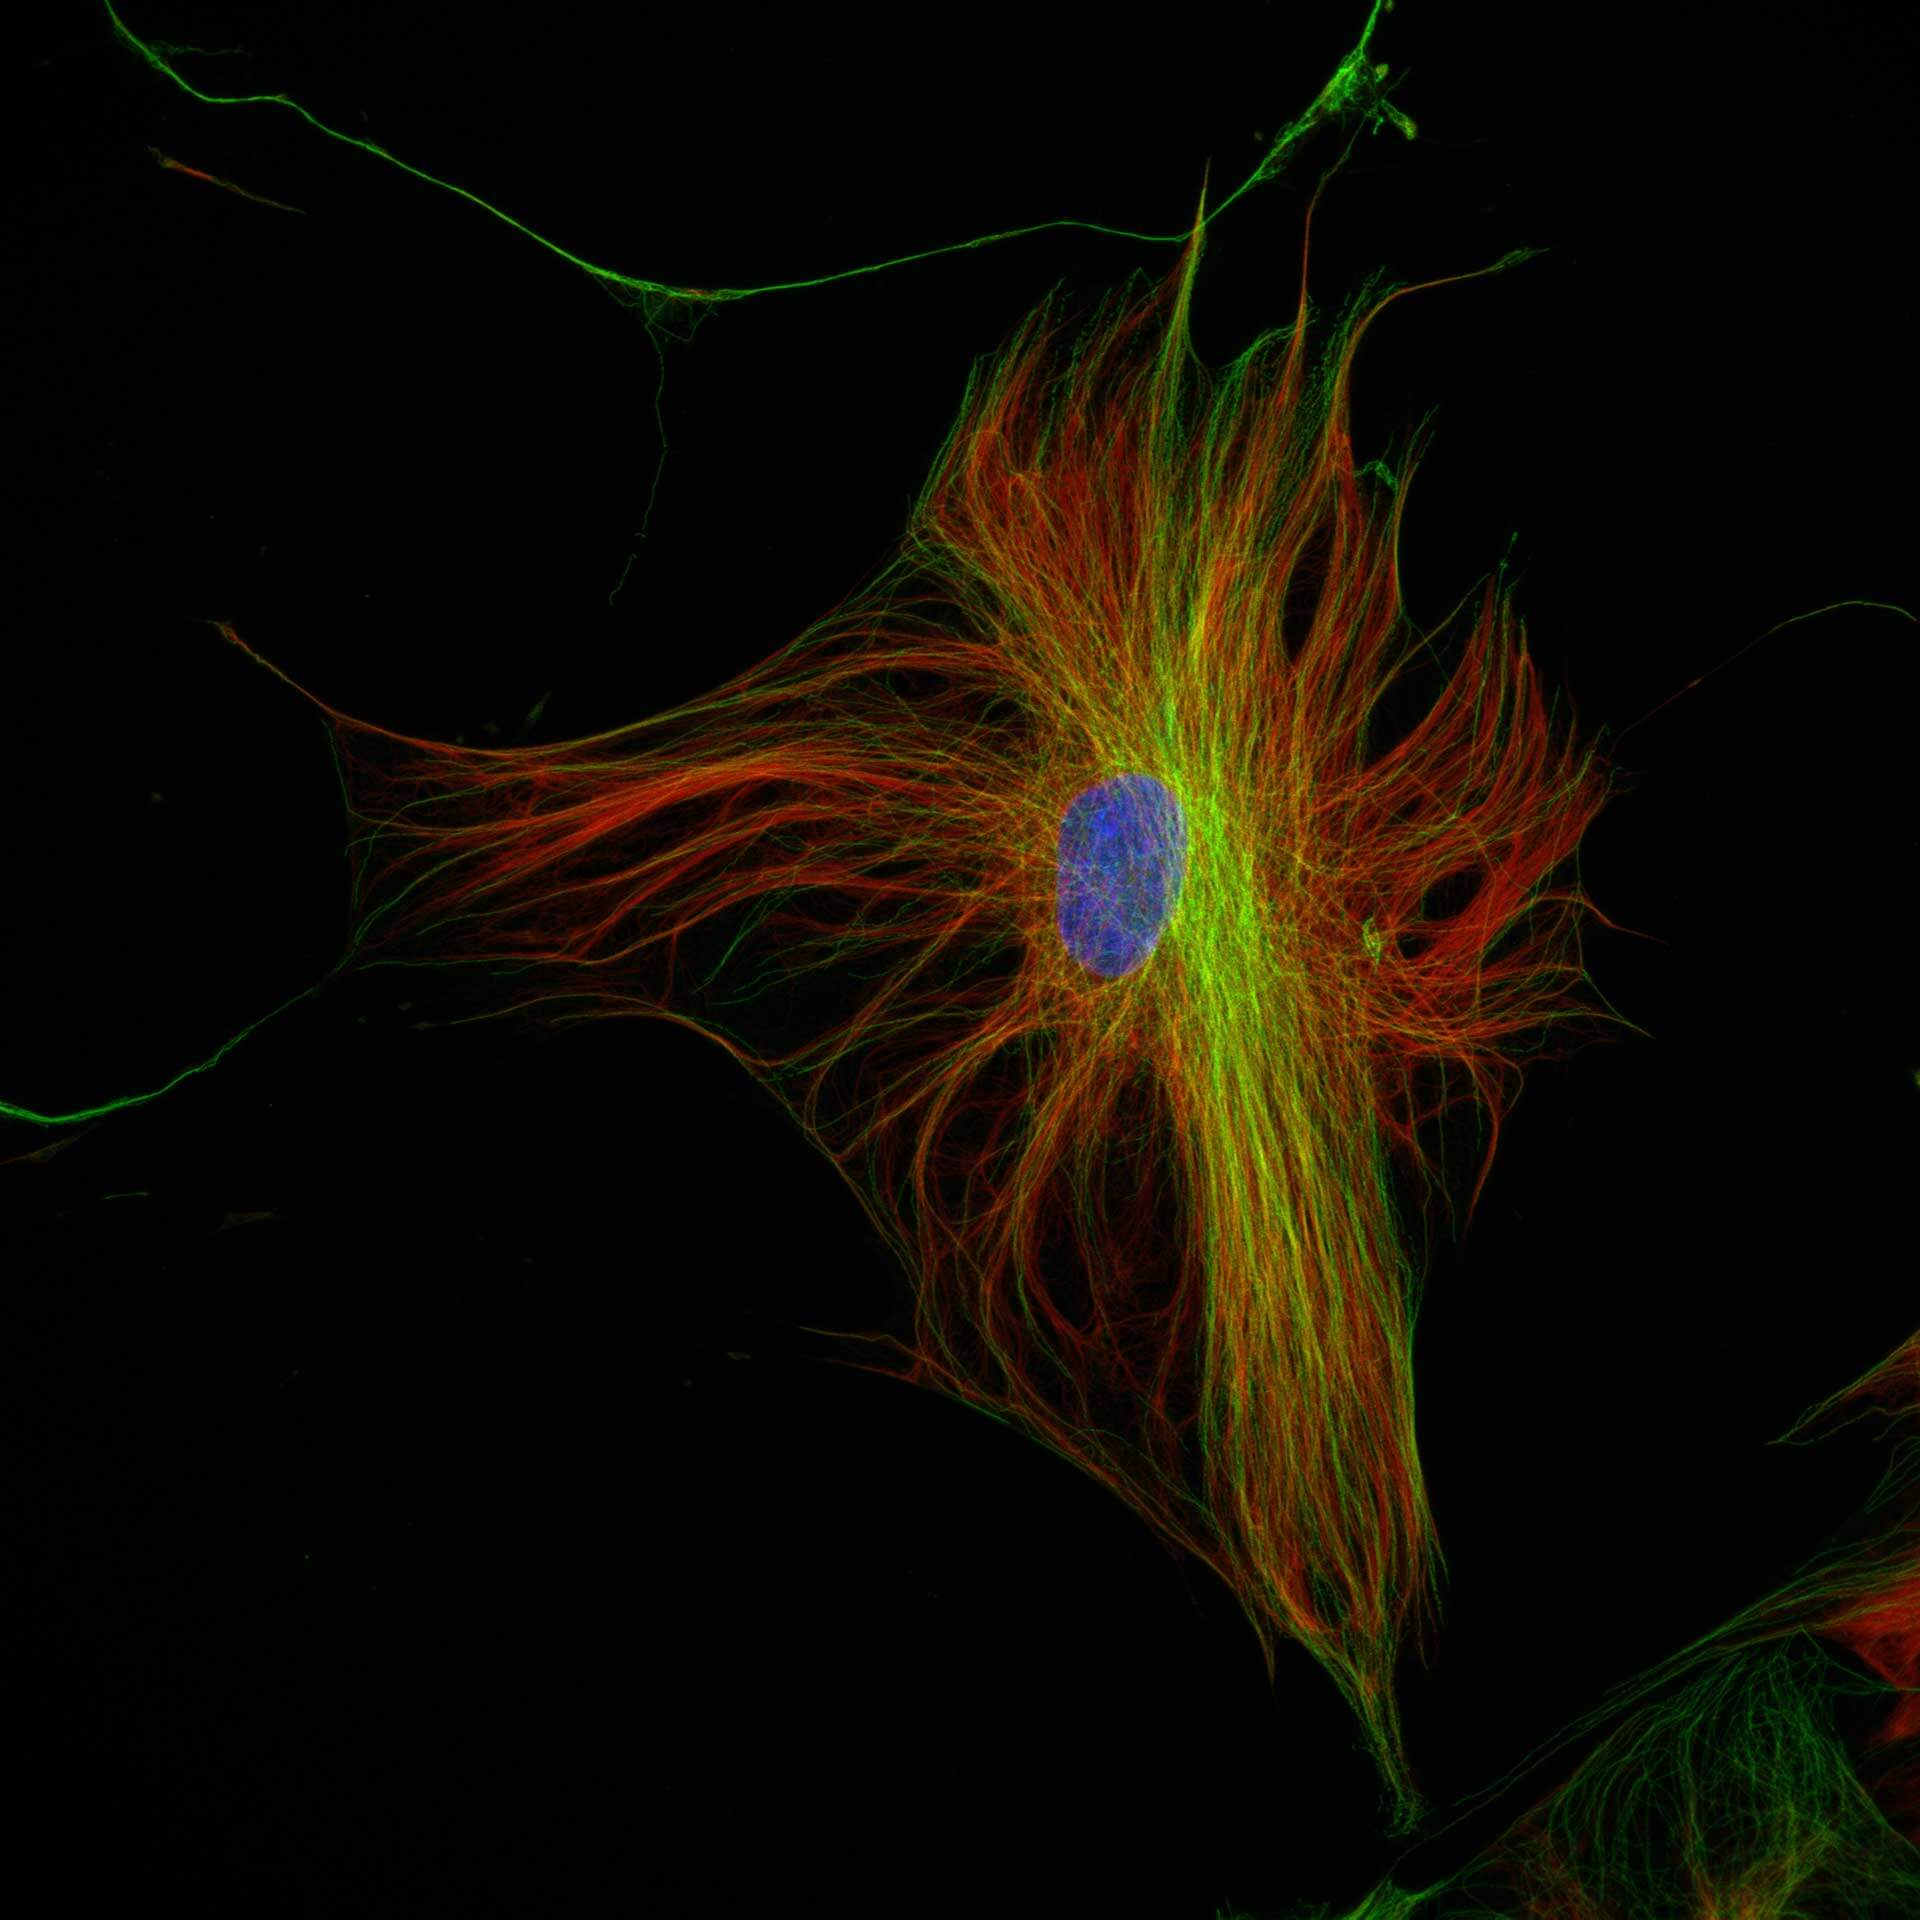
Three color confocal image of human fibroblast immunostained with abberior STAR 580 for vimentin (green) and with abberior STAR RED for tubulin (red).
DAPI was added to highlight the nucleus (blue).
Description
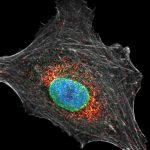
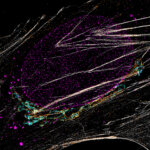
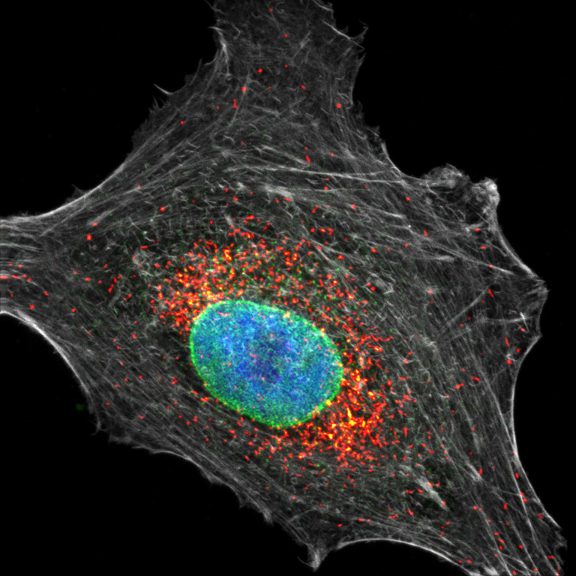
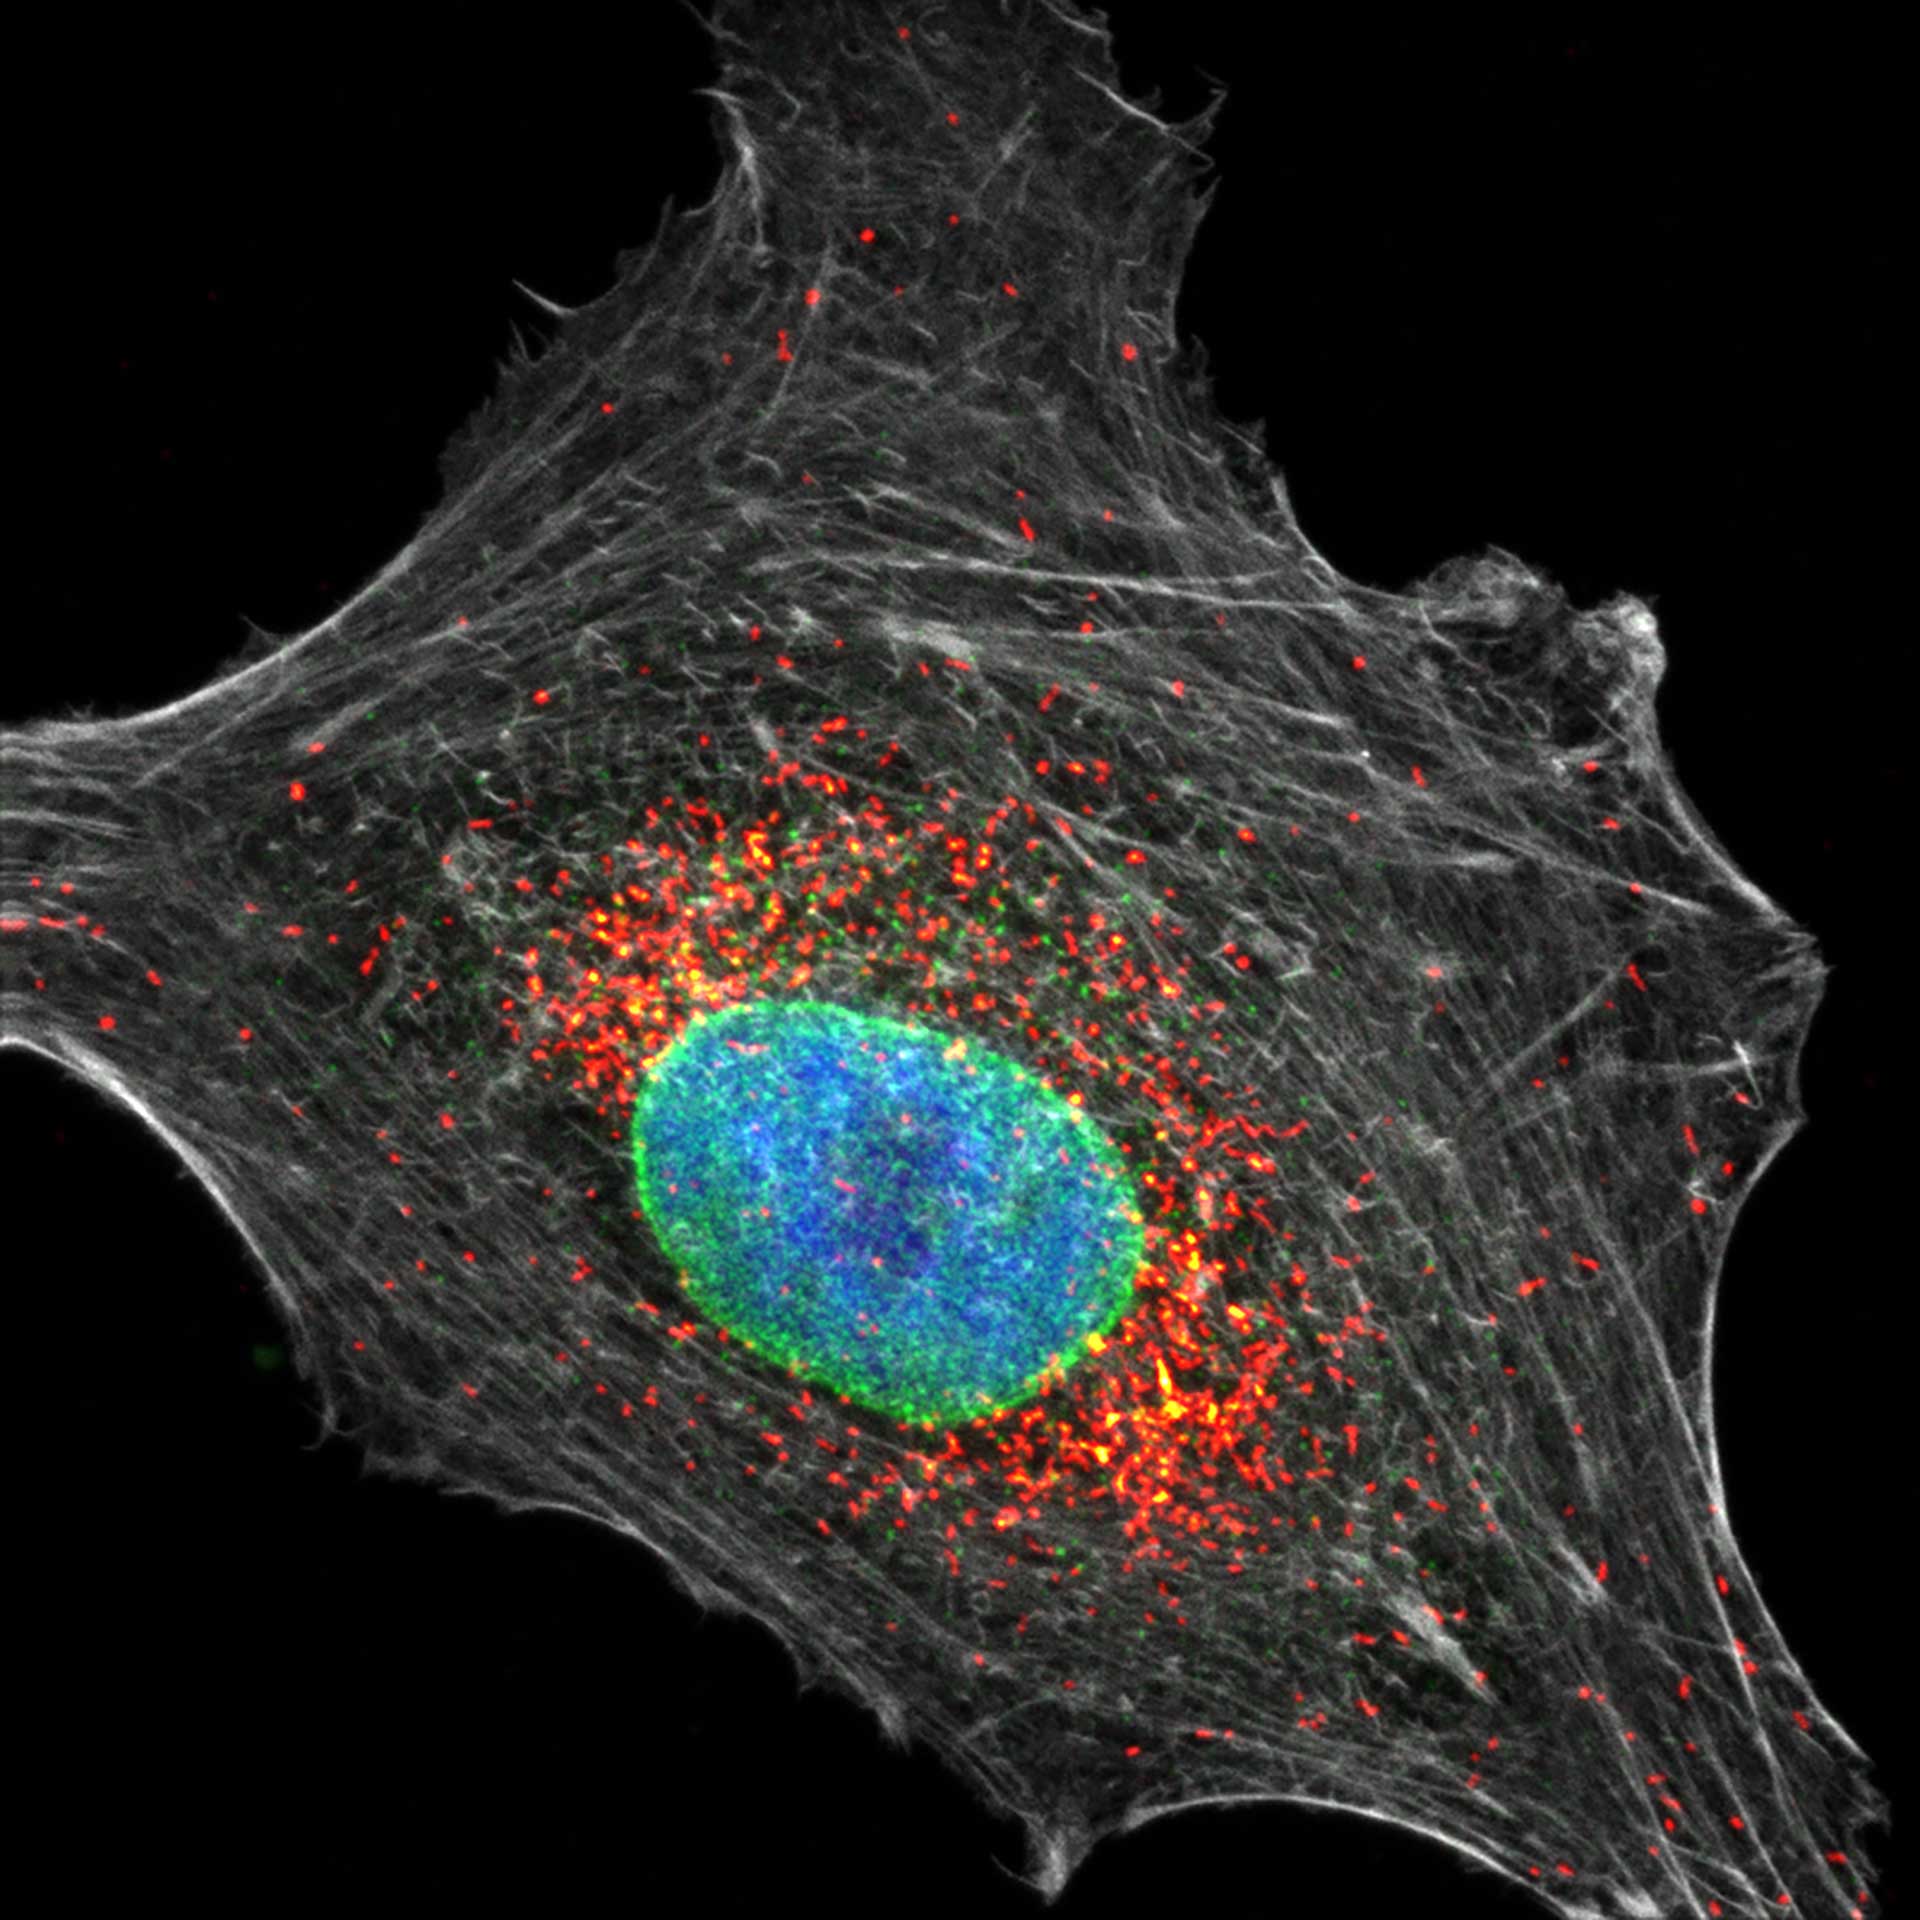
Four color confocal image of mammalian cultured cells. Peroxisomes were immunostained with abberior STAR RED (magenta) and nuclear pore proteins with abberior STAR 580 (green). F-actin fibers were highlighted with abberior STAR 488 phalloidin (gray).
The nucleus was visualized with DAPI (blue).
Description
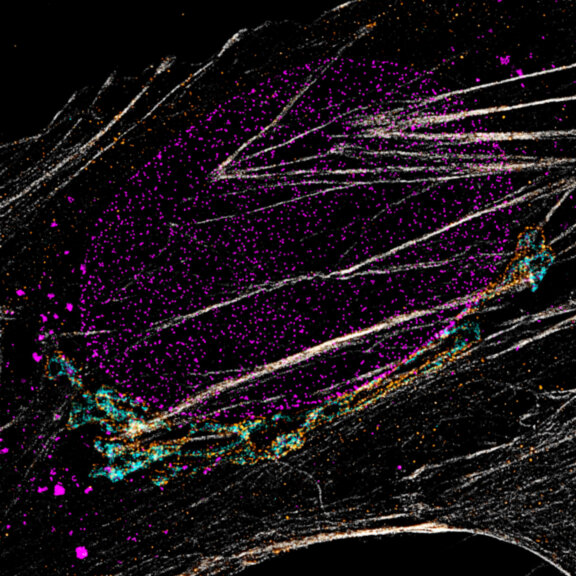
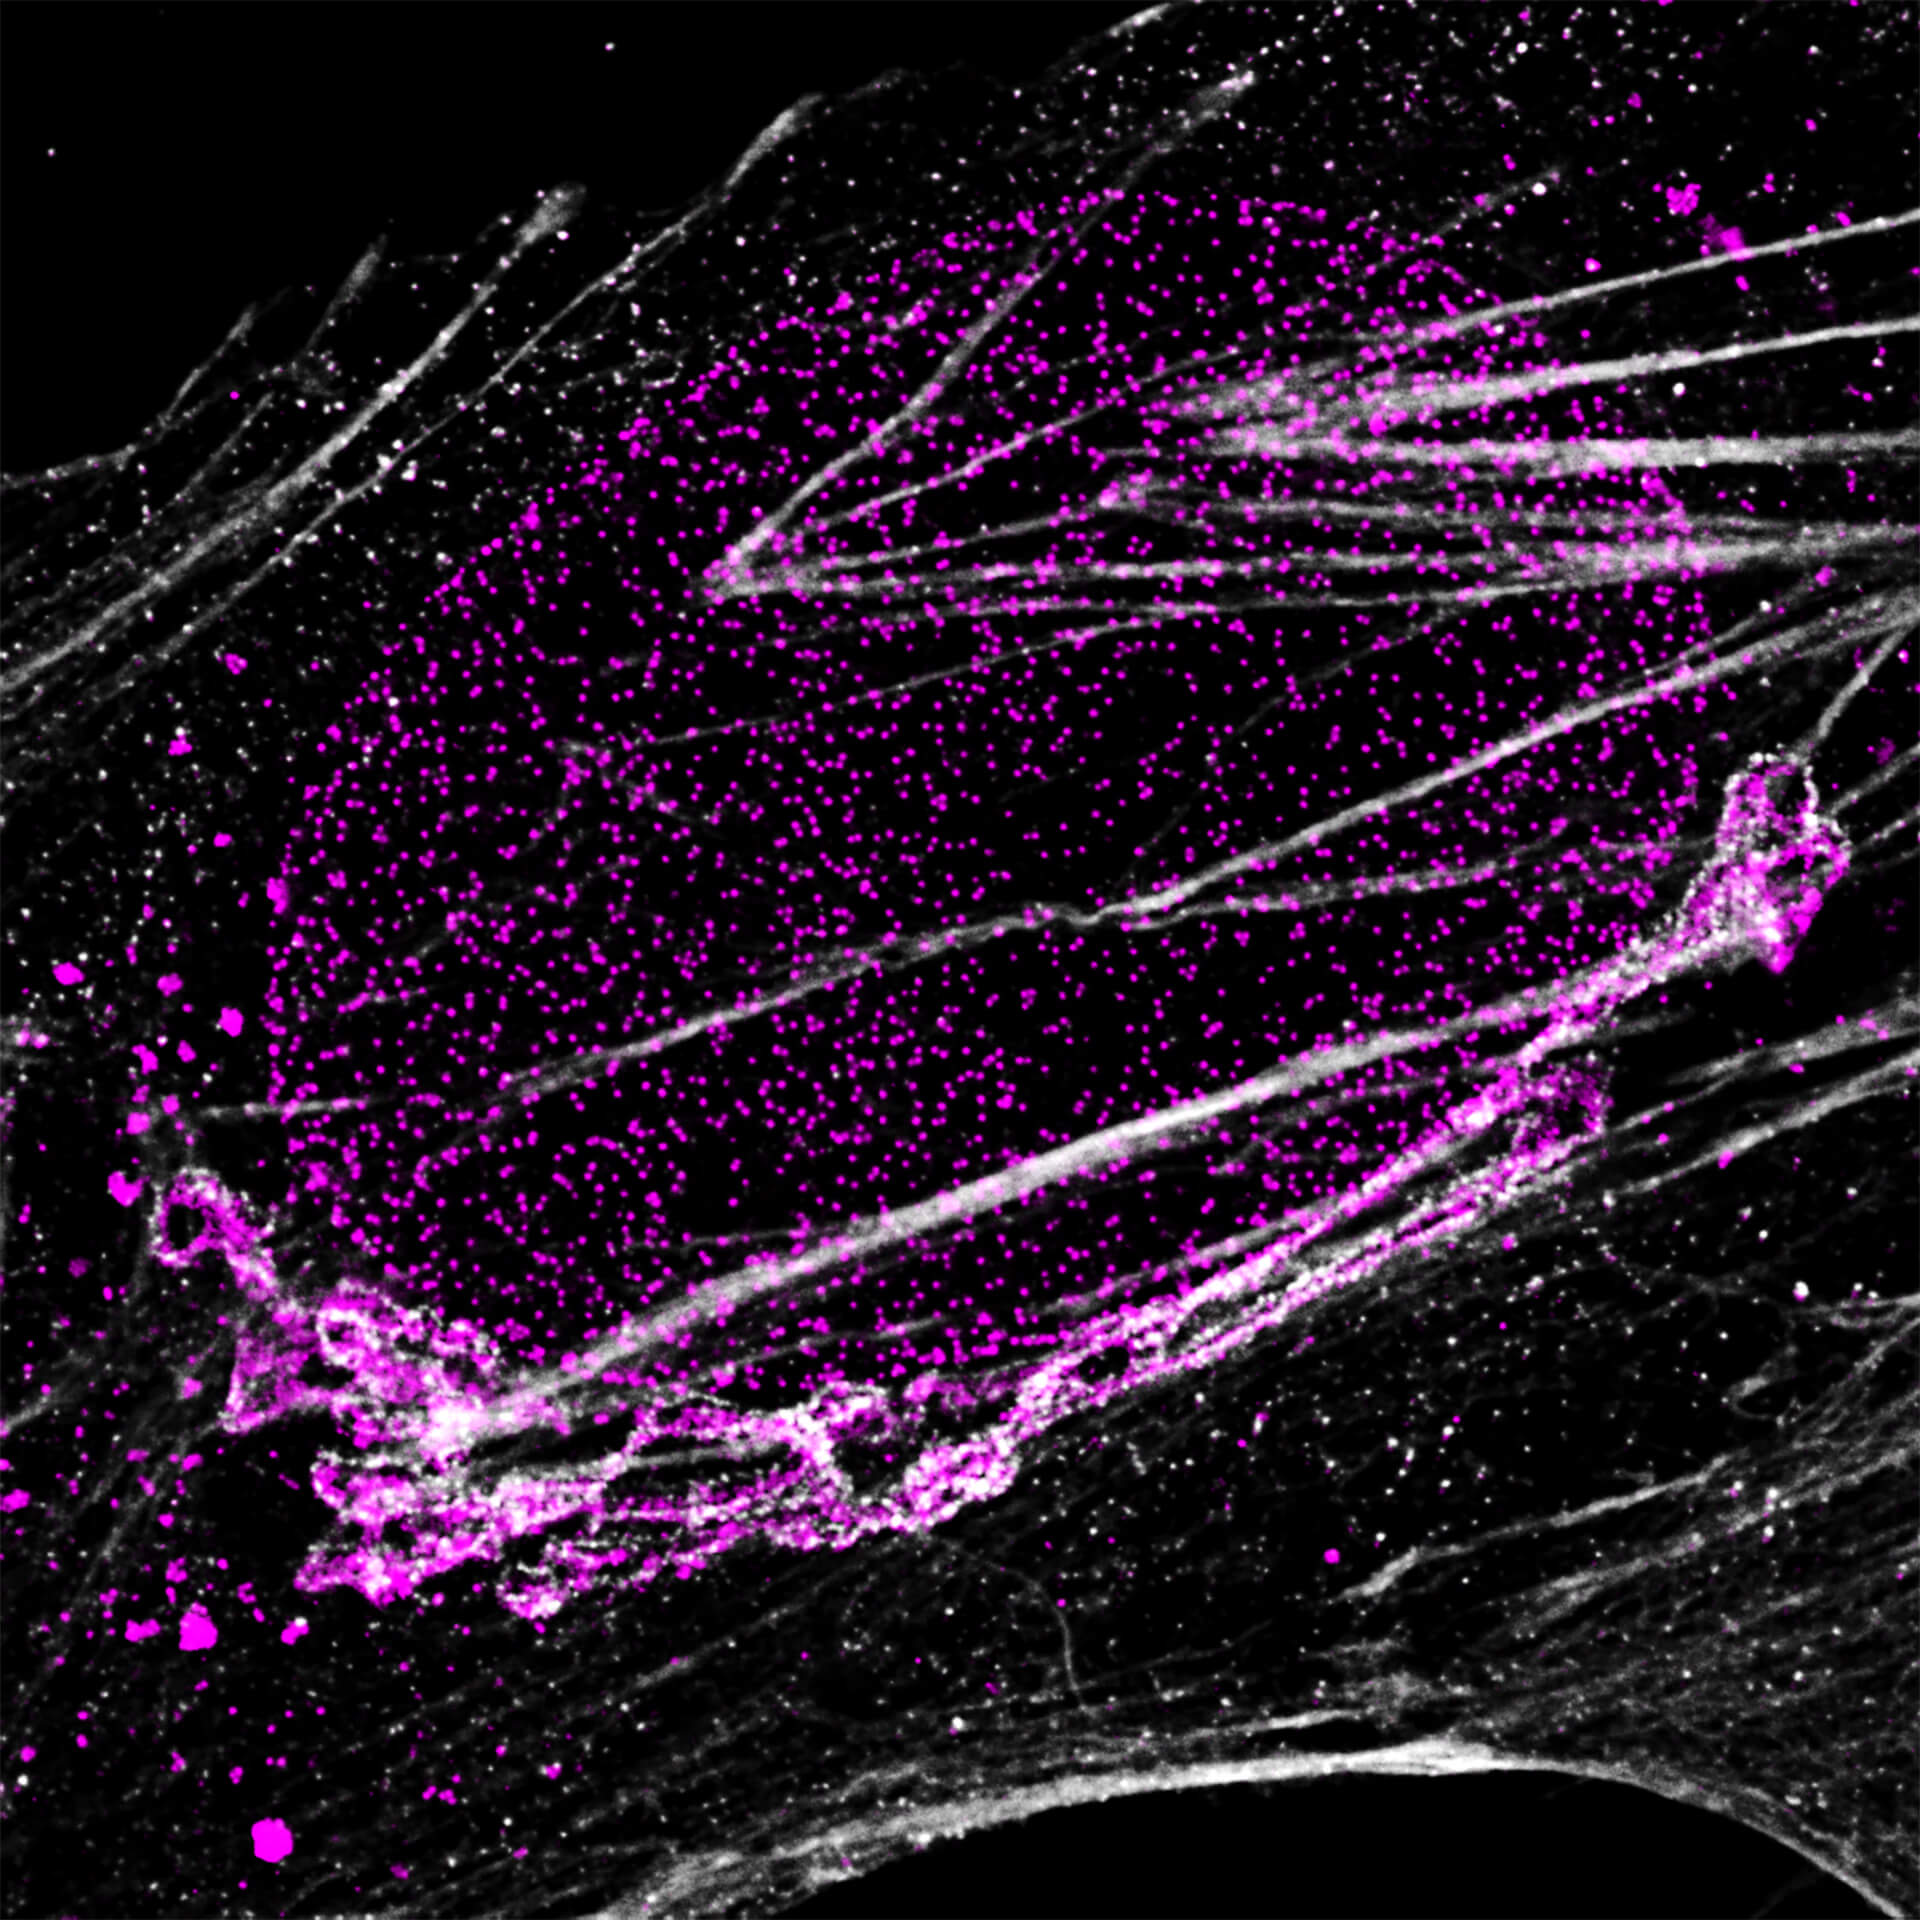
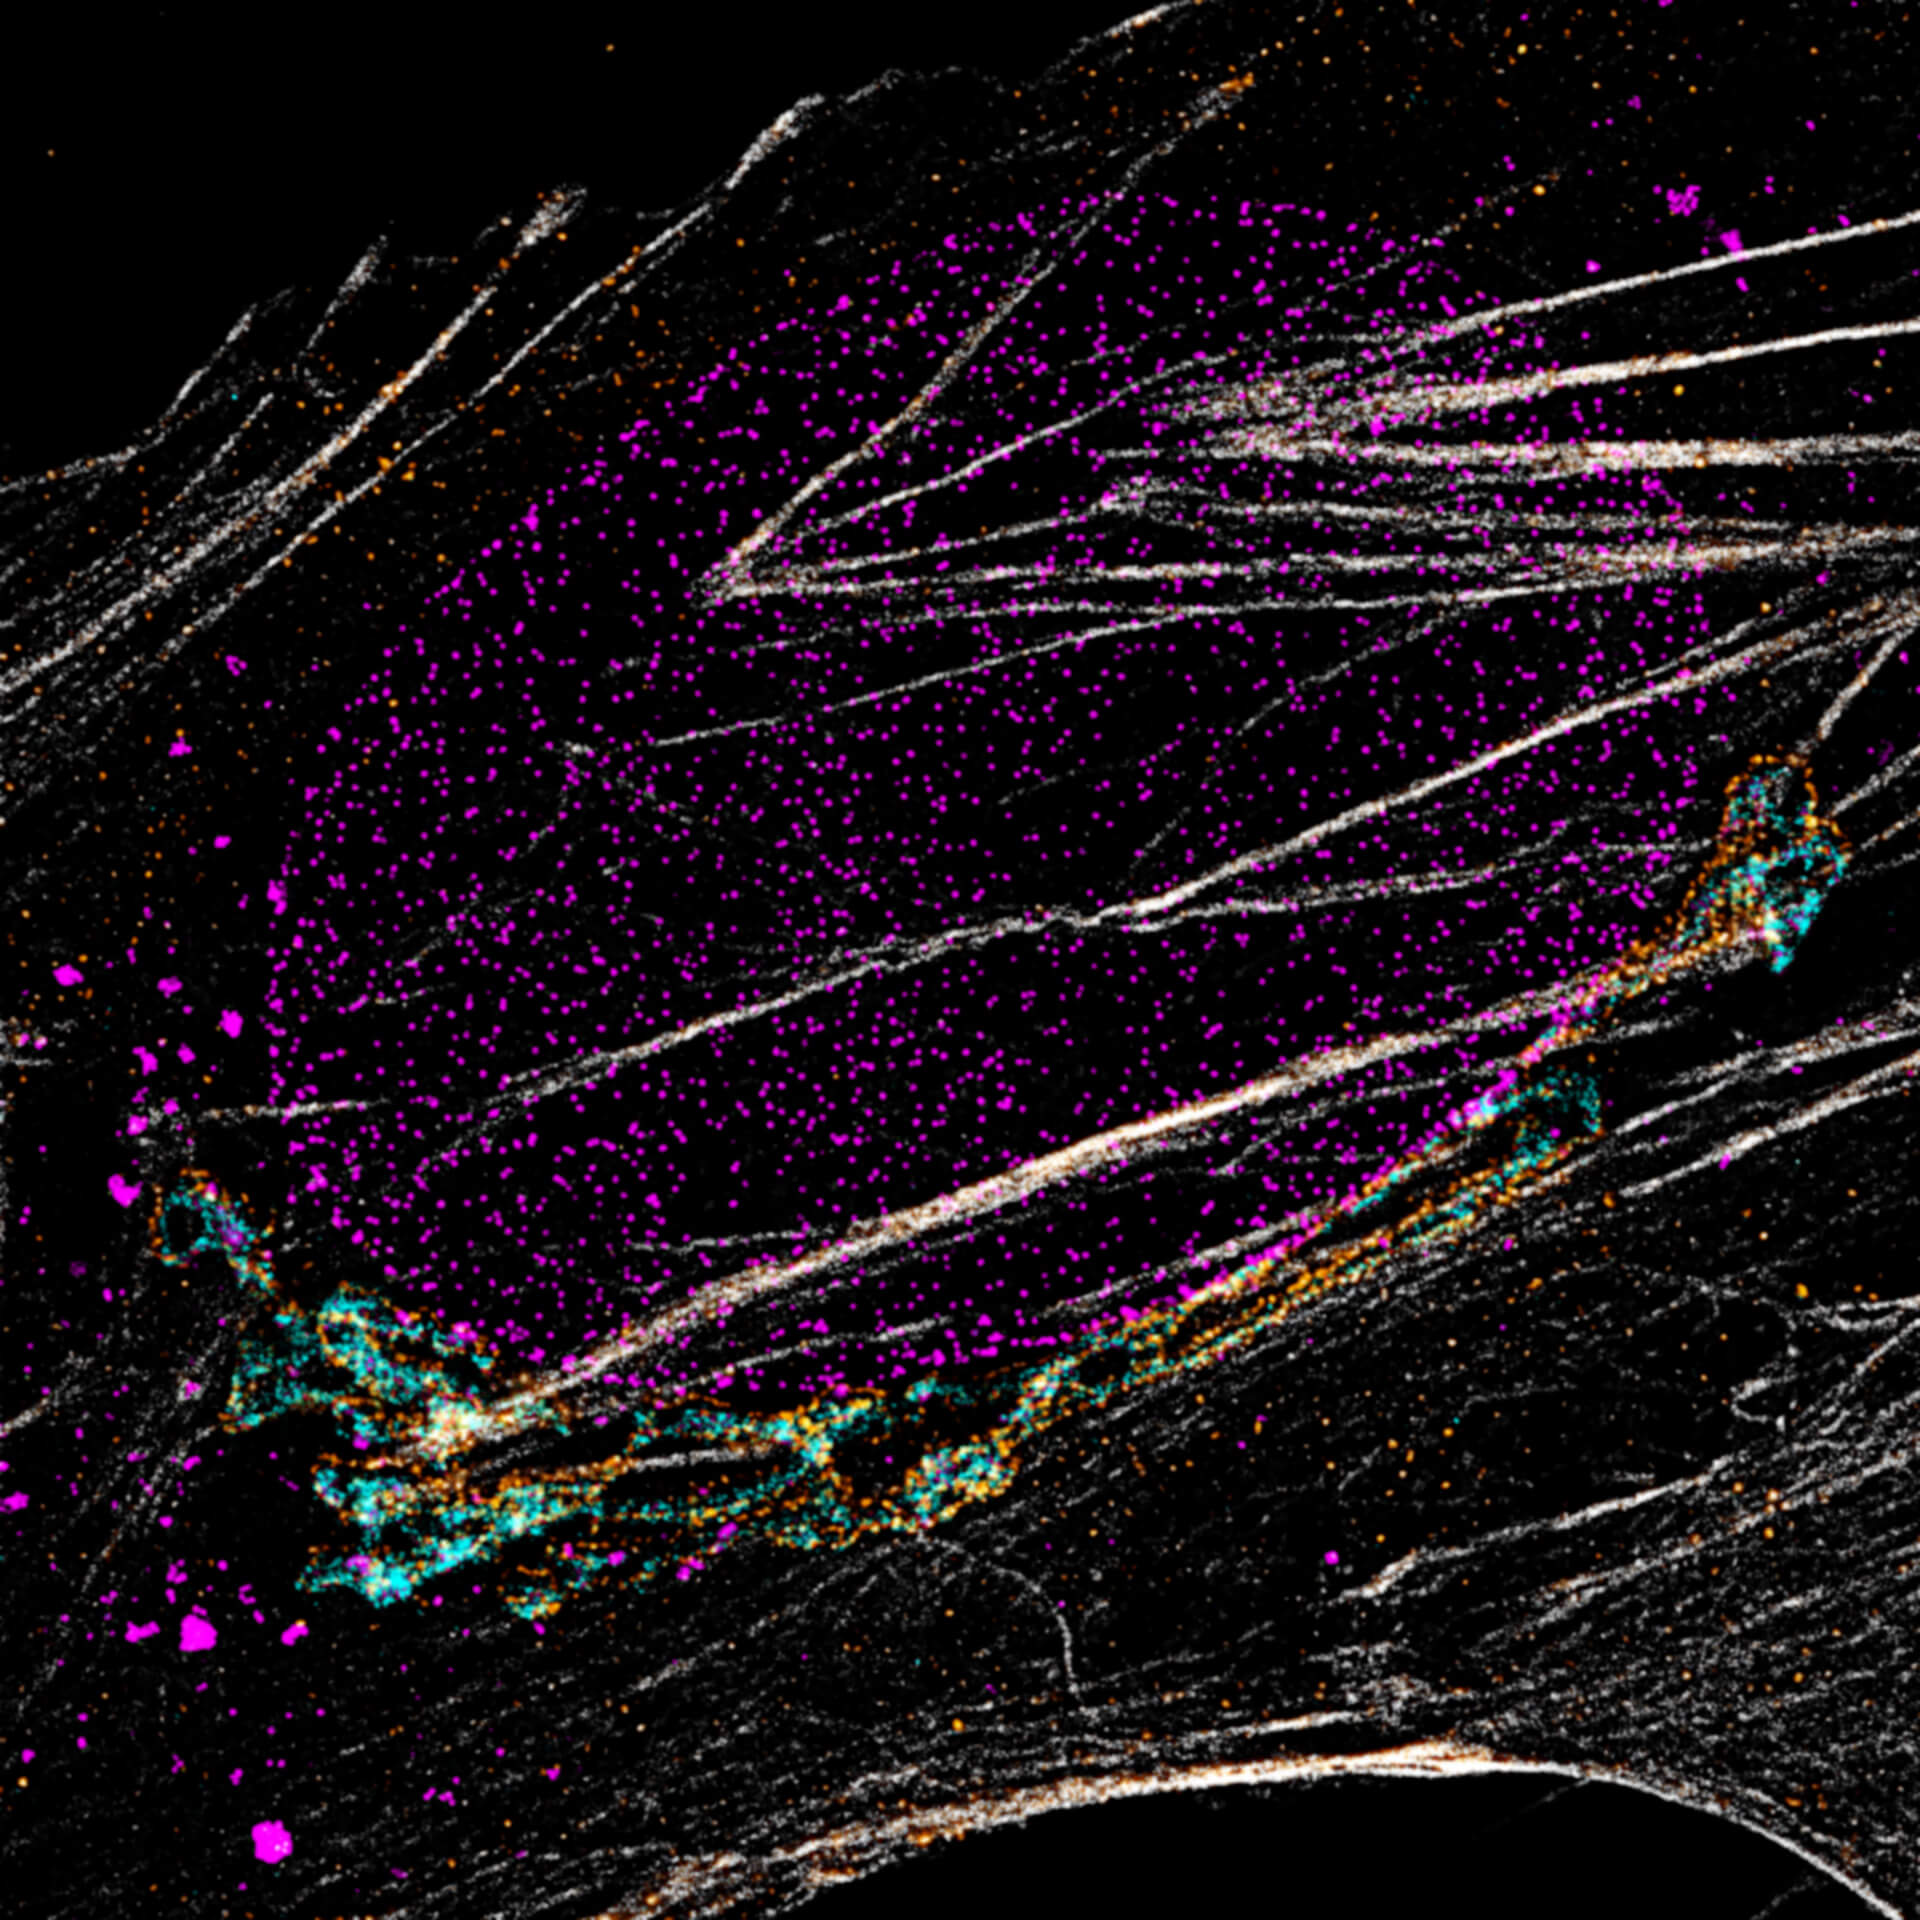
Four-color staining of fixed mammalian cells recorded with FACILITY showing nuclear pores (NUP98, STAR RED), Golgi membrane (GM130, STAR 635), Golgi medial rims (Giantin, STAR ORANGE) and actin (STAR 580 phalloidin). Shown left, just using spectral information, STAR RED and STAR 635 (magenta) cannot be separated, because of their similar excitation properties. The same goes for STAR ORANGE and STAR 580 (grey).
With the lifetime information collected by TIMEBOW, these dyes can be distinguished, turning an image with two recording channels into a four-color image. To achieve superresolution only one STED laser at 775 nm was used.
All utilized dyes are manufactured by abberior.
Modules:
Description
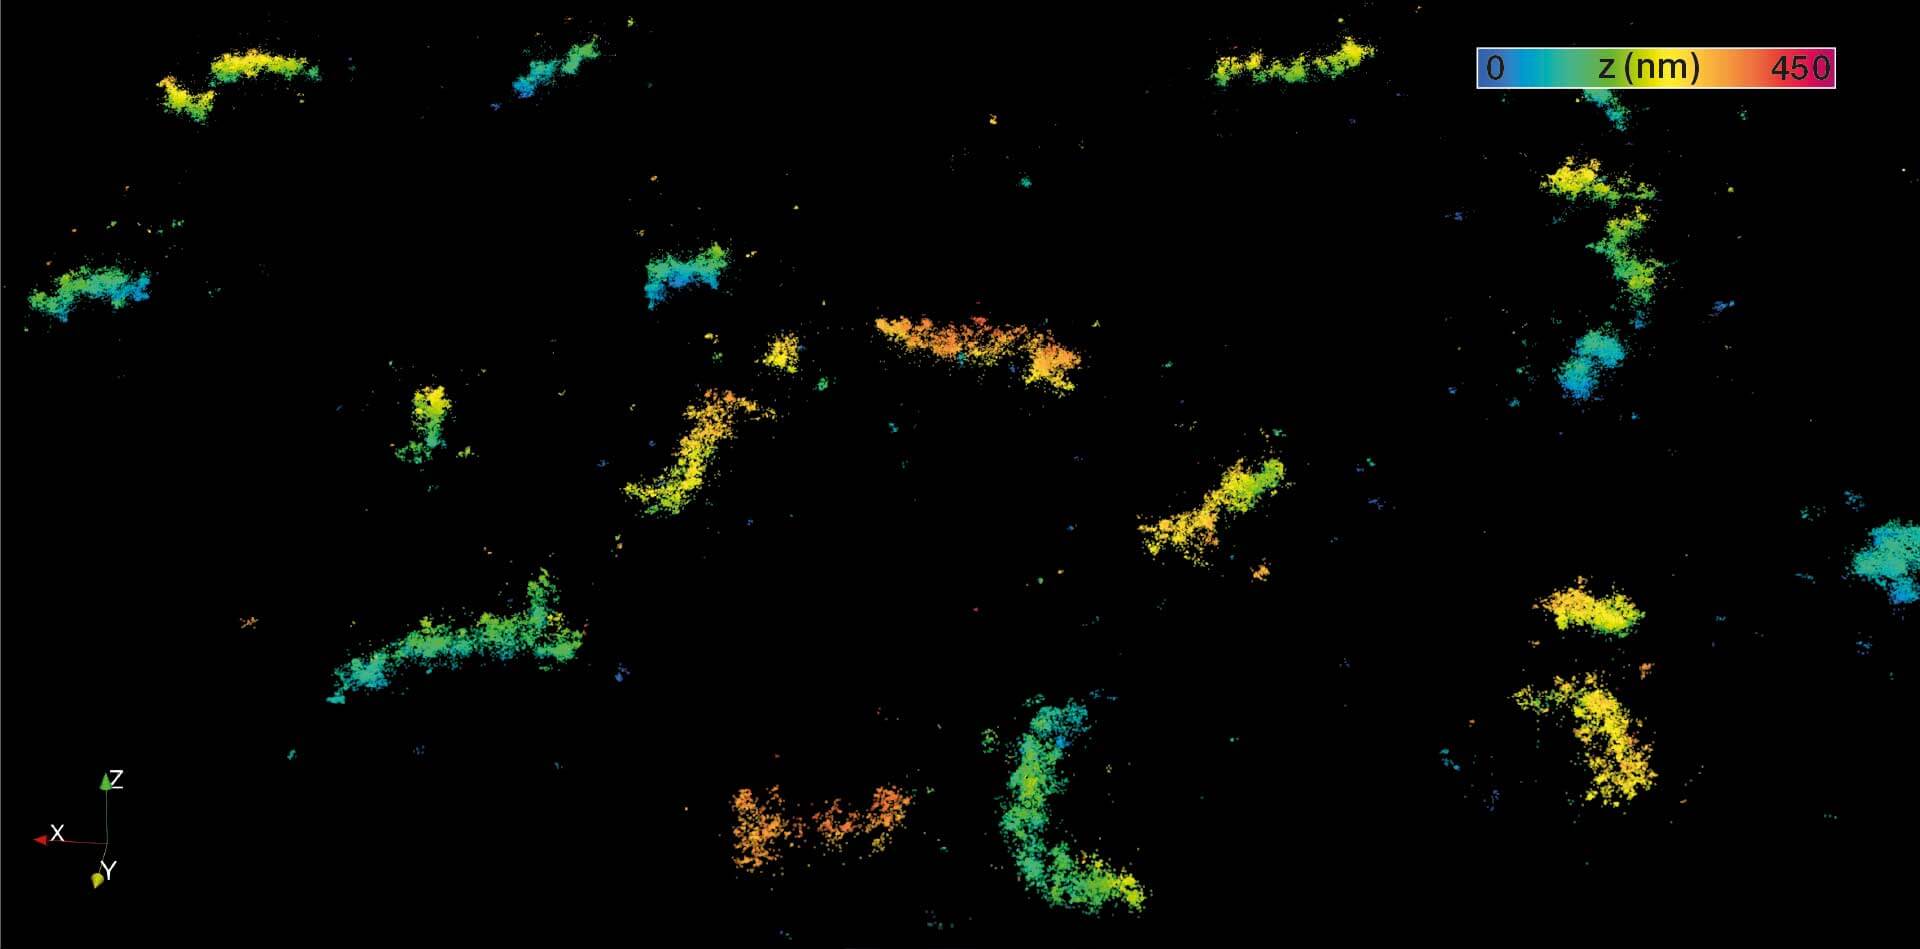
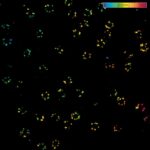
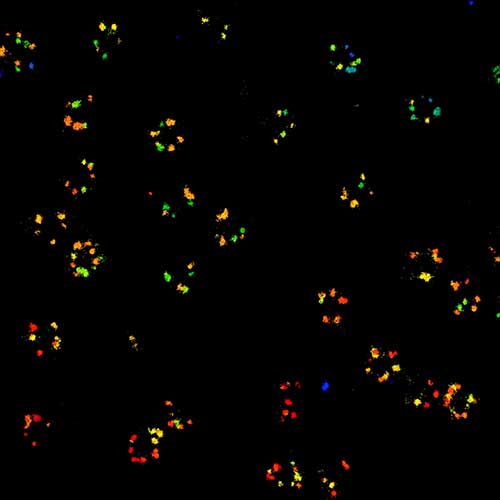
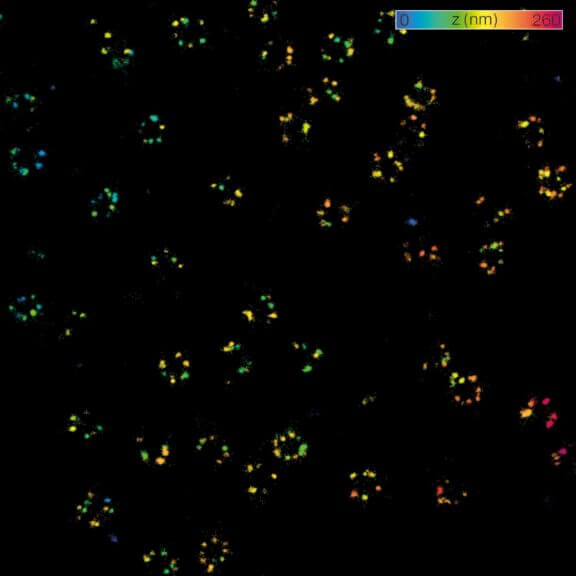
MINFLUX 3D nanoscopy of nuclear pore complex subunits. 3D MINFLUX facilitates 3D imaging at molecular scales. In the axial direction localization, we reach precisions of approx. 2.5 nm in raw localization data. Labeling of NUP96-SNAP was performed using SNAP-Alexa Fluor 647.
Description
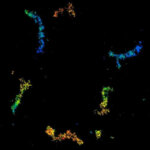
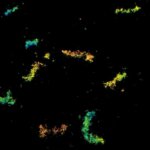
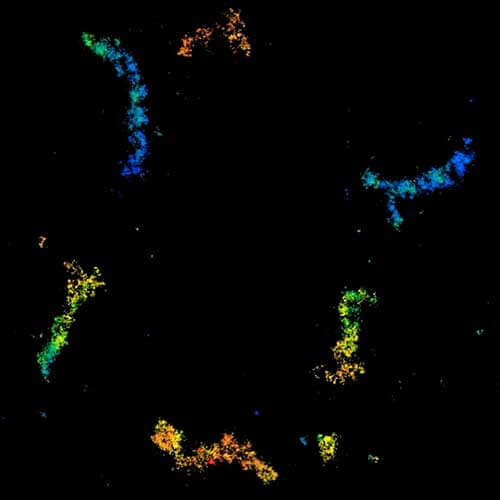
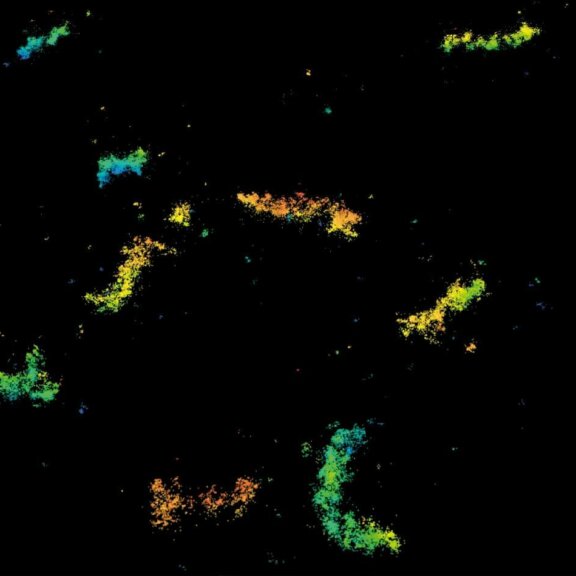
3D MINFLUX imaging of the peroxisomal membrane protein PMP70 labelled with abberior FLUX 647 in fixed mammalian cells using indirect immunofluorescence. 3D MINFLUX allows visualizing the shape of peroxisomes in all directions.
Description
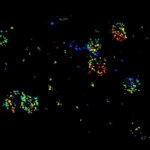
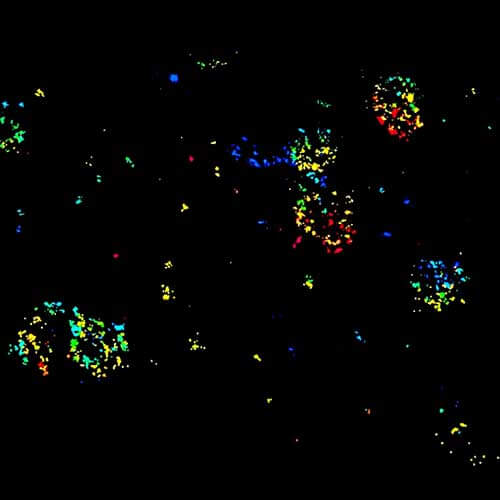
MINFLUX 3D imaging of Clathrin coated vesicles and Clathrin coated pits. Labeling was performed using clathrin light chain-SNAP together with SNAP-Alexa Fluor 647.
Description
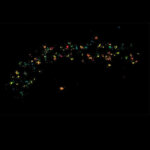
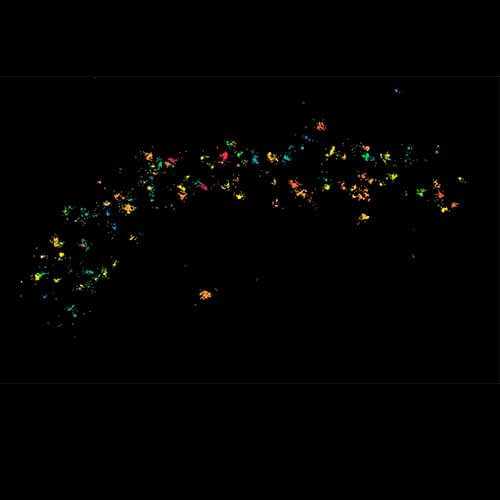
MINFLUX image of the mitochondrial import receptor Tom20 labeled with Alexa Fluor 647 in fixed mammalian cells using indirect immunolabeling. Please note that Tom20 is only localized at the mitochondrial surface.
Description
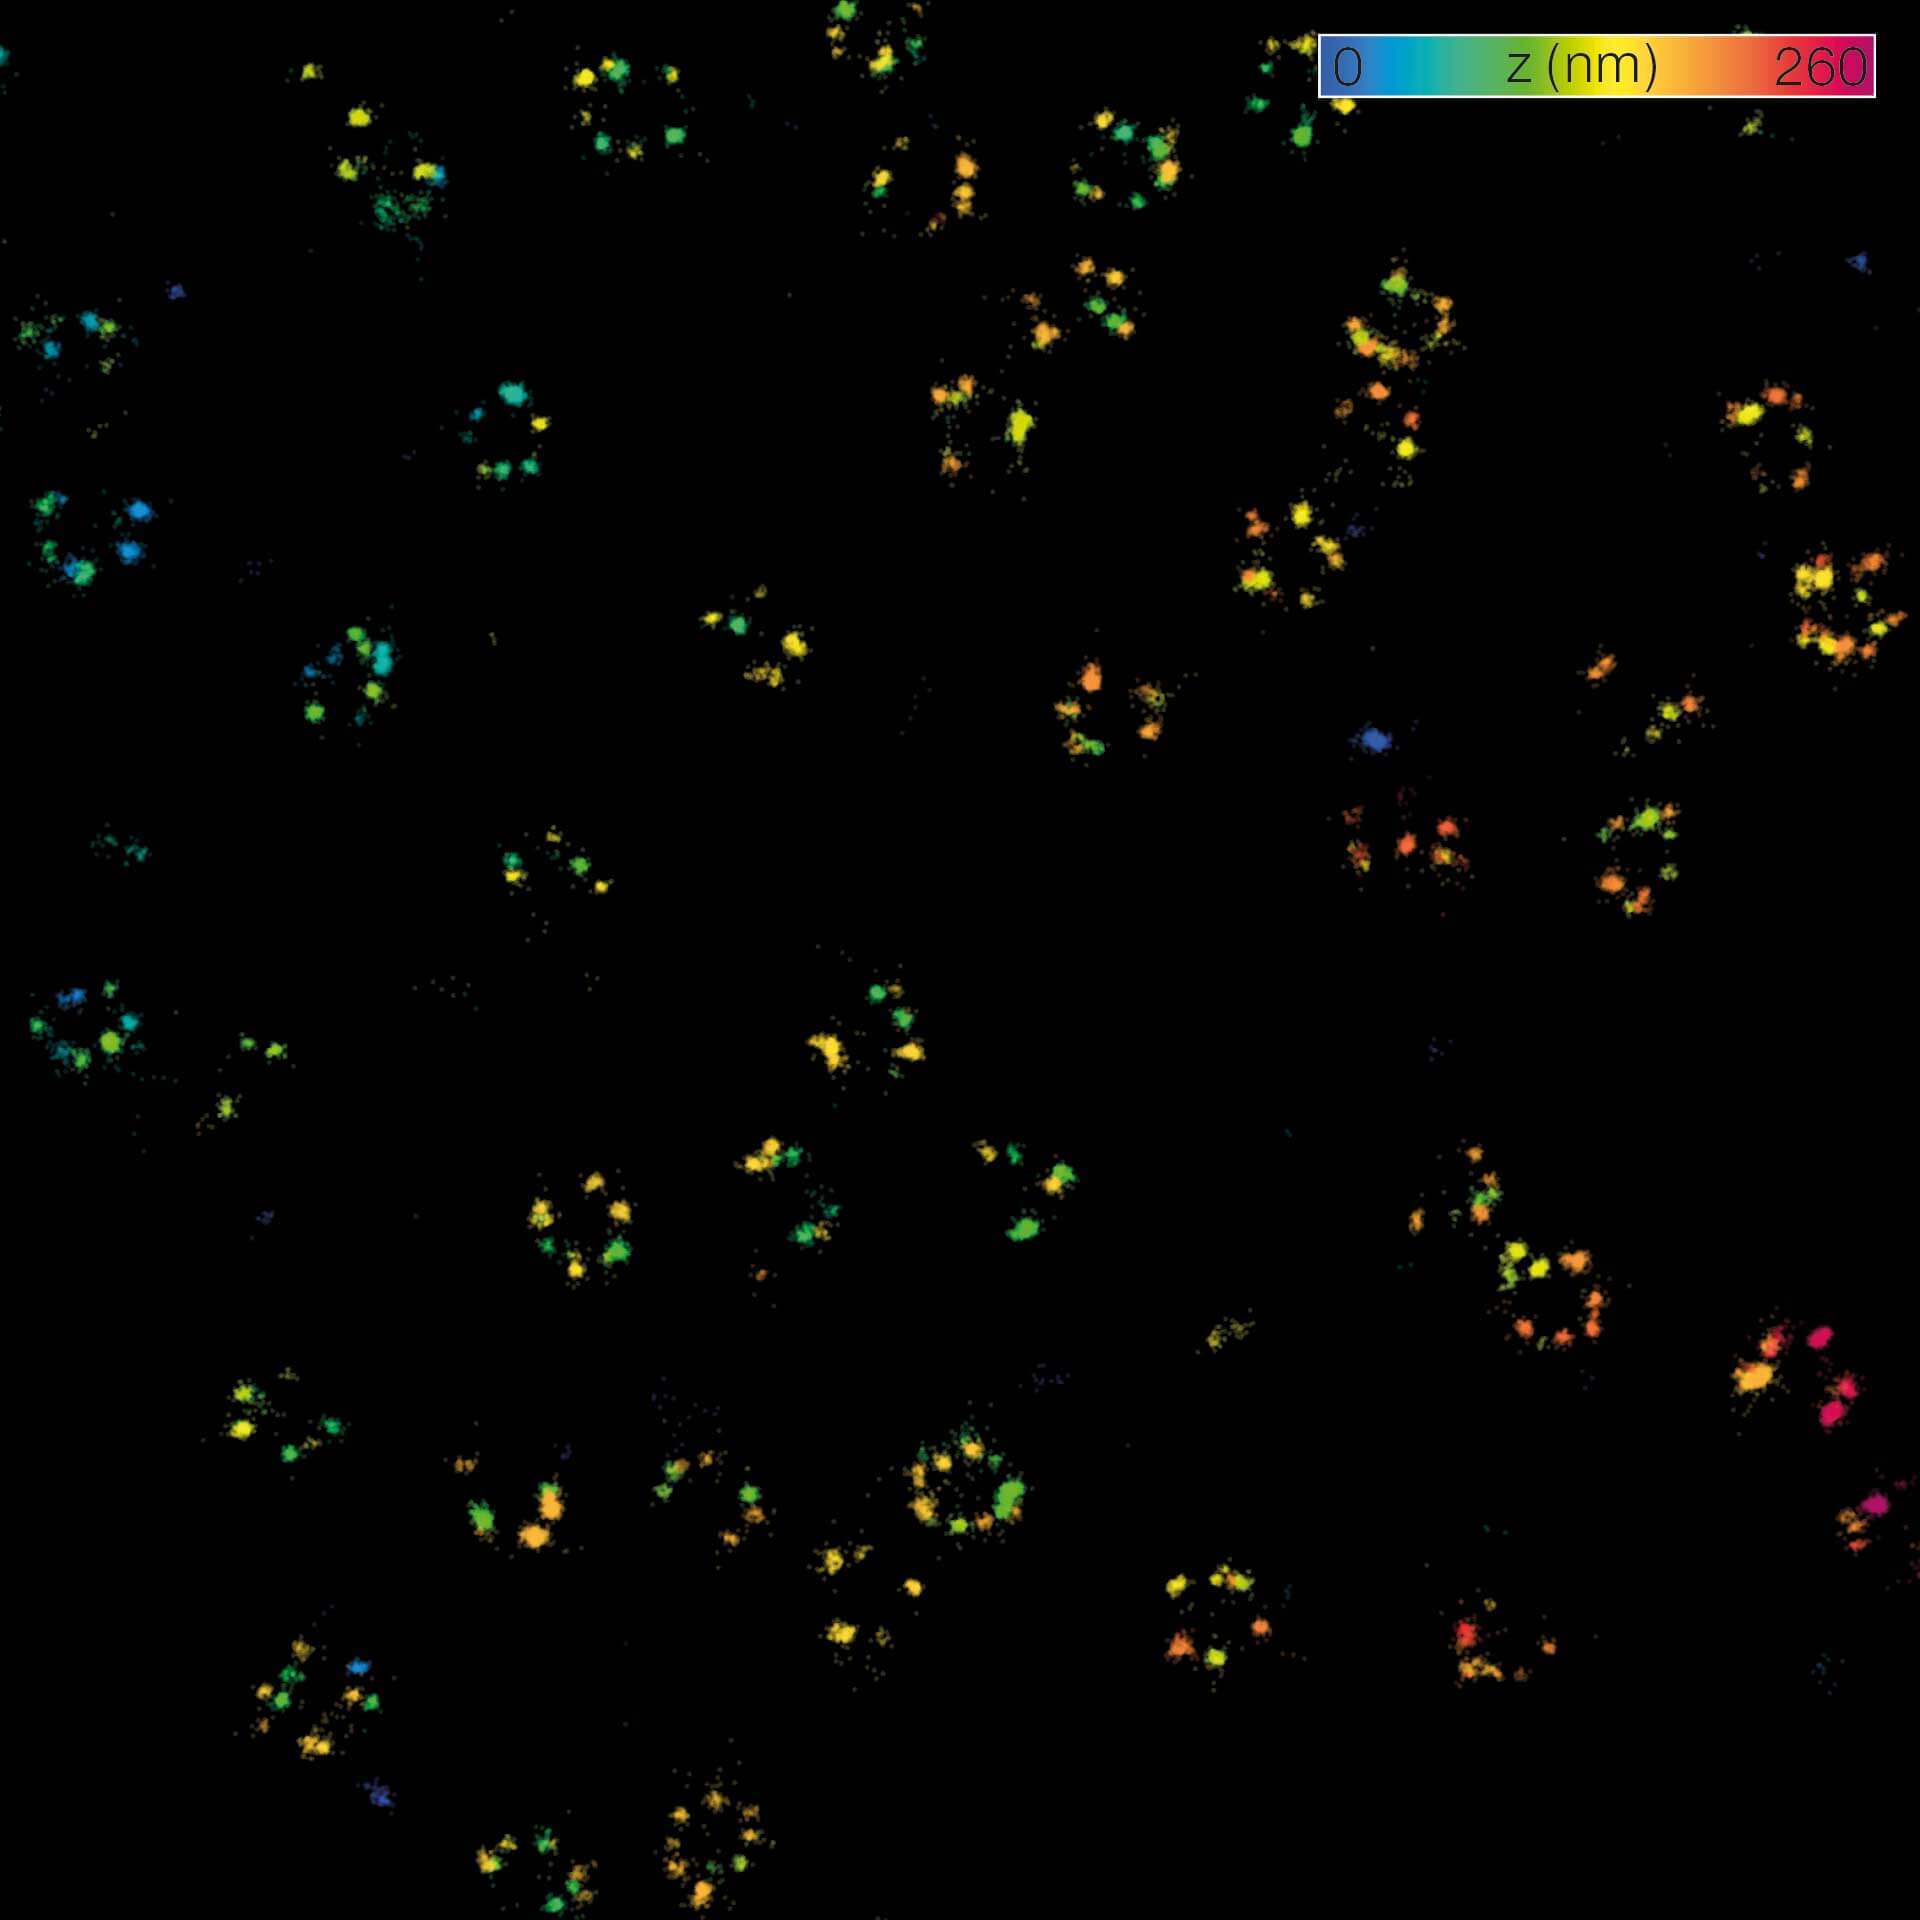
MINFLUX 3D on nuclear pore complexes. Localization precision is better than 3 nm along all directions
Description
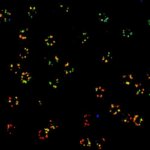
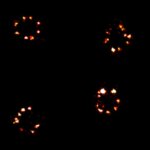
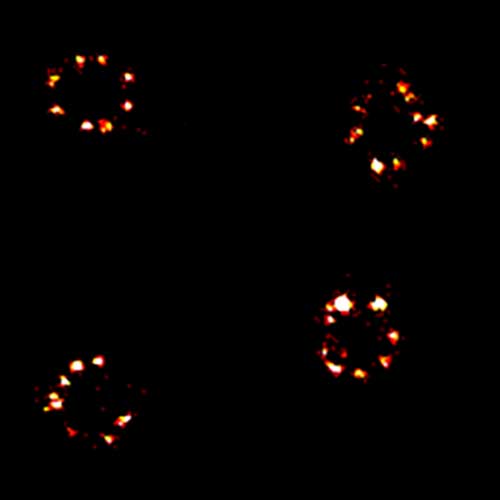
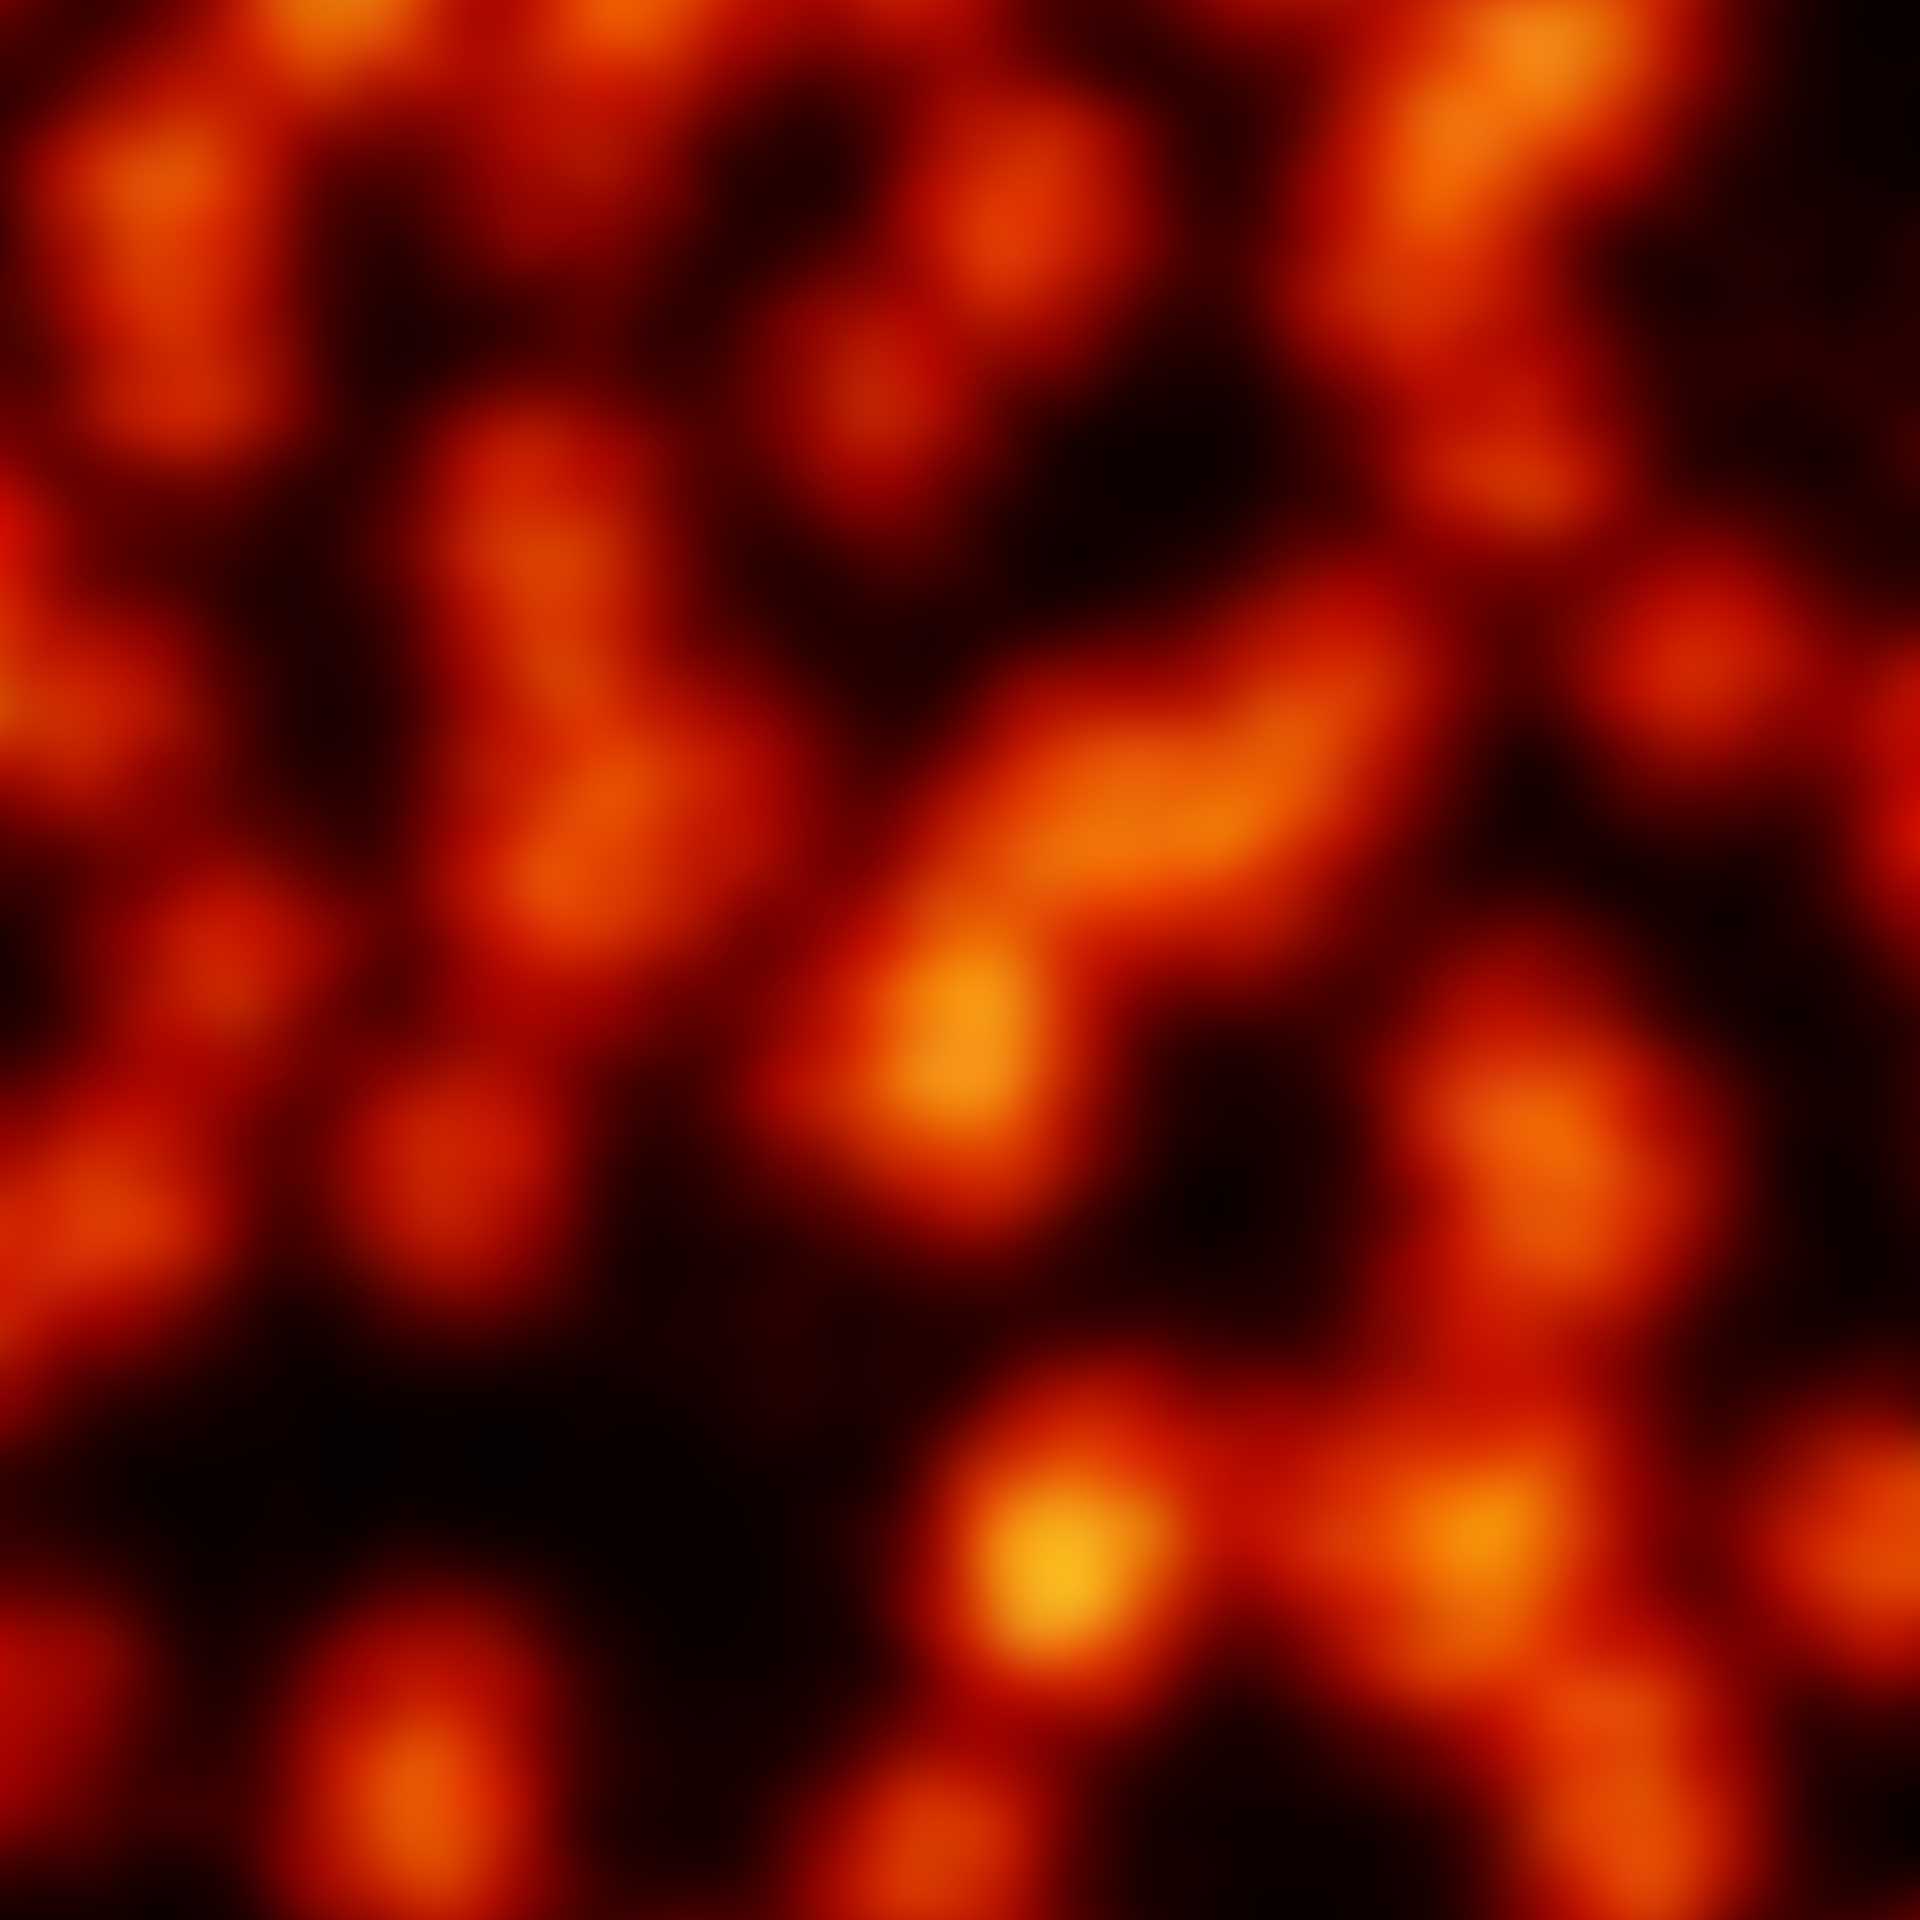
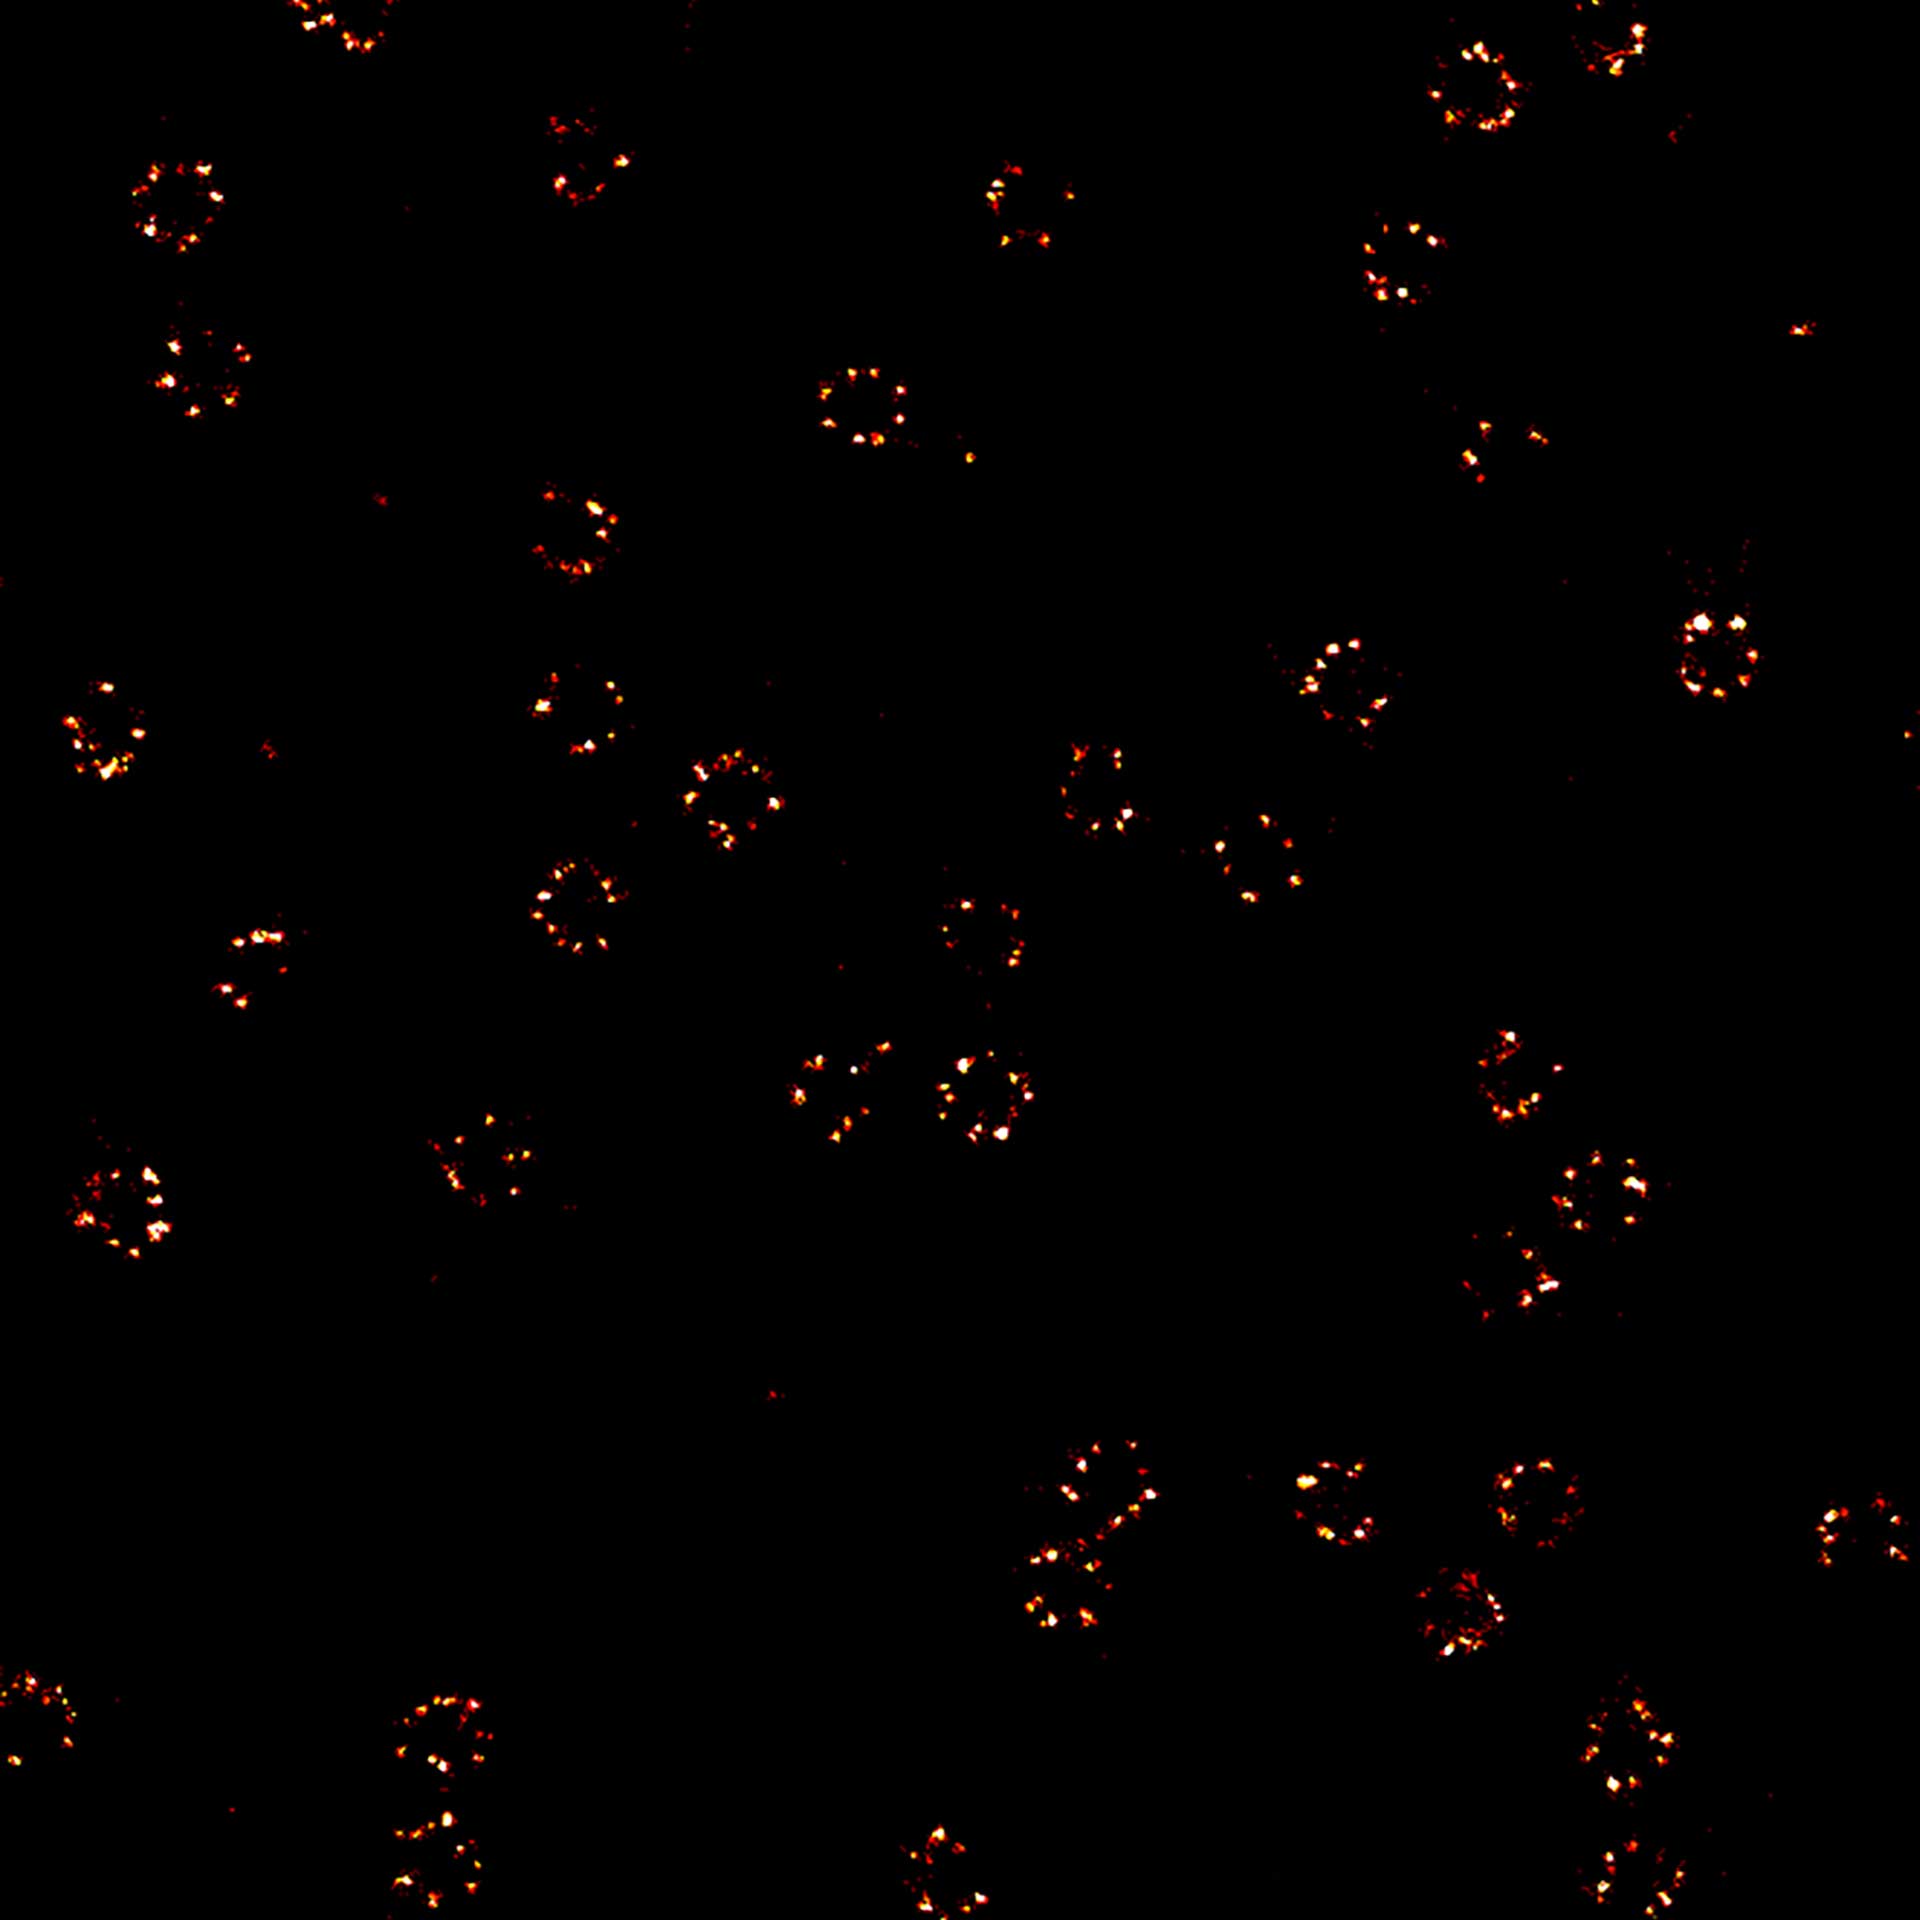
2D MINFLUX nanoscopy of the nuclear pore complex subunits. NUP96-SNAP/SNAP-Alexa Fluor 647 lend themselves as benchmark structures to test superresolution light microscopes. In contrast to confocal microscopy, 2D MINFLUX allows to visualize the shape and arrangement of individual subunits of the nuclear pore complex. Here, we reach localization precisions of ~2 nm in raw localization data.
Description
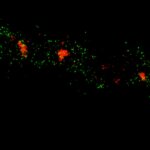
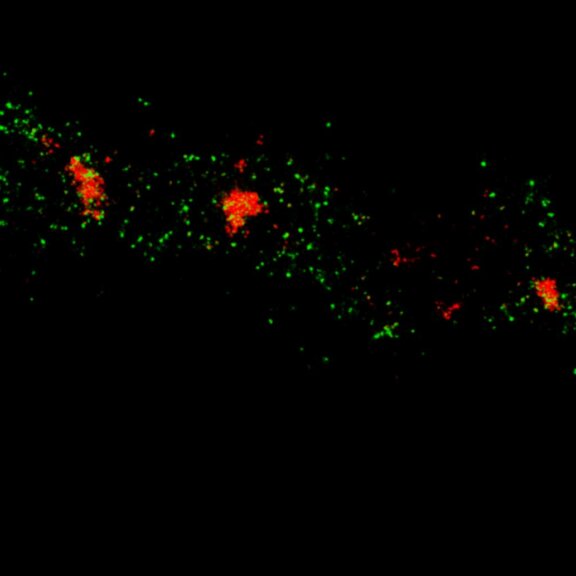
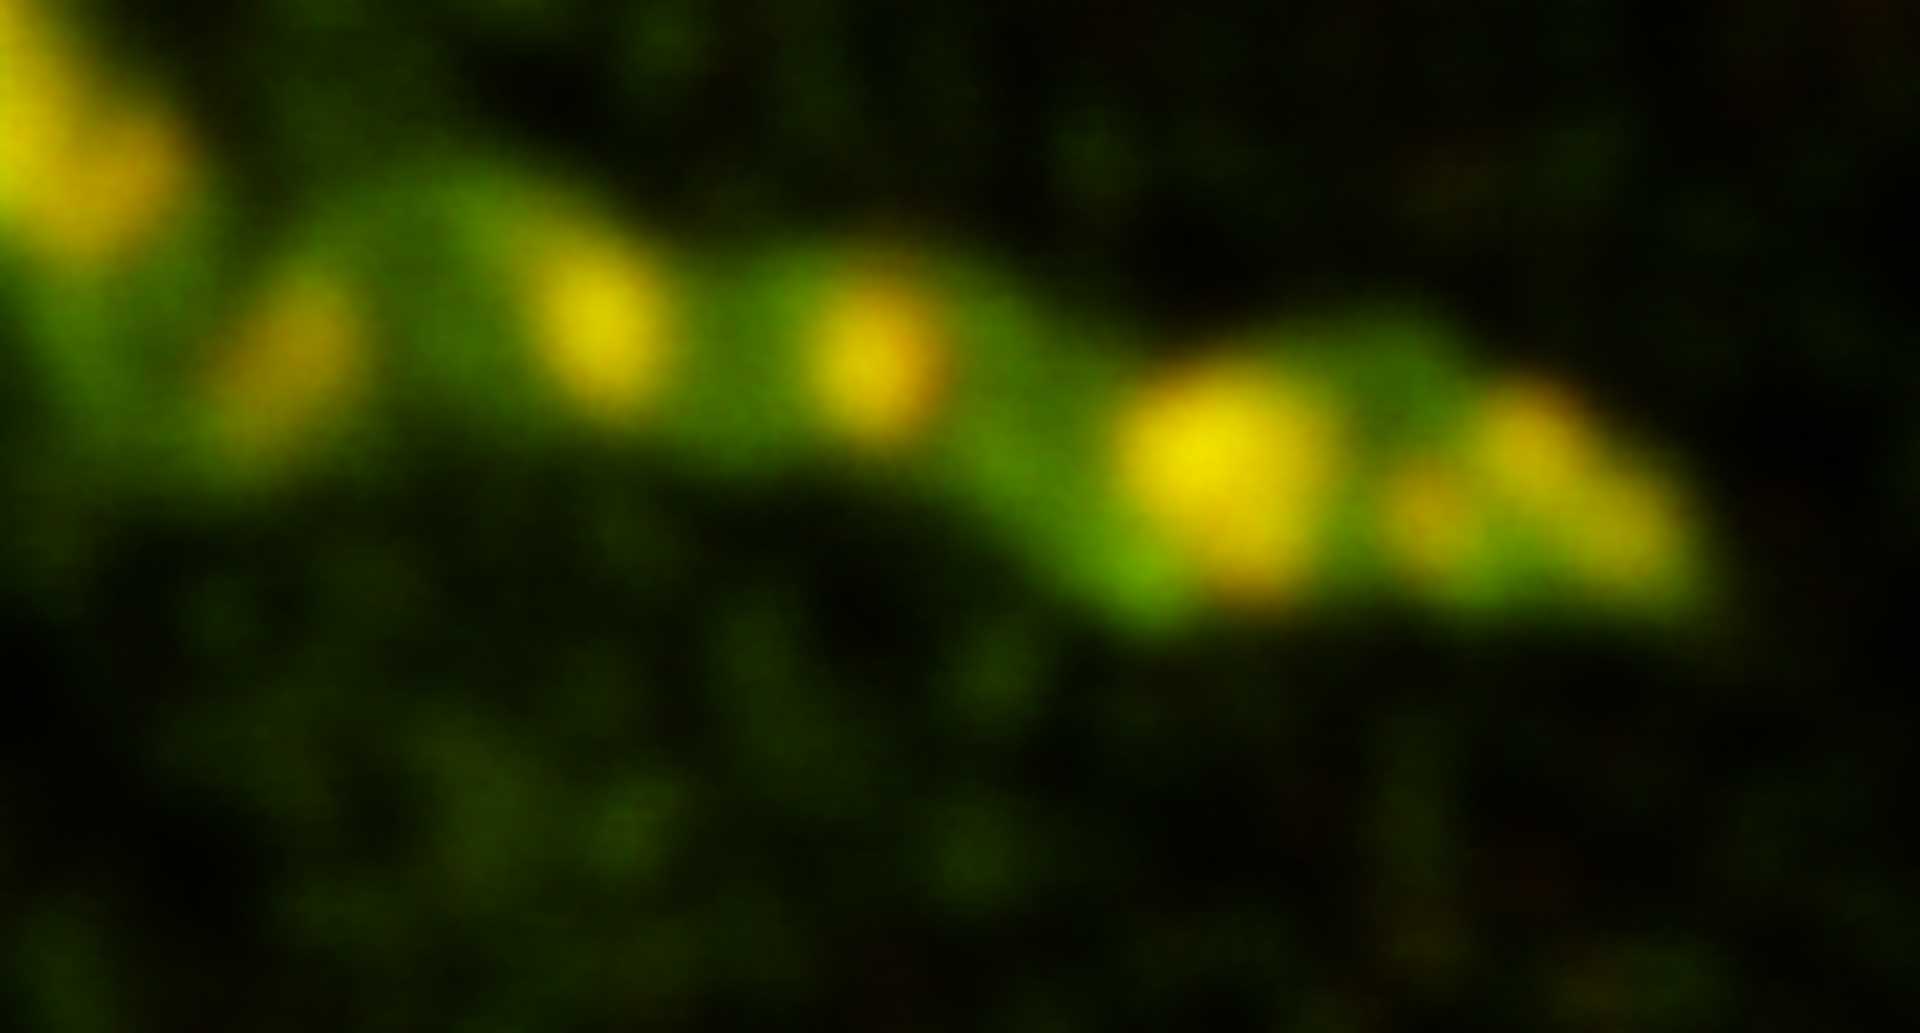
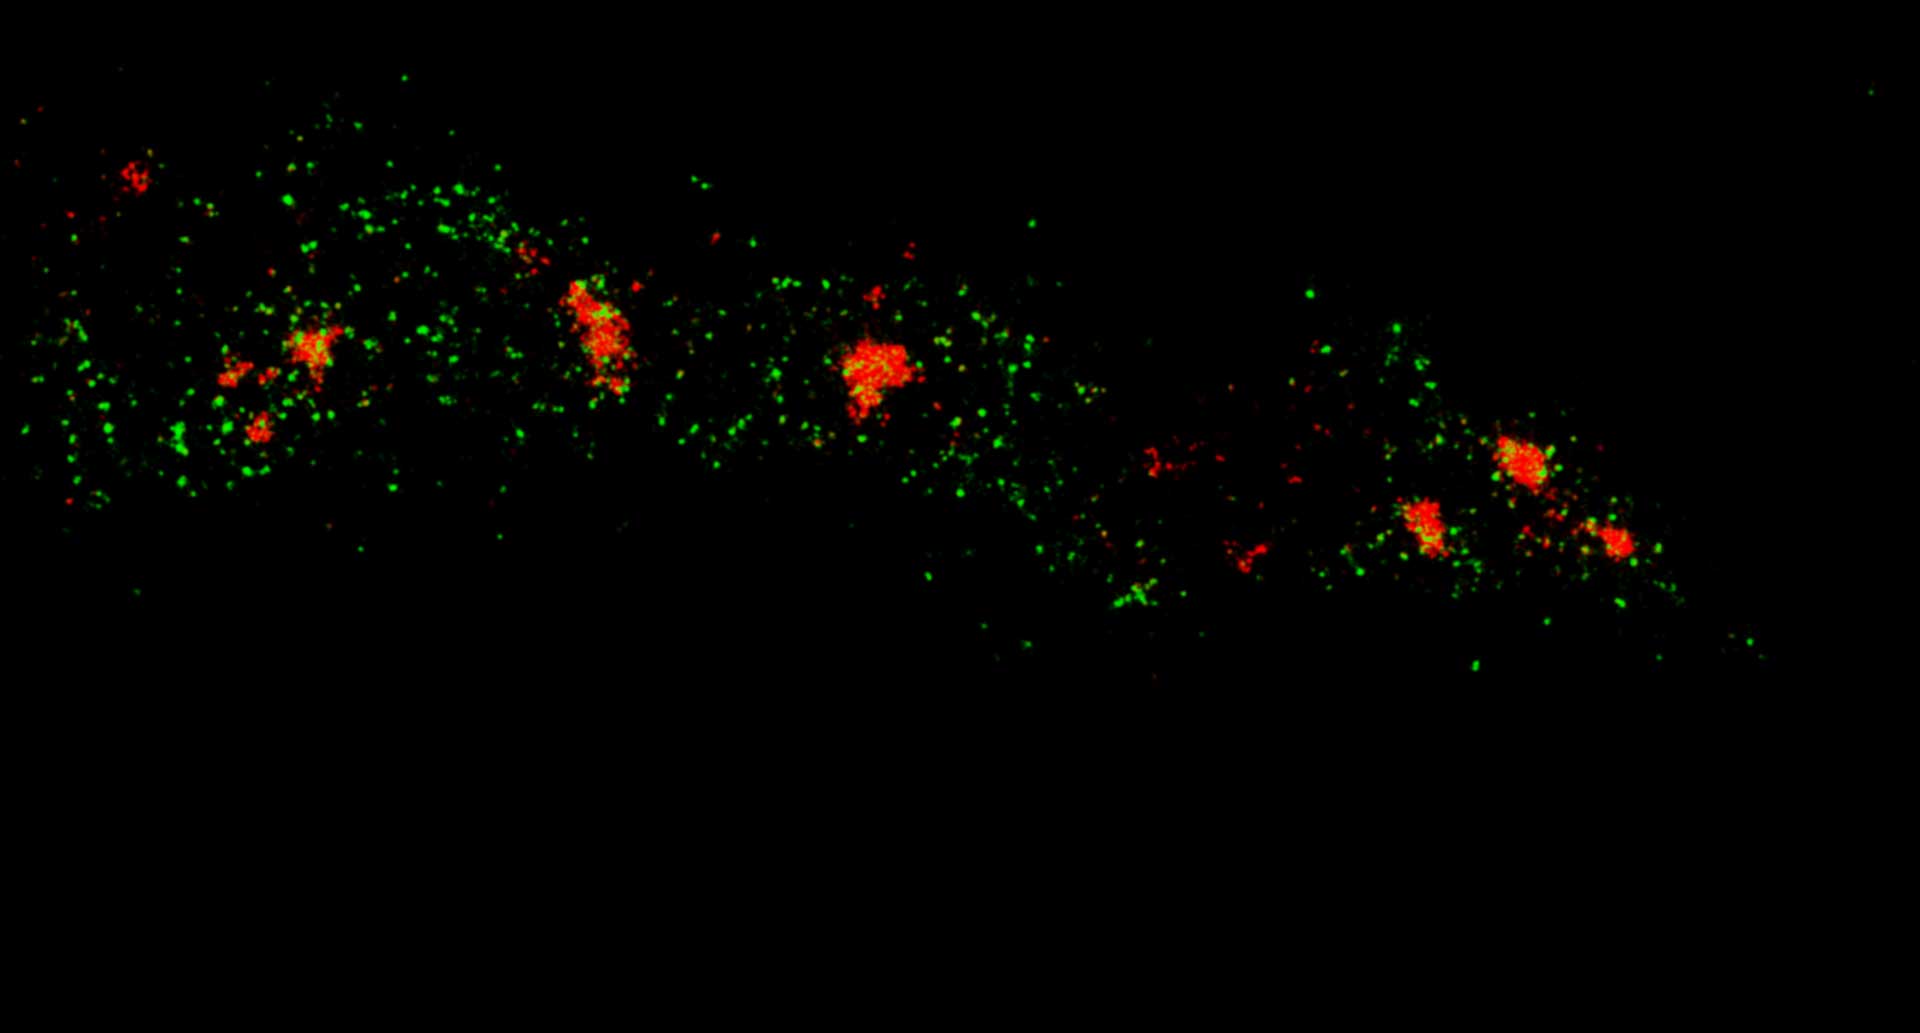
Two-color MINFLUX on mitochondria samples. The mitochondrial proteins TOM20 (green) and mtDNA (red) were labeled in mammalian cells with indirect immunofluorescence using secondary antibodies coupled to sCy5 and CF680. Two-color confocal (A) and MINFLUX (B) was performed using a ratiometric detection strategy. Please note that the labeling density of both structures is highly dissimilar. For TOM20 single proteins are labeled in the mitochondrial membrane, whereas numerous binding sites are decorated in the mtDNA. MINFLUX enables the visualization and separation of both structures.
Description
Confocal and STED time lapse of a living cell expressing SNAP-tag® fusion protein fusion protein in the endoplasmic reticulum lumen with SNAP and C-terminal tetrapeptide KDEL. SNAP-KDEL was labelled with abberior LIVE 610 SNAP ligand (benzylguanine).
The SNAP-KDEL plasmid was a gift from Francesca Bottanelli, FU Berlin.
Description
Live cell time lapse of abberior LIVE 590 DNA probe in cultured mammalian cells.
The use of very low concentrations of our abberior LIVE dyes reduces toxicity and allows long-term imaging of dynamic processes.
Image was acquired with the FACILITY microscope.
Description
Two color live-cell confocal and STED image of a mammalian cell expressing a SNAP-tag® OMP25 fusion protein decoration the outer membrane of mitochondria. OMP25 is visualized by our new abberior LIVE 610 SNAP ligand (orange). Tubulin filaments are highlighted with abberior LIVE 550 tubulin (cyan).
The SNAP-OMP25 plasmid was a gift from Francesca Bottanelli, FU Berlin.
Description
Cultured mammalian cell immunostained for an inner and outer mitochondrial membrane marker. Outer membrane is highlighted with abberior STAR RED (red) and the inner membrane with abberior STAR ORANGE (gray).
STED and confocal images were acquired with abberior's FACILITY microscope.
Description
Three color STED and confocal image of a mammalian cultured cell immunostained for a nuclear pore protein in green and two golgi apparatus markers in red and blue.
abberior STAR RED highlights the golgi apparatus protein giantin (red) and abberior STAR ORANGE visualizes the cis-golgi protein GM130 (blue). NUP98 proteins were stained with abberior STAR GREEN (green).
Description
Three color confocal image of human fibroblast immunostained with abberior STAR 580 for vimentin (green) and with abberior STAR RED for tubulin (red).
DAPI was added to highlight the nucleus (blue).
Description
Four color confocal image of mammalian cultured cells. Peroxisomes were immunostained with abberior STAR RED (magenta) and nuclear pore proteins with abberior STAR 580 (green). F-actin fibers were highlighted with abberior STAR 488 phalloidin (gray).
The nucleus was visualized with DAPI (blue).
Description
Four-color staining of fixed mammalian cells recorded with FACILITY showing nuclear pores (NUP98, STAR RED), Golgi membrane (GM130, STAR 635), Golgi medial rims (Giantin, STAR ORANGE) and actin (STAR 580 phalloidin). Shown left, just using spectral information, STAR RED and STAR 635 (magenta) cannot be separated, because of their similar excitation properties. The same goes for STAR ORANGE and STAR 580 (grey).
With the lifetime information collected by TIMEBOW, these dyes can be distinguished, turning an image with two recording channels into a four-color image. To achieve superresolution only one STED laser at 775 nm was used.
All utilized dyes are manufactured by abberior.
Modules:
Description
MINFLUX 3D nanoscopy of nuclear pore complex subunits. 3D MINFLUX facilitates 3D imaging at molecular scales. In the axial direction localization, we reach precisions of approx. 2.5 nm in raw localization data. Labeling of NUP96-SNAP was performed using SNAP-Alexa Fluor 647.
Description
3D MINFLUX imaging of the peroxisomal membrane protein PMP70 labelled with abberior FLUX 647 in fixed mammalian cells using indirect immunofluorescence. 3D MINFLUX allows visualizing the shape of peroxisomes in all directions.
Description
MINFLUX 3D imaging of Clathrin coated vesicles and Clathrin coated pits. Labeling was performed using clathrin light chain-SNAP together with SNAP-Alexa Fluor 647.
Description
MINFLUX image of the mitochondrial import receptor Tom20 labeled with Alexa Fluor 647 in fixed mammalian cells using indirect immunolabeling. Please note that Tom20 is only localized at the mitochondrial surface.
Description
MINFLUX 3D on nuclear pore complexes. Localization precision is better than 3 nm along all directions
Description
3D MINFLUX allowes to visualize the full shape of peroxisomes.
Description
2D MINFLUX nanoscopy of the nuclear pore complex subunits. NUP96-SNAP/SNAP-Alexa Fluor 647 lend themselves as benchmark structures to test superresolution light microscopes. In contrast to confocal microscopy, 2D MINFLUX allows to visualize the shape and arrangement of individual subunits of the nuclear pore complex. Here, we reach localization precisions of ~2 nm in raw localization data.
Description
Two-color MINFLUX on mitochondria samples. The mitochondrial proteins TOM20 (green) and mtDNA (red) were labeled in mammalian cells with indirect immunofluorescence using secondary antibodies coupled to sCy5 and CF680. Two-color confocal (A) and MINFLUX (B) was performed using a ratiometric detection strategy. Please note that the labeling density of both structures is highly dissimilar. For TOM20 single proteins are labeled in the mitochondrial membrane, whereas numerous binding sites are decorated in the mtDNA. MINFLUX enables the visualization and separation of both structures.


